

©2026 ZenABM - All Rights Reserved.

LinkedIn ABM ROI calculation goes wrong for one reason more than any other.
People divide this quarter’s revenue by this quarter’s spend.
That is arithmetic, but it is not measurement.
Revenue closing today came from spending six to eighteen months ago.
So the sum makes growing programs look bad, and shrinking programs look good.
Well, this guide will solve that for you.
It gives you the four formulas, the three errors that break them, the benchmark numbers to grade yourself against, and one full worked example from first dollar to closed revenue.
A quick overview:
/revenue-attribution, which also refuses to draw conclusions from fewer than 10 accounts.
Use all four.
They answer different questions and fail in different ways.
Number | Formula | Reads in | Answers |
|---|---|---|---|
Pipeline per dollar | Influenced pipeline / ad spend | 60 to 120 days | Is the program working now? |
ROAS | Closed-won revenue / ad spend | One full sales cycle | Did it actually pay? |
CAC payback | Fully loaded cost per customer / monthly gross profit per customer | 12 to 18 months | Can we afford to scale it? |
Incremental lift | Target group result minus control group result | One to two quarters | Did we cause it, or just watch it? |
Pipeline per dollar is the one you manage on, because it moves early enough to change something. ROAS is the one you are judged on.
Keep both, and see the ABM ROI reporting guide for how to present them together.
Let’s look at the four major formulas with worked examples.
Pipeline per dollar = total influenced pipeline in the period / total ad spend in the period
Influenced pipeline is the dollar value of deals that your ABM campaigns touched before the deal was created. That before is doing real work.
A touch after the deal opened is not influence; it is coincidence.
Worked example:
You spent $8,000 in a month. Four deals opened at target accounts your campaigns had touched, worth $30,000, $45,000, $60,000, and $25,000.
Influenced pipeline = 30,000 + 45,000 + 60,000 + 25,000 = $160,000
Pipeline per dollar = 160,000 / 8,000 = $20.00
That is well above the $5.21 median, so the next question is whether the number survives the three error checks below.
ROAS = closed-won revenue influenced / ad spend
Same four deals. Two close, at $45,000 and $25,000, against the same $8,000.
ROAS = 70,000 / 8,000 = 8.75x
Careful here. That $8,000 did not produce those closed deals inside the same month. Formula 2 is only honest when the spend and the revenue belong to the same cohort, which is error 1 below.
If you prefer percentage ROI, it is the same input:
ROI percent = (revenue minus cost) / cost x 100
On $900,000 revenue against $400,000 cost, that is 125 percent.
This is the number a CFO asks for.
ABM CAC = fully loaded ABM cost / new customers acquired
Payback months = CAC / (monthly recurring revenue per customer x gross margin)
Worked example. Fully loaded quarterly cost of $150,000 produces 5 new customers.
CAC = 150,000 / 5 = $30,000
At $3,000 MRR and 80 percent gross margin: 3,000 x 0.8 = $2,400 per month
Payback = 30,000 / 2,400 = 12.5 months
For companies between $10M and $50M ARR, a CAC payback under 14 months is a healthy 2026 target. So 12.5 months passes.
The other three measure correlation. This one gets closer to cause, and it is the only part of a LinkedIn ABM ROI calculation that answers whether the ads changed anything.
Lift = (metric for exposed accounts minus metric for held-out accounts) / metric for held-out accounts
Hold back 10 to 20 percent of your target list as a control group.
Do not advertise to them.
After a quarter or two, compare deal open rates.
Worked example. 400 exposed accounts open 12 deals, a 3.0 percent rate. 100 held-out accounts open 2 deals, a 2.0 percent rate.
Lift = (3.0 minus 2.0) / 2.0 = 50 percent
This is the only calculation here that survives a sceptical CFO because it compares against a group that did not see your ads. It is also the one almost nobody runs.
Each one is common, and each one moves the answer by a lot.
The default calculation divides revenue booked this quarter by spend from this quarter.
Those two numbers are unrelated.
Revenue closing in Q4 came from spend in Q1 or Q2.
Consequences are predictable.
A program that doubled its spend looks like its ROI collapsed because the denominator grew while the numerator still reflects older, smaller spend.
A program that cuts spending looks brilliant for two quarters, then dies.
The fix is cohorting.
Tag every dollar by the month it was spent.
Then follow that month forward.
This is also why connecting ad spend to closed deals has to happen at the account level rather than the click level – something that ZenABM absolutely helps with.


Back to using the cohorting as a fix:
Spend cohort | Spend | Influenced pipeline to date | Closed revenue to date |
|---|---|---|---|
January | $8,000 | $160,000 (by month 4) | $70,000 (by month 9) |
February | $8,000 | $120,000 (by month 4) | $40,000 (by month 9) |
March | $10,000 | $95,000 (month 4 pending) | Too early |
Now each row is comparable, and you can see whether efficiency is improving as spend rises.
Match your measurement window to your actual sales cycle. Measuring 6-month ROI on an 18-month sales cycle guarantees a misleading answer.
Most ABM programs need a 12- to 18-month window before the revenue number means anything.
Ad spend is not your cost. It is the cheapest part of your cost.
Cost line | Include in ad ROAS? | Include in program ROI and CAC? |
|---|---|---|
LinkedIn ad spend | Yes | Yes |
Tooling and data | No | Yes |
Marketing headcount time | No | Yes |
Agency or freelance fees | No | Yes |
Content and creative production | No | Yes |
BDR time on ABM accounts | No | Yes |
Report both, and label them. Ad ROAS answers “is the media working”. Program ROI answers “is the motion worth running”.
Our ABM budget calculator works the target backwards from a revenue goal if you are setting one. Presenting ad ROAS as program ROI is how marketing teams lose credibility in a board meeting.

One account. Four people engaged. Three campaigns touched them. One deal.
If each campaign claims the deal, your reported pipeline is three times the real number. Without opportunity deduplication, the same deal gets credited repeatedly and inflates ROI by 30 percent or more.
The rule: a deal counts once at the program level, no matter how many campaigns or people touched it. For per-campaign reporting, either assign primary credit by a hierarchy rule, or report influence without summing it.
ZenABM’s revenue attribution is deduplicated per ABM campaign by default, which removes this failure mode rather than asking you to police it.

Your own trend tells you if you improved.
Benchmarks from the ZenABM ABM 2026 Benchmark report tell you if you are good, so grade every LinkedIn ABM ROI calculation against both.
Metric | Median | Top performers |
|---|---|---|
Pipeline per dollar | $5.21 | $15.20 |
ROAS | 1.62x | 2.79x |
Deal open rate | 0.58% | 0.66% |
Influenced pipeline per month | $13,819 | $106,500 |
Monthly ad spend | $2,693 | $6,576 |

Read those last two rows together, because the ratio is the real lesson.
Top performers spend about 2.4 times the median and produce about 8 times the influenced pipeline.
The gap is efficiency, not budget, which is the same conclusion the scaling maths reaches from the other direction.
That efficiency point is confirmed elsewhere in the same dataset: moving up a spend tier was not associated with better efficiency, and the weak trend ran slightly negative.

From the same 211 companies:
The practical instruction is short. Model your ROI on spend and impressions.
Do not build a forecast on CTR, and see the CTR benchmark analysis for the underlying correlation work.
Running a LinkedIn ABM ROI calculation in month two and concluding the program failed is the most expensive mistake on this page.
Phase | Months | Expected return | What to report instead |
|---|---|---|---|
Foundation | 1 to 3 | Near zero | Reach, penetration, engagement rate |
Traction | 3 to 6 | 2 to 5x pipeline per dollar | Deal open rate, stage progression |
Scaling | 6 to 12 | 3 to 5x ROAS, $5 to $10 pipeline per dollar | Influenced pipeline growth |
Maturity | 12+ | 5x+ ROAS, $10+ pipeline per dollar | Efficiency and list expansion |
Industry research supports the patience.
ITSMA found average ABM program ROI reaching 137 percent within 18 months, with strong programs at 200 to 400 percent.
Benchmarks are distributions.
Here is one program’s actual arithmetic, which is useful because it shows the numbers moving over time.
Emilia Korczynska ran the LinkedIn ABM program at Userpilot and documented it in full here.
The goal was set backwards from revenue: $3,500,000 in qualified pipeline against a $350,000 annual budget, a 10x target derived from close rate, qualification rate and ACV.
Measured at | Ad spend | Influenced pipeline | Pipeline per dollar |
|---|---|---|---|
90 days | Early spend | Over $650,000 | $12.00 |
16 months | $490,000 | $5,290,737 | $10.79 |
Two things are worth taking from that table.
The 16-month program closed at over 2x ROAS on closed-won revenue, against a 1.62x median. So it was a strong program by benchmark standards.
And efficiency fell slightly as it scaled, from $12.00 to $10.79 per dollar.
That is the expected pattern, and it matches the spend-tier finding above.
Plan for efficiency to dip a little as budget rises, and treat a flat ratio at higher spend as a win.
One LinkedIn ABM ROI calculation, from first dollar to closed revenue, using benchmark constants where you have no data of your own.
Inputs: 500 target accounts. $2,700 monthly ad spend. $40,000 average contract value. 25 percent close rate. 80 percent gross margin. Fully loaded cost is 2.5 times ad spend.
Step 1. Deals opened per month.
500 accounts x 0.58 percent deal open rate = 2.9 deals per month
Step 2. Influenced pipeline per month.
2.9 deals x $40,000 = $116,000
Step 3. Pipeline per dollar.
116,000 / 2,700 = $42.96
That is far above the $15.20 top-performer figure, which tells you the assumed ACV or close rate is optimistic. Rerun it at a $15,000 ACV and you get $16.11, which is realistic.
Treat any result well above benchmark as a prompt to check your inputs.
Step 4. Closed revenue.
2.9 deals x 25 percent close rate = 0.725 customers per month
0.725 x $15,000 = $10,875 revenue per month
Step 5. Ad ROAS.
10,875 / 2,700 = 4.03x
Step 6. Program ROI on fully loaded cost.
Fully loaded cost = 2,700 x 2.5 = $6,750
ROI percent = (10,875 minus 6,750) / 6,750 x 100 = 61 percent
Note the drop.
A 4.03x ad ROAS becomes a 61 percent program ROI once real costs are included.
Both numbers are true, and quoting only the first one is how teams get caught out.
Step 7. CAC and payback.
Monthly CAC = 6,750 / 0.725 = $9,310
Monthly gross profit per customer at $1,250 MRR and 80 percent margin = $1,000
Payback = 9,310 / 1,000 = 9.3 months
Under 14 months, so the program is fundable.
Step 8. Apply the lag. None of step 4 onwards lands in the month you spent the money. Move revenue forward by your sales cycle and re-attach it to the January cohort. Only then compare months.
The formulas are easy.
The inputs are the hard part of any LinkedIn ABM ROI calculation, and most of them do not exist in Campaign Manager.
Input | In Campaign Manager? | Where to get it |
|---|---|---|
Ad spend | Yes | Campaign Manager |
Which companies engaged | No | ZenABM, from the LinkedIn Ads API |
Which of those had deals | No | ZenABM CRM matching |
Touch before deal creation | No | Engagement journeys |
Deduplicated pipeline | No | ZenABM revenue attribution |
Fully loaded cost | No | Your finance team |
ZenABM pulls company-level engagement straight from the LinkedIn Ads API, so every impression and click is attributed to a named company rather than an anonymous audience.

ZenABM matches engaged companies to deals in HubSpot or Salesforce automatically, which is the join that turns ad data into revenue data.
This matters because most CRMs cannot do it alone.
LinkedIn ad influence usually shows up as nothing at all in native reporting.


Influence only counts if the ad touched the account before the deal was created.
The engagement journey puts every touchpoint on one timeline against CRM deal events, so you can verify the sequence rather than assert it.


ZenABM computes pipeline per dollar, ACV, and ROAS per ABM campaign, deduplicated, so the four formulas above are already applied to your data.
Sync the metrics onto the company record so sales and finance see the same numbers you do.

If you run more than one paid channel, ZenABM’s multi-channel attribution keeps the denominator honest by counting touches that did not happen on LinkedIn.

Read related: ABM KPIs: the metrics that actually predict pipeline.
Running these formulas by hand every month is the part that stops happening by March.
An AI agent with direct access to the data removes that.
MCP is the standard that lets an AI client query an outside data source.
The endpoint is https://app.zenabm.com/api/mcp, authenticated with a Bearer token or OAuth.
In Claude Code, you add it once, then run /init to write a CLAUDE.md so the agent keeps standing context about your account.


It works in ChatGPT too, through a custom connector.


The server ships 15 workflows as slash commands. /revenue-attribution is the one for this job.
It runs spend-to-pipeline economics per ABM campaign, adds a correlation analysis with p-values, and states plainly that correlation is not causation.
It also refuses to conclude anything from fewer than 10 companies, which is the guardrail most spreadsheets lack.
ZenABM has also made four broad Claude code skills public on a repo:
/plugin marketplace add ZENABM/linkedin-abm-skills
/plugin install linkedin-abm-skills@zenabm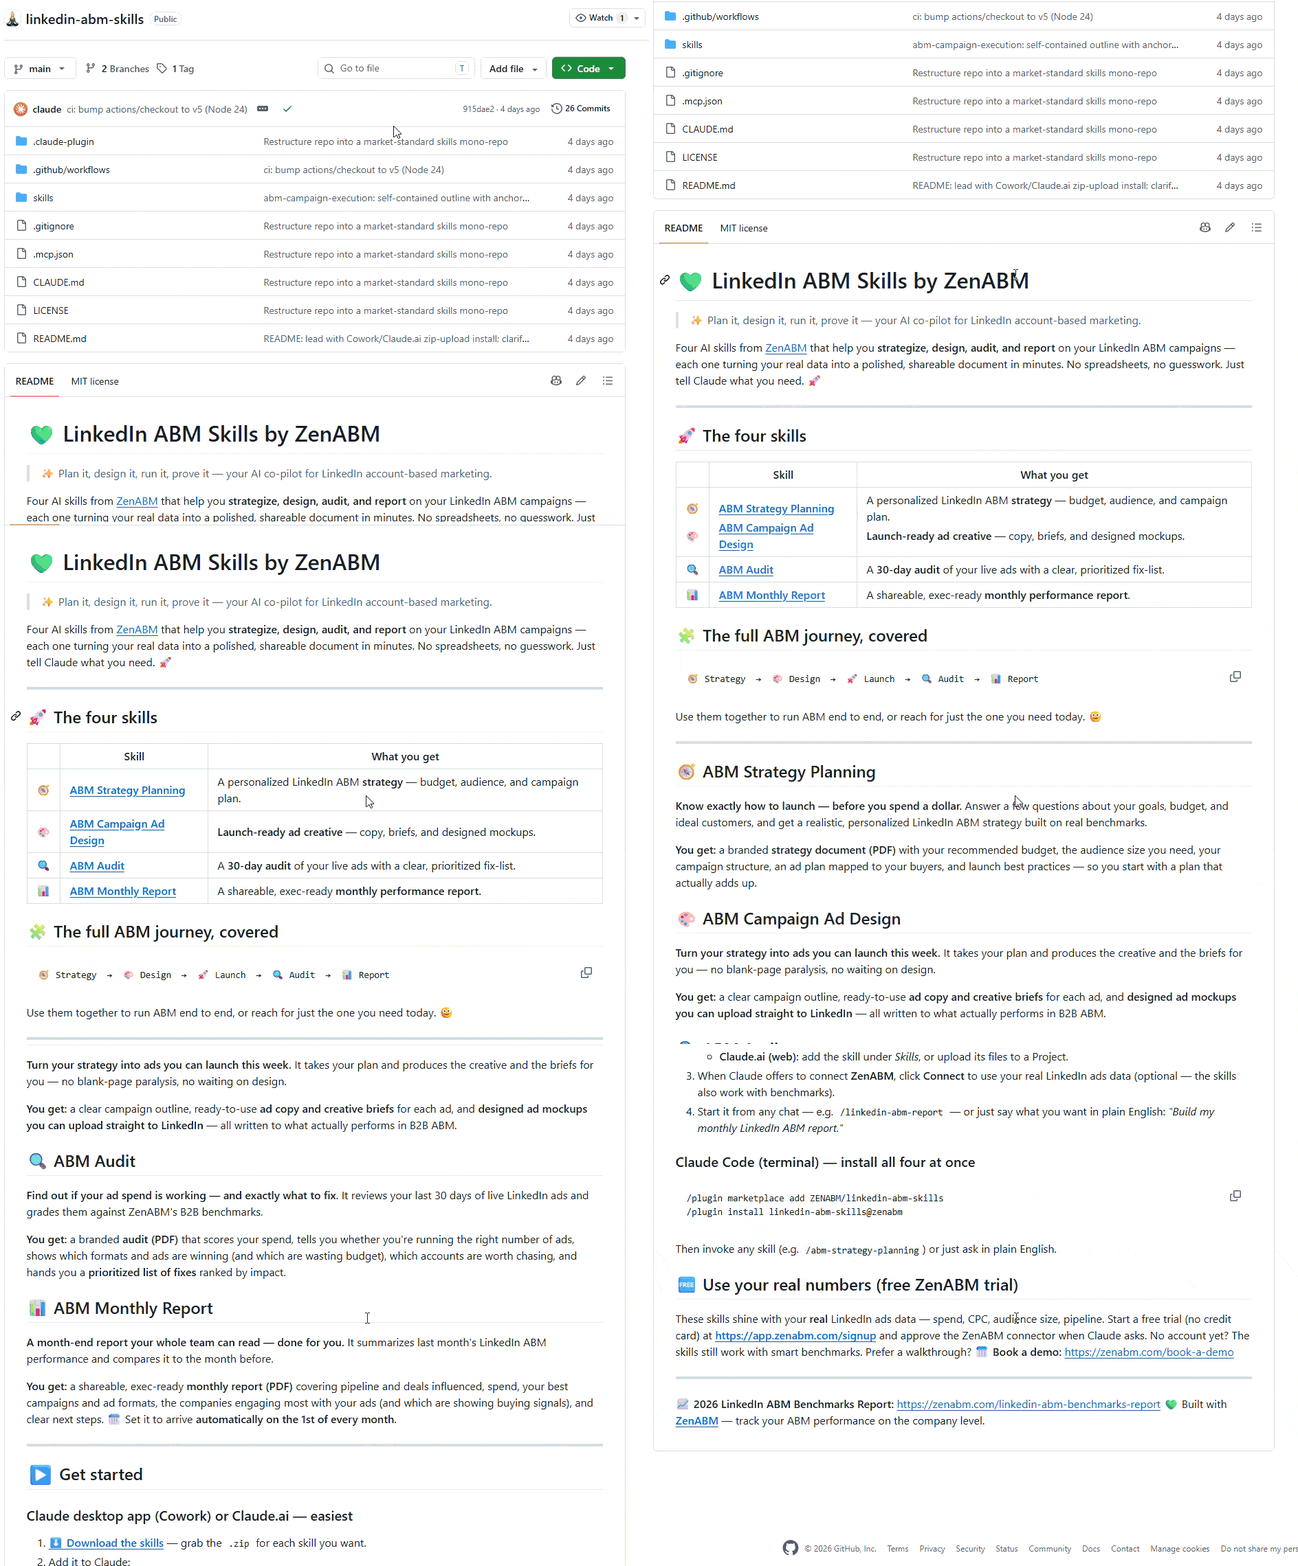
For the cohorted calculation that fixes error 1:
Calculate my LinkedIn ABM ROI by spend cohort. Group ad spend by the month it was spent. For each month, show total spend, the influenced pipeline from deals created after that spend at accounts touched before deal creation, and the closed-won revenue to date. Then show pipeline per dollar and ROAS for each cohort. Do not divide this month’s revenue by this month’s spend. Flag any cohort with fewer than 10 companies as too small to conclude from.

For the fully loaded view that fixes error 2:
Take my influenced pipeline and closed-won revenue for the last 6 months. Calculate ad ROAS using ad spend only. Then recalculate program ROI using a fully loaded cost of ad spend multiplied by 2.5, and show both side by side with the percentage difference. Also calculate CAC per new customer and the payback period at $1,250 MRR and 80 percent gross margin.
For the sanity check on error 3:
List every deal my ABM campaigns influenced in the last quarter, with the campaigns that touched each one. Show me any deal touched by more than one campaign, and confirm whether my total influenced pipeline counts those deals once or multiple times. Give me the deduplicated total and the naive total so I can see the gap.
Zena, the AI agent inside ZenABM, answers the same questions in plain English and carries the benchmark data, so it can tell you whether your ROAS is good rather than only what it is.

Different audiences break different numbers, so present the LinkedIn ABM ROI calculation differently to each.
Audience | Report | Do not report |
|---|---|---|
You, weekly | Reach, penetration, engagement rate, stage progression | ROAS. It cannot move weekly. |
CMO, monthly | Influenced pipeline, pipeline per dollar, ROAS | Impressions and CTR |
CFO or board, quarterly | Program ROI on fully loaded cost, CAC payback, incremental lift | Ad ROAS presented as program ROI |
Three rules that keep the report credible.
State the window and the cohort every time. A number without a period attached invites the wrong comparison.
Say influenced, not generated, unless you ran a control group. Influence is a correlation claim and should sound like one.
Show the account count behind every percentage.
A 3 percent deal open rate from 40 accounts is noise, and someone will eventually ask.
For a worked example of a program reported this way, the FlowFuse case study is a useful reference.
The formulas are simple. The discipline is not.
Cohort your spend so revenue is matched to the money that produced it. Include real costs in the denominator when you say ROI. Deduplicate deals so one win is counted once.
Then grade the result against $5.21 pipeline per dollar and 1.62x ROAS, and against your own program age.
If you only change one thing, change the timing. Stop dividing this quarter’s revenue by this quarter’s spend and start tracking spend cohorts forward. That single correction moves most reported ABM ROI numbers more than any optimization you could run this quarter.
The company-level and CRM-matched data a LinkedIn ABM ROI calculation needs is the part LinkedIn does not provide.
If you want it on your own program, ZenABM is free for 37 days with full functionality, and deduplicated attribution, engagement journeys and the MCP connection can be running before your next board update.
You can also book a demo with us to know more.
A LinkedIn ABM ROI calculation uses four numbers, not one. Pipeline per dollar is influenced pipeline divided by ad spend. ROAS is closed-won revenue divided by ad spend. Program ROI is revenue minus fully loaded cost, divided by fully loaded cost. CAC payback is cost per customer divided by monthly gross profit per customer. Cohort spend by month and follow each cohort forward, rather than dividing one period’s revenue by the same period’s spend.
The median in the ZenABM 2026 benchmark of 211 companies is 1.62x, meaning $1.62 in closed revenue per dollar of ad spend. Top performers reach 2.79x. On pipeline rather than revenue, the median is $5.21 per dollar and top performers reach $15.20. Judge against your program age too, since 5x ROAS is a month 12 expectation, not a month 3 one.
Influenced pipeline counts deals your campaigns touched before the deal was created, which suits ABM because a buying journey involves many people and touchpoints. Sourced pipeline credits a single first touch, which understates ABM badly. Whichever you use in your LinkedIn ABM ROI calculation, deduplicate: without it the same deal gets credited to several campaigns and inflates the total by 30 percent or more.
Expect near zero in months 1 to 3, 2 to 5x pipeline per dollar between months 3 and 6, 3 to 5x ROAS between months 6 and 12, and 5x or better after month 12. Report leading indicators such as reach, penetration and stage progression during the early phase. Measuring a 6-month ROI against an 18-month sales cycle produces a misleading answer every time.
Yes, for program ROI and CAC, and no for ad ROAS. Report both and label them clearly. Fully loaded cost includes ad spend, tooling, marketing headcount time, agency fees, content production and BDR time. In the worked example above, a 4.03x ad ROAS becomes a 61 percent program ROI once real costs are added, and presenting only the first number is what damages credibility with finance.
Run a holdout. Keep 10 to 20 percent of your target list unexposed, then compare deal open rates after a quarter or two. Lift equals the exposed rate minus the held-out rate, divided by the held-out rate. Every other part of a LinkedIn ABM ROI calculation measures correlation, which is still useful but should be described as influence. The engagement journey gives you the audit trail showing touches preceded deal creation.
You need something that ties LinkedIn ad engagement to named companies and then to CRM deals, because Campaign Manager does not. ZenABM pulls company-level engagement from the LinkedIn Ads API, matches it to HubSpot or Salesforce deals, and calculates deduplicated pipeline per dollar, ACV and ROAS per campaign. The MCP server then runs the same calculation on demand through Claude Code or ChatGPT.
