
Every ABM KPI list I have read follows the same pattern. They list 10-15 metrics – engagement rate, pipeline velocity, win rate, account coverage – and then stop. No benchmarks. No context. No explanation of which metrics are leading indicators and which are lagging. No guidance on when to expect results or what “good” looks like at each stage. That is not helpful. If you are running ABM on LinkedIn, you need more than a list of metric names. You need to know what numbers to aim for, which KPIs actually predict pipeline, and which ones are vanity metrics dressed up as strategy. I analyzed data from 211 companies running LinkedIn ABM campaigns through ZenABM for our 2026 benchmarks report. What I found is that most teams are tracking the wrong things. The KPIs that feel important – like click-through rate – have almost zero correlation with pipeline generation. And the KPIs that actually predict revenue are the ones most teams do not even measure. This post covers the ABM KPIs that matter, with real benchmark numbers so you know exactly where you stand. 
The fundamental problem with most ABM KPI advice is that it treats all metrics as equal. A blog post listing “13 ABM KPIs to track” implies that all 13 matter the same amount. They do not. Here is what I have learned from studying the data across 211 companies: CTR does not predict pipeline. The correlation between click-through rate and pipeline generation in our dataset is rho = -0.170. That is a slight negative correlation. Companies with higher CTRs do not generate more pipeline – if anything, the relationship trends the other direction. Yet CTR is the first metric on nearly every ABM KPI list. Ad spend does predict pipeline. The correlation between ad spend and pipeline is rho = 0.566. That is a meaningful positive correlation. Companies that invest more in reaching their target accounts generate proportionally more pipeline. This makes intuitive sense, but it contradicts the popular advice of “optimize for efficiency over spend.” Timing matters more than any single metric. A KPI that is meaningless at month two becomes critical at month six. If you are measuring pipeline ROI after 60 days of ABM, you will conclude it does not work – even when it is working perfectly. ABM has a maturity curve, and your KPIs need to match it. The right framework is not “here are 15 metrics to track.” The right framework is: which KPIs matter at each stage of your ABM program, and what numbers should you expect at each stage?
Before diving into specific metrics, you need to understand the difference between leading and lagging ABM KPIs. This distinction is what separates teams that can course-correct early from teams that wait six months to discover something is broken.
Leading indicators tell you whether your ABM program is on track before pipeline shows up. They measure awareness, reach, and engagement – the early signals that predict future revenue.
 If these numbers look healthy but pipeline has not arrived yet, keep going. The pipeline will follow. If these numbers are poor, no amount of waiting will fix the pipeline problem – you need to adjust your targeting, creative, or budget now. How to measure them? Use tools like ZenABM that combine your Linkedin Ad performance data on account level (from Campaign Manager API) and CRM data (deals, demos etc) to give you a full picture of how specific companies in your ABM target audience are performing + aggregate ABM campaign analytics:

Lagging indicators measure what has already happened. They are the output of everything upstream.
These are the numbers your CFO cares about. But they only become meaningful after 3-6 months of running ABM. If you only track lagging indicators, you are flying blind for the first two quarters. 
These are the metrics you track from day one. They tell you whether you are actually reaching the accounts that matter.
This is the most basic ABM KPI, and it is the one most teams fail on first. Target account reach measures the percentage of companies on your target account list that have received at least one ad impression. Benchmark: 50% or higher within the first 60 days. If you upload a list of 500 target accounts and after two months only 150 of them have been reached, something is wrong. Either your matched audience rate is low, your budget is too thin, or your targeting is too narrow on top of the company list. Most teams do not track this because LinkedIn Campaign Manager does not show it. You need a tool that maps impressions to company-level data and compares that against your target account list. This is one of the core features I built into ZenABM’s analytics dashboards because it is so fundamental. 
Audience penetration goes one level deeper than reach. It measures the percentage of people within your target audience (at those accounts) who have seen your ads at least once in a given month. Benchmarks from our 2026 data:
| Audience Type | Monthly Penetration Target |
|---|---|
| Cold accounts (not yet aware) | 30-50% |
| Warm accounts (aware/engaged) | 70-90% |
 Why the difference? Cold accounts need broad reach to build awareness. But you cannot afford to saturate them at the same frequency as warm accounts – the budget math does not work. Warm accounts are a smaller pool and are already familiar with you, so high penetration reinforces existing awareness and pushes them to the next stage.
Reach tells you who you touched. Frequency tells you how deeply. Impressions per person per month measures the average number of times each individual at a target account sees your ads. Benchmarks:
| Audience Type | Impressions per Person per Month |
|---|---|
| Cold accounts | 6-10 |
| Warm accounts | 10+ |
Below 6 impressions per month, you are unlikely to build meaningful awareness. Above 10 for cold accounts, you risk ad fatigue without enough creative rotation. The sweet spot depends on your creative refresh rate – if you are swapping creatives every 2-3 weeks, you can sustain higher frequencies. Related to this: we found that ad creative starts losing effectiveness after approximately 2.5-3 impressions per person. That means if you are running one creative at 10 impressions per person per month, the last 7 impressions are getting diminishing returns. You need 3-4 creatives in rotation to maintain effectiveness at the recommended frequency.
Engagement rate in ABM is not the same as engagement rate in Campaign Manager. In ABM, engagement rate measures the percentage of reached accounts that have taken a meaningful action – a click, a video view, a website visit, a content download. Benchmark: 15-25% of reached accounts should show engagement signals. If you reach 300 accounts and only 20 of them show any engagement (6.7%), your creative is not resonating or your offer is not relevant to the audience. If 80 accounts are engaging (26.7%), you are in a strong position and those accounts are prime candidates for stage progression.
 This is the KPI that connects awareness metrics to pipeline metrics. Stage progression measures how many accounts move from one funnel stage to the next each month. ABM funnel stages: Identified – Aware – Engaged – Interested – Opportunity Benchmark: 5-10% of accounts should progress to the next stage each month. If you have 200 accounts in the “Aware” stage, 10-20 of them should move to “Engaged” each month. If progression is below 5%, your content is not compelling enough to drive deeper engagement. If it is above 10%, your program is performing well and you should consider expanding your target account list.

Once accounts are aware of you, the next set of KPIs measures how deeply they are engaging. These are the metrics that sit between “they have seen our ads” and “they have opened a deal.”
I said earlier that CTR does not predict pipeline. That is true at the aggregate level. But CTR by ad format is still useful as a creative performance indicator – it tells you whether your ads are generating interest, even if that interest does not directly translate to pipeline. 2026 benchmarks (median across 211 companies):
| Ad Format | Median CTR |
|---|---|
| Thought Leader Ads (TLA) | 2.68% |
| Single Image Ads | 0.42% |
TLAs dramatically outperform other formats on CTR. This is because they appear as personal posts in the feed rather than obvious advertisements. But remember – a high CTR does not mean you can cut budget on other formats. Single image ads play a different role in the journey (direct product messaging, retargeting), and their impact shows up in pipeline attribution, not in click rates.
Dwell time measures how long people spend looking at your ad before scrolling past. It is a better indicator of creative quality than CTR because it captures attention even when someone does not click. 2026 benchmarks:
| Ad Format | Median Dwell Time |
|---|---|
| Thought Leader Ads | 6.63 seconds |
| Carousel Ads | 4.56 seconds |
| Single Image Ads | 3.64 seconds |
TLAs again lead here. 6.63 seconds of attention is substantial in a social feed – that is enough time to read 2-3 sentences and absorb your key message. Carousel ads also perform well because they invite interaction (swiping), which keeps people engaged longer.
This is a KPI most teams do not think about, but it directly impacts every other engagement metric. Creative fatigue measures how quickly your ads lose effectiveness with repeated exposure. Benchmark: Ads start losing effectiveness after 2.5-3 impressions per person. Once someone has seen the same creative 3 times, their likelihood of clicking drops significantly. If your frequency is 10 impressions per person per month (which it should be for warm accounts), you need to rotate at least 3-4 different creatives to avoid fatigue. Track this by monitoring CTR and engagement trends per creative over time. When CTR starts declining for a specific ad, it is time to swap it out – not time to conclude that ABM is not working.
These are the KPIs that determine whether your ABM program is generating business results. They require 3-6 months of campaign history to become meaningful.
 Deal open rate measures the percentage of target accounts that have opened a deal in your CRM. It is the bridge between marketing metrics and sales outcomes. 2026 benchmarks:
| Performance Level | Deal Open Rate |
|---|---|
| Median (all companies) | 0.58% |
| Top performers | 0.66% |
These numbers might look small, but context matters. If you are targeting 500 accounts, a 0.58% deal open rate means roughly 3 new deals per month from your target list. With an average deal size of $30-50k, that is $90-150k in new pipeline monthly from a $2,700 ad spend. The math works.
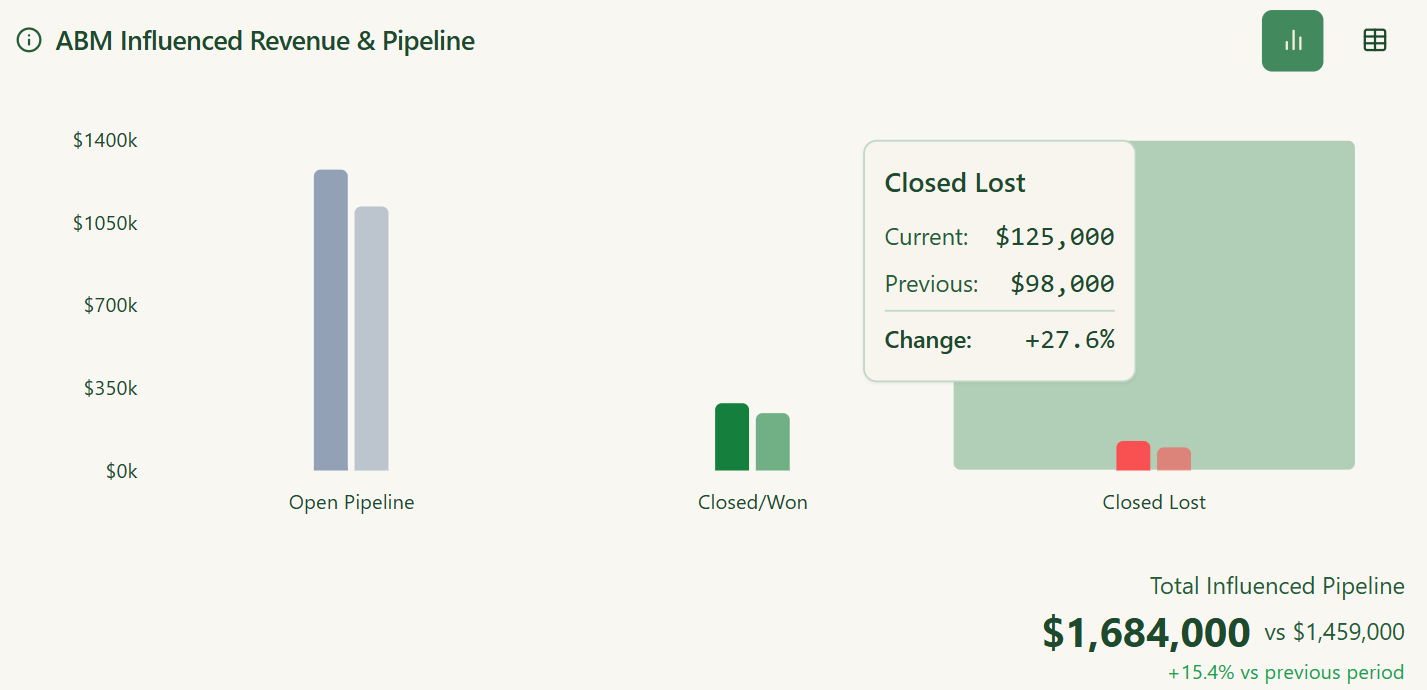 Influenced pipeline is the total dollar value of deals that were touched by your ABM campaigns before the deal was created. This uses influence-based attribution rather than click-based last-touch attribution – because in ABM, the buying journey involves dozens of touchpoints across multiple people at the same company. 2026 benchmarks:
| Performance Level | Monthly Influenced Pipeline |
|---|---|
| Median (all companies) | $13,819/month |
| Top performers | $106,500/month |
The gap between median and top performers is significant – nearly 8x. What explains it? Mostly two things: budget (top performers spend $6,576/month vs $2,693 median) and program maturity (top performers have typically been running ABM for 6+ months).
Pipeline per dollar is my favorite ABM KPI because it normalizes for budget differences. It answers: for every dollar I spend on LinkedIn ads, how much pipeline do I generate? 2026 benchmarks:
| Performance Level | Pipeline per Dollar |
|---|---|
| Median (all companies) | $5.21 |
| Top performers | $15.20 |
$5.21 in pipeline for every dollar spent is a strong result for most B2B companies. If your average deal size is $40k and your close rate is 25%, that $5.21 in pipeline translates to about $1.30 in revenue per dollar spent – a 30% return on ad spend. Top performers generating $15.20 in pipeline per dollar are seeing returns that make ABM one of the highest-ROI channels in their marketing mix.
ROAS measures closed-won revenue divided by ad spend. It is the ultimate lagging indicator – the final word on whether your ABM investment paid off. 2026 benchmarks:
| Performance Level | ROAS |
|---|---|
| Median (all companies) | 1.62x |
| Top performers | 2.79x |
A 1.62x ROAS means for every $1 spent on LinkedIn ads, $1.62 in revenue was closed. That is a 62% return. Top performers are seeing 179% returns. Keep in mind that ROAS compounds over time as your ABM program matures – most companies see their ROAS improve significantly between months 6 and 12. 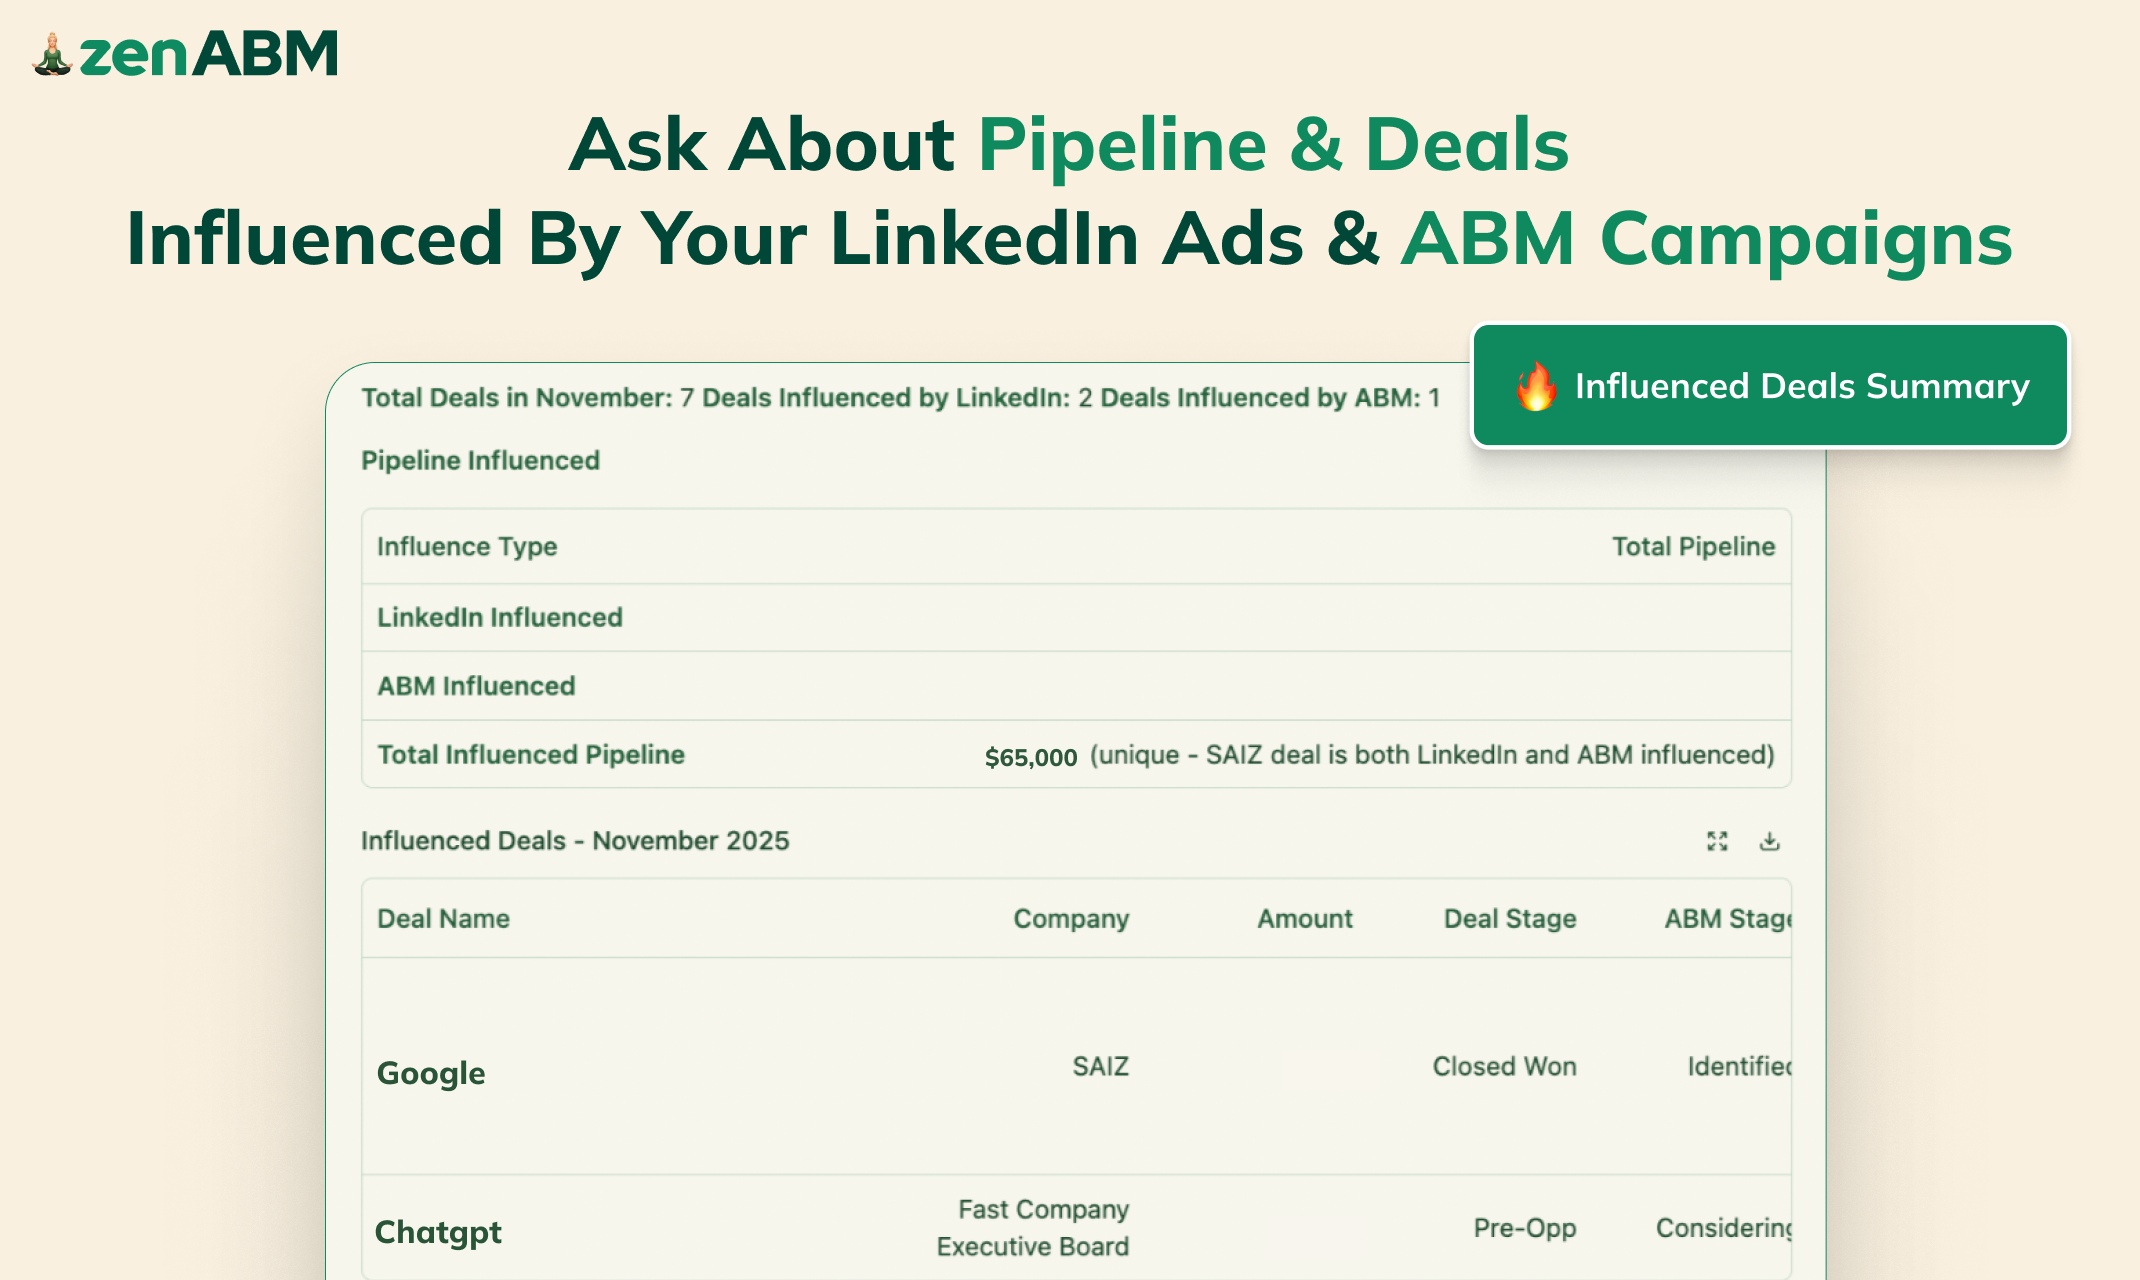
Here is the dashboard I recommend for monthly ABM reporting. It covers all four layers: reach, engagement, pipeline, and revenue.
| Category | KPI | Benchmark | Frequency |
|---|---|---|---|
| Reach | Target account reach | 50%+ within 60 days | Weekly |
| Reach | Audience penetration (cold) | 30-50% monthly | Monthly |
| Reach | Audience penetration (warm) | 70-90% monthly | Monthly |
| Reach | Impressions per person (cold) | 6-10/month | Monthly |
| Reach | Impressions per person (warm) | 10+/month | Monthly |
| Engagement | Engagement rate | 15-25% of reached accounts | Monthly |
| Engagement | Stage progression rate | 5-10% monthly | Monthly |
| Engagement | TLA CTR | 2.68% median | Weekly |
| Engagement | Creative fatigue threshold | Rotate at 2.5-3 impressions/person | Bi-weekly |
| Pipeline | Deal open rate | 0.58% median | Monthly |
| Pipeline | Influenced pipeline | $13,819/month median | Monthly |
| Pipeline | Pipeline per dollar | $5.21 median | Monthly |
| Revenue | ROAS | 1.62x median | Quarterly |
| Budget | Monthly ad spend | $2,693 median | Monthly |
A few notes on this dashboard. Do not report all of these numbers to your executive team. They care about three things: influenced pipeline, ROAS, and pipeline per dollar. The reach and engagement metrics are for you and your team to diagnose and optimize. Share them when someone asks “why is pipeline up/down this quarter” – they provide the explanation. You can do all of the above in ZenABM btw. 
This is the section that most ABM KPI guides skip entirely, and it is arguably the most important. ABM is not a channel you turn on and see results in 30 days. It has a predictable maturity curve, and your expectations need to match it.
What to expect: No meaningful pipeline ROI. Leading indicators should be healthy, but pipeline numbers will be near zero. KPIs to focus on:
Common mistake: Shutting down the program because pipeline ROI is zero. Of course it is zero – you have not had enough time for the buying cycle to complete. Judge this phase on leading indicators only.
What to expect: First pipeline signals. Accounts that entered the funnel in month 1 are now reaching the Engaged and Interested stages. Some will start opening deals. KPIs to focus on:
Common mistake: Comparing your month-4 ROAS to a mature program’s benchmarks. The benchmarks in this post are cross-sectional medians that include programs at all stages. A new program at month 4 should be below the median on pipeline metrics.
What to expect: Pipeline becomes consistent and predictable. Your ABM flywheel is spinning – new accounts are entering the funnel while earlier accounts are converting. KPIs to focus on:
Common mistake: Keeping the same budget when the data supports scaling. If your pipeline per dollar is $5+, increasing spend should proportionally increase pipeline (rho = 0.566 between spend and pipeline).
What to expect: Best-in-class results. Your audience knows you, your retargeting pools are deep, and your creative team has data on what works. KPIs to focus on:
Common mistake: Getting complacent with creative. Even mature programs need fresh content. Ad fatigue is real, and the 2.5-3 impressions per creative threshold does not change just because your program is 12 months old.
CTR is not a pipeline predictor. The data from 211 companies shows a slight negative correlation (rho = -0.170) between CTR and pipeline. Stop optimizing for clicks and start optimizing for account-level reach and frequency. Ad spend correlates with pipeline. The rho = 0.566 correlation between spend and pipeline means that underspending is the most common ABM mistake. The median monthly spend of $2,693 generates $13,819 in pipeline. Top performers spend $6,576 and generate $106,500. Leading indicators are more important than lagging ones in the first 6 months. Target account reach, audience penetration, and stage progression tell you whether your program is on track months before pipeline data becomes meaningful. ABM takes 3-6 months to produce pipeline. This is not a flaw – it is the natural timeline of B2B buying decisions. Set expectations with your leadership team before you start, not after month two when someone asks where the ROI is. Creative fatigue is a hidden ABM killer. Ads lose effectiveness after 2.5-3 impressions per person. At recommended frequencies of 6-10+ impressions per month, you need 3-4 creatives in rotation at all times. Pipeline per dollar is the best single ABM KPI. It normalizes for budget differences, connects marketing activity to business outcomes, and is easy for non-marketers to understand. The median is $5.21, top performers hit $15.20.
Pipeline per dollar spent. It directly connects your ABM investment to business outcomes and normalizes for budget size. The median across 211 companies running LinkedIn ABM is $5.21 in pipeline per dollar of ad spend, with top performers reaching $15.20. Unlike CTR or engagement rate, pipeline per dollar tells you whether your program is generating real business results – not just activity.
Expect no meaningful pipeline ROI for the first 3 months. Months 3-6 typically produce the first pipeline signals, with 2-5x pipeline per dollar. Months 6-12 is where ABM hits its stride with 3-5x ROAS and $5-10 pipeline per dollar. Mature programs (12+ months) can achieve 5x+ ROAS and $10+ pipeline per dollar. The key is to track leading indicators (account reach, engagement rate, stage progression) during the early months so you know the program is on track.
No. Our data from 211 companies shows a slight negative correlation (rho = -0.170) between CTR and pipeline generation. This means higher click rates do not predict more pipeline. CTR is still useful as a creative quality indicator for individual ads, but it should never be used to judge overall ABM program health. Focus on account-level metrics like reach, penetration, and stage progression instead.
The median monthly spend across 211 companies is $2,693, with top performers spending $6,576. There is a meaningful positive correlation (rho = 0.566) between ad spend and pipeline generation. As a starting point, I recommend budgeting enough to reach 50%+ of your target account list within 60 days with a frequency of 6-10 impressions per person per month. For a target list of 200-500 accounts, that typically means $2,000-5,000 per month depending on your geography and targeting specificity.
Keep executive reporting focused on three metrics: influenced pipeline (total dollar value of deals touched by your ABM campaigns), pipeline per dollar spent (the efficiency of your investment), and ROAS (closed-won revenue divided by ad spend). These are the numbers that connect your ABM program to business outcomes in language that finance and leadership teams understand. Save the operational metrics – account reach, penetration, engagement rate, stage progression – for your marketing team’s internal reviews where they can be used to diagnose and optimize performance.