You can see which companies engaged with your LinkedIn ads in Campaign Manager's Companies tab (Plan > Companies), but it shows overall engagement per company, not the journey by campaign and ad format. That gap matters if you run several ABM campaigns at once, because you need to know what each account engaged with, and when. Here is where to find the data, what it hides, and how company engagement looks when it is split by campaign and format.
How to see which companies engaged with your LinkedIn ads: quick summary
- Where to look: Campaign Manager > Plan > Companies lists every company that engaged with your ads.
- What it shows: paid impressions, clicks, leads and organic engagement for each company.
- Never people: LinkedIn reports companies, not individuals, and hides companies below a minimum engagement threshold.
- The limit: the tab gives overall company engagement, so the story by campaign and ad format is hard to see.
- Why it matters for ABM: you run different messages, products and stages in parallel, so you need to know which one worked.
- Click inflation: one person with several employers can count once per employer, so paid clicks can look 20 to 30% high.
- In ZenABM: Company engagements shows each company's whole journey over time, split by campaign and ad format, with engagement score, ABM stage, intents and CRM data on one row. Plans start at $59/month, and G2 rates it 5.0/5 from 6 reviews.
Here is the whole post in one picture:

Using LinkedIn Campaign Manager's Companies tab to see which companies engaged with your ads
The Companies tab sits at Plan > Companies in Campaign Manager. LinkedIn replaced the Company Engagement Report with it in late 2024, so if you are searching for the old report, this is where it went. For the wider picture, see how to measure LinkedIn ad engagement for target accounts.
It is not just a new name. LinkedIn announced the change in November 2024, and the tab now combines paid and organic metrics, has more filters and lets you save a list as an audience. Here is the companies table, with impressions, clicks and engagements per account:

To use it:
- Open your ad account in Campaign Manager.
- Click Plan in the left panel, then Companies.
- Pick a reporting window from the top. Third-party tutorials list 7 to 180 days, and a 365-day lookback now appears on the company screen.
- Filter by uploaded company list, campaign, objective, company size or country, and sort by paid impressions.
- Click a company row to open its journey view, which shows impressions, engagements and clicks over time, with paid and organic side by side.
To judge engagement, look at paid impressions, paid clicks, leads, organic impressions and organic engagements. There are also columns for paid video views and cost per qualified lead.
One caveat comes from Filip Saračević's breakdown of the five Companies tab updates. A company's status and open pipeline appear only if a CRM, such as Salesforce, is connected directly to Campaign Manager. Without that connection you still get the engagement journey, just without pipeline.
Can you see who clicked on your LinkedIn ads?
No, not as individuals. Campaign Manager shows which companies clicked, not which people.
LinkedIn also holds back small signals. In our ZenABM webinar on LinkedIn ad campaign setup, we explained that LinkedIn won't report a company where fewer than three people engaged, even if a CTO clicked 15 times. As I explained in my post on mapping campaigns, you need a minimum of 3 engagements from 3 different members. Mapping to the campaign group level raises your chance of passing that threshold, because engagement from every campaign rolls up into it.
Paid clicks can also look too high. Ivars Krutainis found that one person with several active roles is counted once per role, so company-tab clicks can be overstated by 20 to 30%. Unrelated companies can also appear in a tight ABM list.
If you want to guess the role, check which job titles got the impressions on a given asset. In our webinar Paid social is outbound's intent layer, Val Dimitrov made the same point: LinkedIn reports at company level only, so if a few titles got most of the impressions, you can infer which role is engaging. ZenABM groups engagement by job title, so you can see which roles engaged with each campaign. Here is the job title view, with impressions, clicks and CTR per campaign group:

Companies tab vs ZenABM: what's the difference?
The Companies tab gives you overall company engagement metrics. ZenABM lets you see the whole company journey over time, split by campaign and ad format.
That is the real gap, so I'm careful not to overstate it. LinkedIn's tab now has campaign and objective filters and a journey view. What it does not give you is each company's history by campaign and ad format next to its ABM stage, intent and CRM data. Here is how the two compare:
Campaign Manager Companies tab | ZenABM | |
|---|---|---|
Company-level engagement | Yes, overall metrics per company | Yes, per company, from LinkedIn's API |
Journey over time | Journey view per company, paid and organic | Whole company journey over time |
Split by campaign and ad group | Filter by campaign and objective | Per campaign and campaign group, with the ad sets timeline |
Split by ad format | Not documented by LinkedIn | Ad format breakdown per company, through Zena |
ABM stage and engagement score | No | Account stages and engagement score, with thresholds by company size |
Intent signals per account | No | Themed campaigns become intent signals per account |
CRM data on the same row | Only with a CRM connected directly to Campaign Manager | Synced to HubSpot, Salesforce or Attio |
Deals and pipeline | Only with the CRM connection | Deal attribution dashboard |
Privacy threshold | Hides companies below a minimum engagement threshold | Weekly Sunday sync that surfaces more than a single week returns |
Price and rating | Included with ad spend | From $59/month, G2 5.0/5 from 6 reviews |
Why does the split matter? ABM campaigns on LinkedIn vary by message, product and stage of the buyer journey. This is how Userpilot structured its programme:

Each stream varies by ad creative and copy, by budget, delivery schedule and owning team, and by the targeted stage of the buyer journey. So each stream needs its own engagement read. If Company Y sees ads for both Product A and Product B, the Companies tab tells you it engaged, but not which one it responded to.
This is why I report at company level and not on ad CTR. I check accounts reached against the target list, accounts moving up a stage, stalled accounts and impression hogs. Then I exclude the hogs and send high-CTR non-customers to sales. Ad CTR misses all of this, including funnel progression and which companies eat impressions without engaging.
A per-campaign split also shows what an aggregate hides. In week one of our Q4 ABM campaign, we reached 1,712 cold companies and 43 warm ones, with cold at a $2.20 average CPM and warm at $35.07. A blended number would have blurred those two very different motions. The numbers come from my Q4 ABM campaign post.
Here is one company's campaigns over time, in the ad sets timeline view:
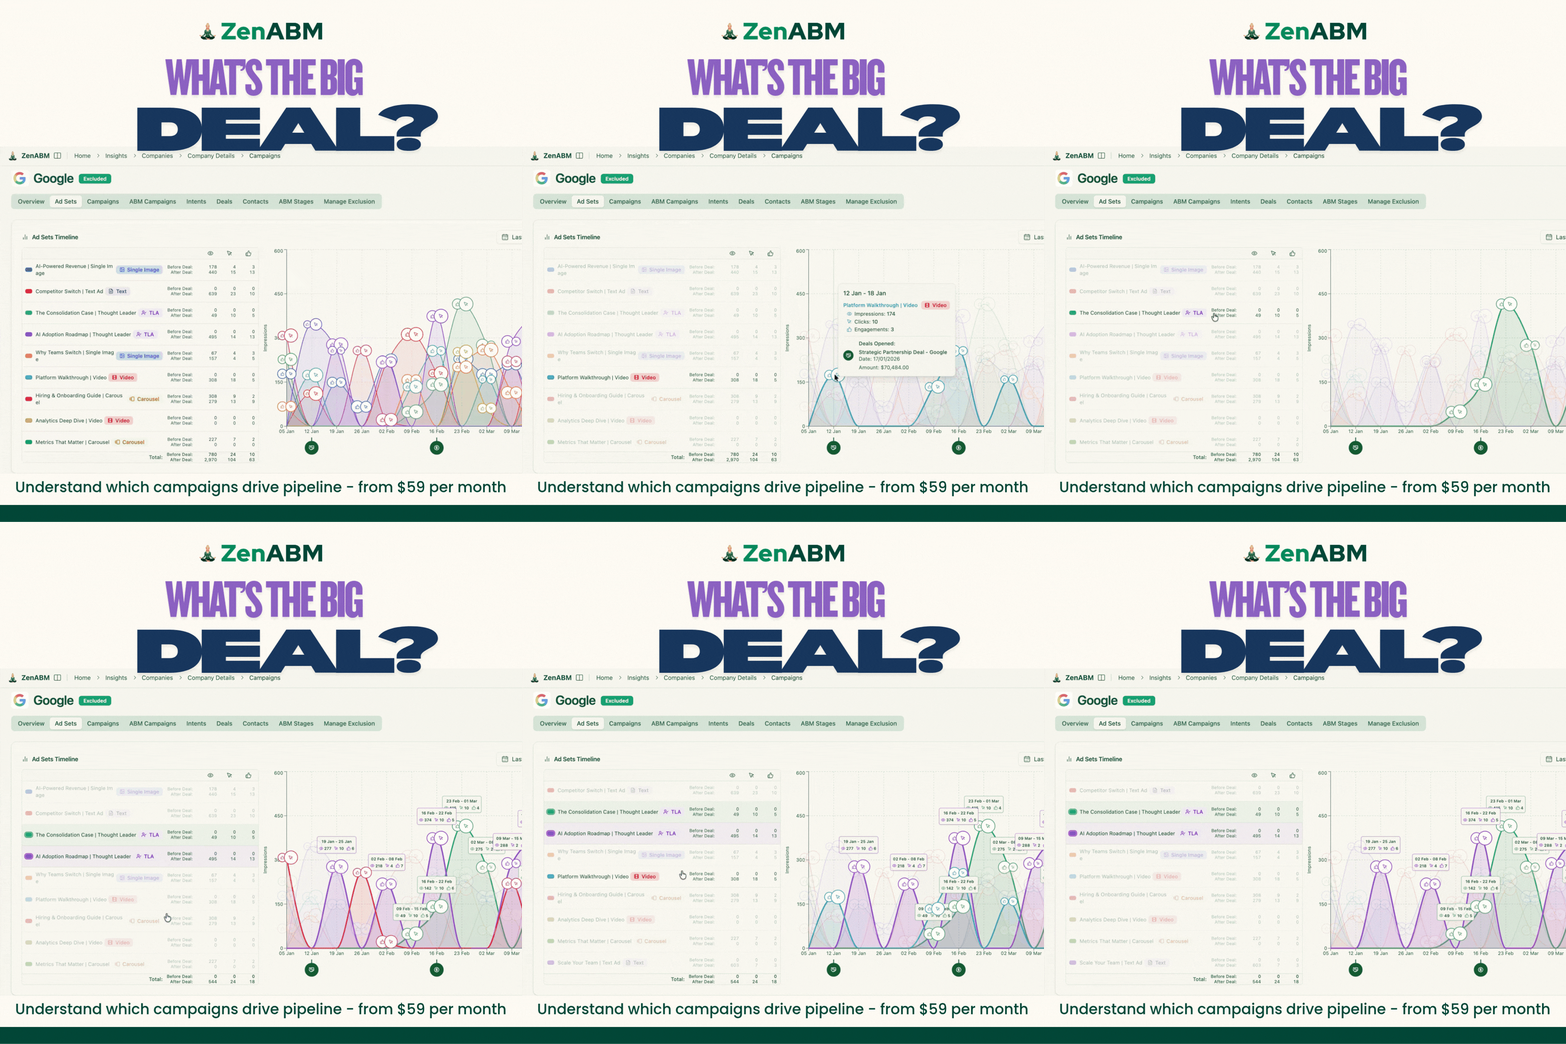
The format split is where it gets interesting. When I asked Zena which ad formats the accounts I opened deals with had engaged with most, the overwhelming majority of engagements came from Thought Leader Ads. I shared this in the Rapid Fire show with Marc Woodland. That is a share of engagements, not proof that other formats did nothing, and it is a view the Companies tab does not give you.
See which company engaged with which ad campaign with ZenABM
ZenABM is built for ABM on LinkedIn, and it matches LinkedIn impressions, clicks and engagements to the company behind them. Here is what each part does.
Per-campaign and per-format company engagement
ZenABM shows which companies viewed, engaged with (likes, comments) or clicked your ads, per campaign and campaign group, using LinkedIn's official API. It tracks ad engagement per company even when nobody from that company likes or comments. Here is the company engagement table, with each company's score, stage and intents on one row:

Engagement score and account stages
ZenABM scores every account from its ad engagement and CRM data, and moves it through the ABM stages you define, with thresholds you can set by company size. A 3-person company needs far fewer impressions than a 200-person one to mean the same thing. For how to build that model, see how to use LinkedIn ad analytics for account scoring. Here is the engagement score:

Staging tells you what to do next, for example how to move accounts from Aware to Considering. And here are the ABM stages you define:

Intent signals
Tag a campaign with a theme, and ZenABM attributes that theme to every account that engages, as an intent signal. These are the intent signals for ABM on LinkedIn worth tagging. Here is the intent property set up for syncing to the CRM:

CRM sync
ZenABM writes engagement, scores, stages and intent onto your HubSpot, Salesforce or Attio company records and creates the properties for you, so there are no CSV imports. Here is LinkedIn ad data pushed to company lists in HubSpot:

Sales then sees the accounts and their stages in the CRM. Here is the HubSpot companies table with ZenABM's LinkedIn campaign data:

Pipeline and deals
ZenABM's deal attribution shows the ad touchpoints behind every deal, before it opened and before it closed, so you can see whether your ads accelerated it. Here is how deals in HubSpot match to the companies that engaged with your ads:

Dashboards
Each ABM motion also gets its own dashboard with spend, ROAS and influenced pipeline, so you can compare motions instead of judging one blended average. If you have not split your accounts by motion yet, start with ABM strategy and segmentation.

How to see which companies engaged with your ads: a weekly checklist
Once you can see the companies, you need to do something with them. Start with how to identify high-intent accounts from LinkedIn ads. This is the weekly routine I'd run:
- Check reached accounts against your target list, and sort by paid impressions.
- Spot impression hogs and exclude them. Miles Beard excludes companies with 500+ impressions at the top-of-funnel layer, so delivery spreads to the rest of the list.
- Send high-CTR companies with no open deal to sales.
- Review companies that moved up a stage or went quiet.
- Exclude non-ICP companies that slipped in through retargeting.
- Match engaged companies to CRM deals before you judge a campaign.
For handing companies to sales, here is one practitioner's number. In our webinar Paid social is outbound's intent layer, Val Dimitrov uses 700 impressions and 10 engagements as the KPI that makes a company worth a sales follow-up. Set your own from your baseline.

If your checklist ends with warm outbound, our ABM Clay templates are ready-to-use workflows in Clay. They push engaged companies from ZenABM into outbound and sequence them by intent signal.
How ZenABM helps with seeing which companies engaged with your LinkedIn ads
Each step of the topic maps to a ZenABM capability:
- See which companies engaged: Company engagements shows every company engaging with your ads, with score, stage and CRM data on one row.
- See the journey by campaign and format: the company timeline shows impressions, clicks and engagements per ad set and campaign, and Zena can break one company down by ad format.
- Know who is warm: account stages and the engagement score move each account through the stages you define, using ad engagement and CRM data.
- Know what they care about: intent signals turn engagement with themed ads into per-account intent.
- Get it to sales: CRM sync writes it to HubSpot, Salesforce or Attio, and webhooks push engaged accounts to Clay.
- Prove it: deal attribution and the ABM campaign dashboards show the touchpoints behind each deal.
- Ask in plain language: Zena, ZenABM's AI agent, answers which companies engaged most with a format or campaign. Here it is listing the top companies by clicks:

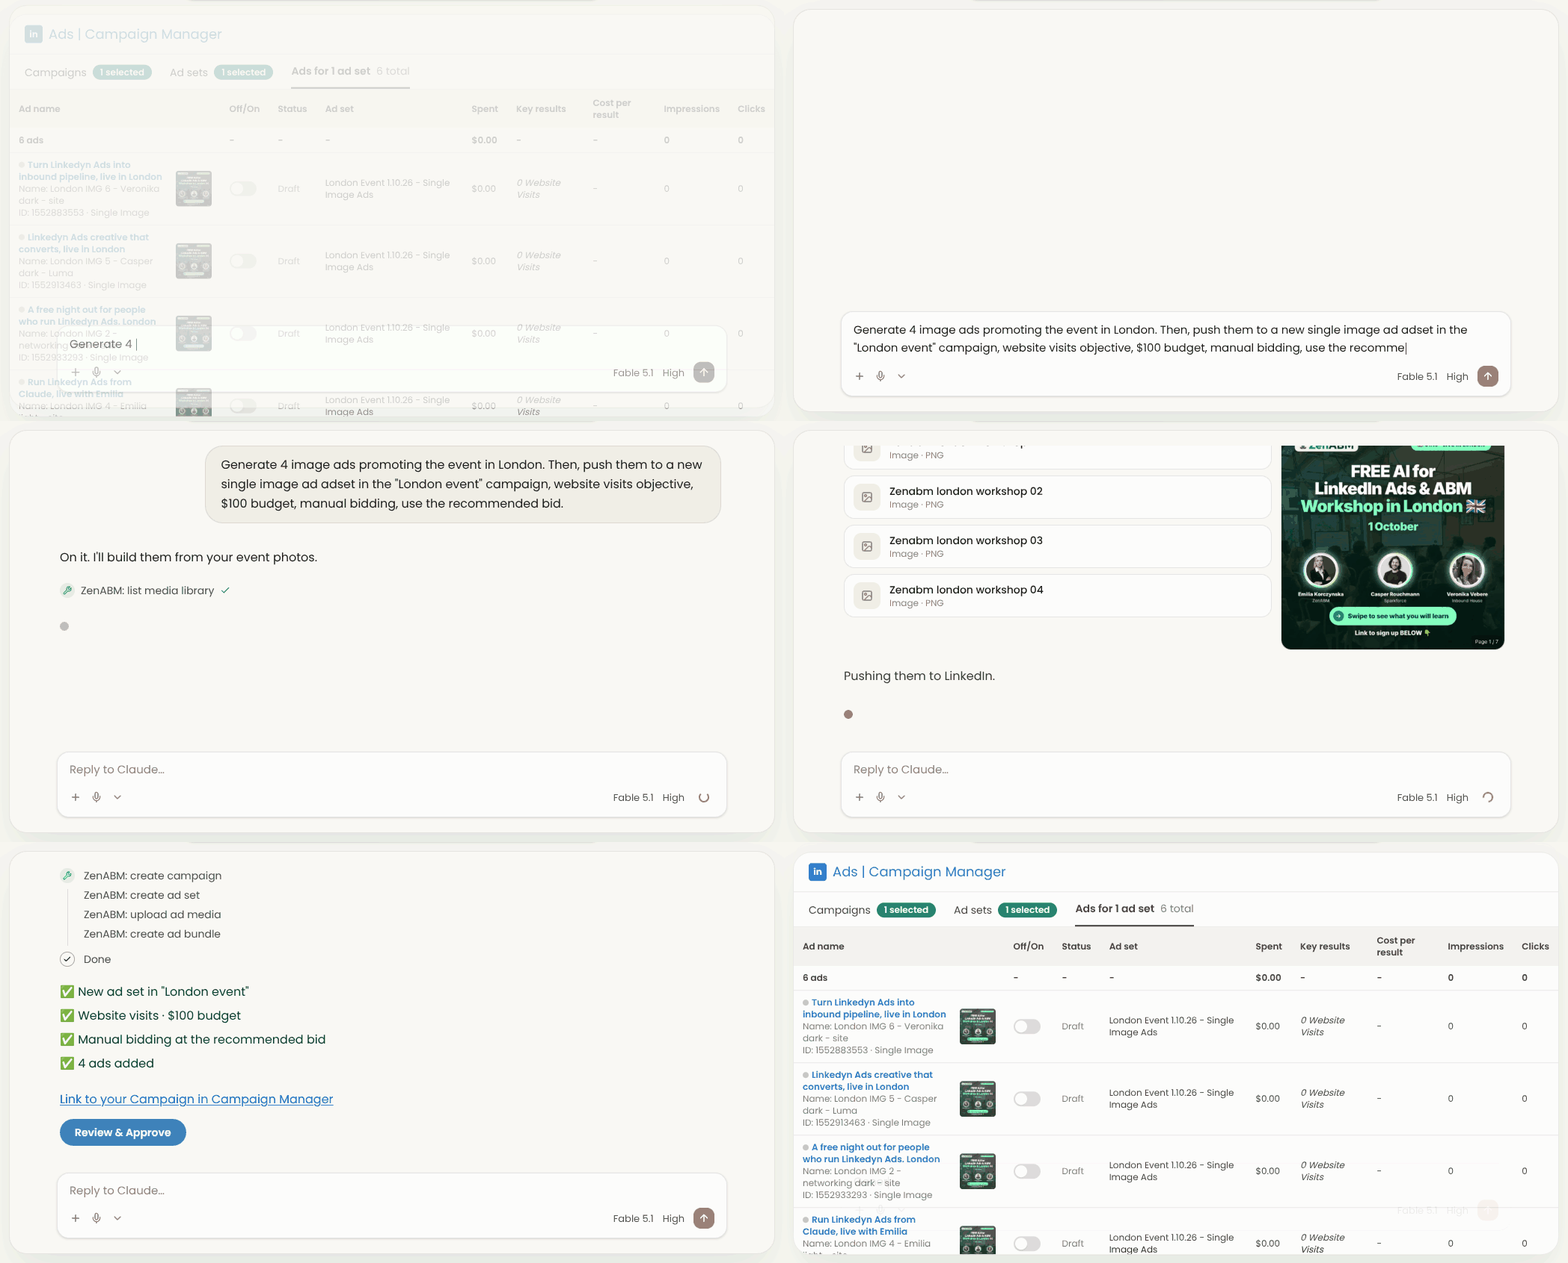
- Create and manage the campaigns: the MCP server writes as well as reads, so you can create and manage campaigns, ad sets and ads straight from Claude. Here Claude creates image ads in a new ad set through the ZenABM MCP:
- Clean up waste: Exclusions and Budget Savers apply your exclusions across all campaigns, including new ones, and keep Audience Network and Audience Expansion off.
I might be a bit biased as a co-founder, but I also know first-hand what it is like to struggle to find the right tool. When I was VP of Marketing at Userpilot, I struggled to run ABM on LinkedIn. My husband watched it up close and built ZenABM to fix it.
ZenABM pricing
Starter is $59/month billed annually, Growth is $159/month, Pro is $399/month and Agency is $479/month, all billed annually (see pricing). Here is the pricing table:

One G2 reviewer wrote: "The UI and UX are clean, intuitive, and easy to navigate." (ZenABM on G2, 5.0/5 from 6 reviews.)
What to know before you choose ZenABM
ZenABM is LinkedIn-first, so it does not buy display ads or sell third-party intent data. Reviewers also mention that ABM takes time to compound, and one wished for more CRM integrations, such as Pipedrive. The team ships new features fast, based on customer feedback.
You can start a free trial when you are ready.
Frequently asked questions
How do I see which companies engaged with my LinkedIn ads?
Go to Plan > Companies in Campaign Manager, where the Company Engagement Report now lives. It lists the companies with paid impressions, clicks, leads and organic engagement, and gives each one a journey view. It shows overall engagement per company, while ZenABM adds each company's whole journey over time, split by campaign and ad format.
Can I see who clicked on my LinkedIn ads?
No, not as individuals. LinkedIn reports companies, not people, and hides companies below a minimum engagement threshold, so even a CTO who clicked 15 times can be invisible. To infer the role, check which job titles got the impressions on an asset. ZenABM's Job title engagement shows which titles engaged most.
Can I track which companies viewed my LinkedIn ads?
Yes. The Companies tab shows paid impressions per company, plus organic impressions. ZenABM goes further by logging which companies viewed, engaged with or clicked each campaign and campaign group, using LinkedIn's official API, so you can see exactly which campaign and format each company saw.
What's the best tool for LinkedIn Ads reporting by company?
Campaign Manager's Companies tab is the native option, and it is good for a quick check of overall engagement. ZenABM is a LinkedIn-first ABM tool, and its Company engagements view shows the whole company journey by campaign and format, with score, stage, intents and CRM data on one row. G2 rates it 5.0/5 from 6 reviews.
How do I track revenue from LinkedIn campaigns?
Connect your CRM, then match the companies that engaged with your ads to deals. LinkedIn's own Revenue Attribution Report now has company-level attribution with an any-touch model, and it needs a CRM connection. ZenABM's deal attribution shows the ad touchpoints behind every deal, before it opened and before it closed. Can you answer "which campaign did this account engage with" today?
About the author