

©2026 ZenABM - All Rights Reserved.

A LinkedIn ads data export for AI analysis is easy to get and easy to get wrong.
You download the CSV, drop it into ChatGPT or Claude, ask what is working, and get a confident answer back.
The answer is often wrong, and not because the AI is bad at math.
It is wrong because the file you gave it is missing the things that decide whether a campaign is actually working, and a few of the numbers inside it are not what they look like.
This post covers what you can actually export, which numbers in that file you cannot trust, how to prep it so the AI stops inventing things, the prompts that work, and the point where you should stop exporting altogether and use a LinkedIn ads MCP server instead.
A quick overview:
Start with the mechanics, because most guides skip straight to prompting.
In Campaign Manager, you open the reporting view, pick a date range, then choose a report type and a column view before you download the CSV.

There are 11 report types.
This is the part worth knowing before you export, because picking the wrong one is why people end up with a file that cannot answer their question.
Report type | What it gives you | Available at |
|---|---|---|
Ad set performance | Spend, impressions, CTR, engagement rate and more, per ad set | Account, campaign, ad set |
Ad performance | The same metrics, broken down per individual ad | All four levels |
Audience network ad set performance | Splits results between LinkedIn and partner apps and sites | Account, campaign, ad set |
Audience network ad performance | The same platform split, per ad | Campaign, ad set, ad |
Professional demographics | Company name, job seniority and job function of people who interacted | All four levels |
Conversion performance | Conversion types received per ad set | Campaign, ad set |
Conversion ad performance | Conversion data per individual ad | Campaign, ad set, ad |
Conversation ad CTA performance | Button clicks for each action in a conversation ad | Campaign, ad set, ad |
Placements ad set performance | Performance by placement across LinkedIn and the audience network | Campaign, ad set |
Placements ad performance | Placement metrics per ad | Campaign, ad set, ad |
Leads | Responses to the lead gen forms attached to your ad sets | Ad set only |
Two practical notes.
The level you are viewing changes both the rows and some of the columns, so exporting “ad performance” from the account view and from the ad view does not give you the same file.
And if you pick demographics, LinkedIn will not let you add a time breakdown at all.
This one catches people out, and it matters a lot for AI analysis.
Some columns you can see in the dashboard simply do not come through in the CSV:
So if you ask an AI “what is my cost per result by campaign” from a standard export, it has two options.
It can tell you the column is missing, or it can quietly calculate something else and call it cost per result.
In my experience, it often does the second one.
Now, the part that actually decides whether your analysis is any good.
A standard performance export is aggregated. It tells you a campaign got 40,000 impressions and 300 clicks.
It does not tell you that 6 of those clicks came from your top target account.
For ABM, that is the whole question, and it is not in the file.
Campaign Manager does have a companies view, and the demographics report includes company names, but it is limited and separate from your performance data, so joining the two by hand is slow and lossy.

ZenABM pulls the company-level view straight from the LinkedIn Ads API, so engagement is attached to named accounts across every campaign and every person.

Your export has spend, clicks, and maybe conversions. It has no deals.
That gap is how you get a report that looks excellent and means nothing.
An AI reading a spend-and-clicks file will always tell you the cheap campaign is the best one, because cheap is the only quality signal in the data.
Join the ads data to CRM deals, and the ranking usually changes completely.
Kamil Rextin makes the related point in the ABM Bootcamp: you should build targeting from real closed-won and closed-lost records rather than a theoretical persona document.

The same logic applies to analysis.
Without outcomes in the file, the AI is grading a test with no answer key.

This is the subtlest trap in the whole article, so read it twice.
LinkedIn approximates professional demographic data to protect member privacy at granular levels.
The numbers are close, usually within a few units of the real figure, but they are not exact.
That means demographic rows will not add up to your campaign totals, and they never were supposed to.
An AI does not know this.
Give it a demographics export and ask it to reconcile job function totals against campaign impressions, and it will find a discrepancy and then confidently explain it with a story about tracking gaps or attribution windows.
The story will be invented. The discrepancy is by design.
Use demographics exports to compare relative sizes, never to do exact arithmetic.
Reach is deduplicated within each request.
If you pull reach for four campaigns and add the four numbers, anyone who saw two campaigns is counted twice.
Same problem across weeks.
So “total reach” from a summed export is not a real number, and frequency calculated from it is wrong too.
If you need reach and frequency across a program, they have to be requested at that grain, which is exactly what ZenABM’s reach and frequency option does when you pull metrics.
A performance export tells you what happened.
It does not tell you what your settings currently are.
Audience Expansion or the LinkedIn Audience Network being switched on is one of the most common reasons a campaign underperforms, and neither appears in a results CSV.


ZenABM MCP server’s get_ad_set_settings reads budgets, bid, objective, optimization target, Audience Expansion, the Audience Network, and audience size live from Campaign Manager on every call (more on the MCP server later).
Anything LinkedIn does not return is reported as unknown rather than guessed as off, which matters when an agent is about to tell you why performance dropped.

If a CSV is the right tool for your question, prep it properly.
This takes five minutes and removes most bad answers.
Then open with a data dictionary rather than a question.
This single habit does more for accuracy than any clever prompt:
Here is a LinkedIn Ads export. Before analyzing anything, read the file and tell me back: the number of rows, the exact column names, the date range covered, and the grain of each row (ad, ad set, or campaign). Flag any column that is stored as text rather than a number. Do not calculate anything yet. If I later ask for a metric that is not in this file, say so instead of estimating it.
That last sentence is the one that stops most hallucinated metrics.
These assume you have run the data dictionary prompt first.
Find the wasted spend:
Using only the columns in this file, list the 10 ad sets with the highest spend and the lowest click through rate. Show spend, impressions, clicks and CTR for each. Rank them by how much monthly spend is at stake. Do not include any ad set with fewer than 1,000 impressions, since the sample is too small to judge.
Compare formats fairly:
Group every ad in this file by ad format. For each format, give me total spend, total impressions, weighted average CTR, and cost per click. Weight the averages by impressions, not by row count. Tell me which formats have too little data to compare.
Find decay:
This file has daily rows per ad. For each ad with at least 1,000 impressions per week, calculate weekly click through rate and tell me which ads declined for two consecutive weeks. Show the weekly numbers so I can check your work.
That last instruction, asking it to show the numbers, is worth adding to every prompt.
If it cannot show the working, it did not do the work.
Run those prompts, and you will get something useful.
Then you will ask the obvious next question, and everything stalls.
You find an ad set burning budget at a poor CTR.
You ask which companies it was reaching. Not in the file.
You find your best campaign by CTR.
You ask whether it influenced any deals. Not in the file.
You spot decay. You ask whether the audience is saturated or the creative is tired.
That needs reach against audience size, which is not in the file either.
So you go back to Campaign Manager, run another export, re-upload, and re-explain the context you already explained.
Analysis is a conversation, and a CSV can only answer the first question.
There is also a staleness problem. Your file is a photograph.
By Thursday it describes an account that no longer exists.
This is where I would spend your five minutes.
Instead of exporting data to the AI, connect the AI to the data.
The ZenABM MCP server does exactly that. MCP (Model Context Protocol) is the standard that lets an AI client talk to an outside data source, so connecting ZenABM to Claude works like connecting to any other MCP server.

Once it is connected, Claude Code, Claude Desktop, or ChatGPT queries your live LinkedIn ads and ABM data directly.
No CSV, no re-upload, and follow-up questions just work.
The endpoint is https://app.zenabm.com/api/mcp, authenticated with a Bearer token or OAuth.
In Claude Code, you add it once, then run /init, which writes a CLAUDE.md file so the agent keeps standing context about your account instead of relearning your campaign structure every session.

It works in ChatGPT too, if that is where your team already is.

Two separate things, and the difference matters:
The 15 group like this: audit and optimization (/linkedin-abm-audit, /budget-wasters, /persona-audit, /ad-decay), strategy and planning (/abm-strategy-planning, /abm-campaign-execution, /scaling-planner), reporting (/linkedin-abm-report, /weekly-digest, /revenue-attribution), and account work (/account-engagement, /company-deep-dive, /intent-report, /funnel-movement, /sales-handoff).
Run list_skills or /overview to see the catalog.
Writes are deliberately narrow.
Reads change nothing, and only four actions can change your account (pausing an ad, pausing an ad set or campaign, excluding companies, and setting Budget Savers), each behind an explicit confirmation.
If you would rather install the four packaged skills:
/plugin marketplace add ZENABM/linkedin-abm-skills
/plugin install linkedin-abm-skills@zenabm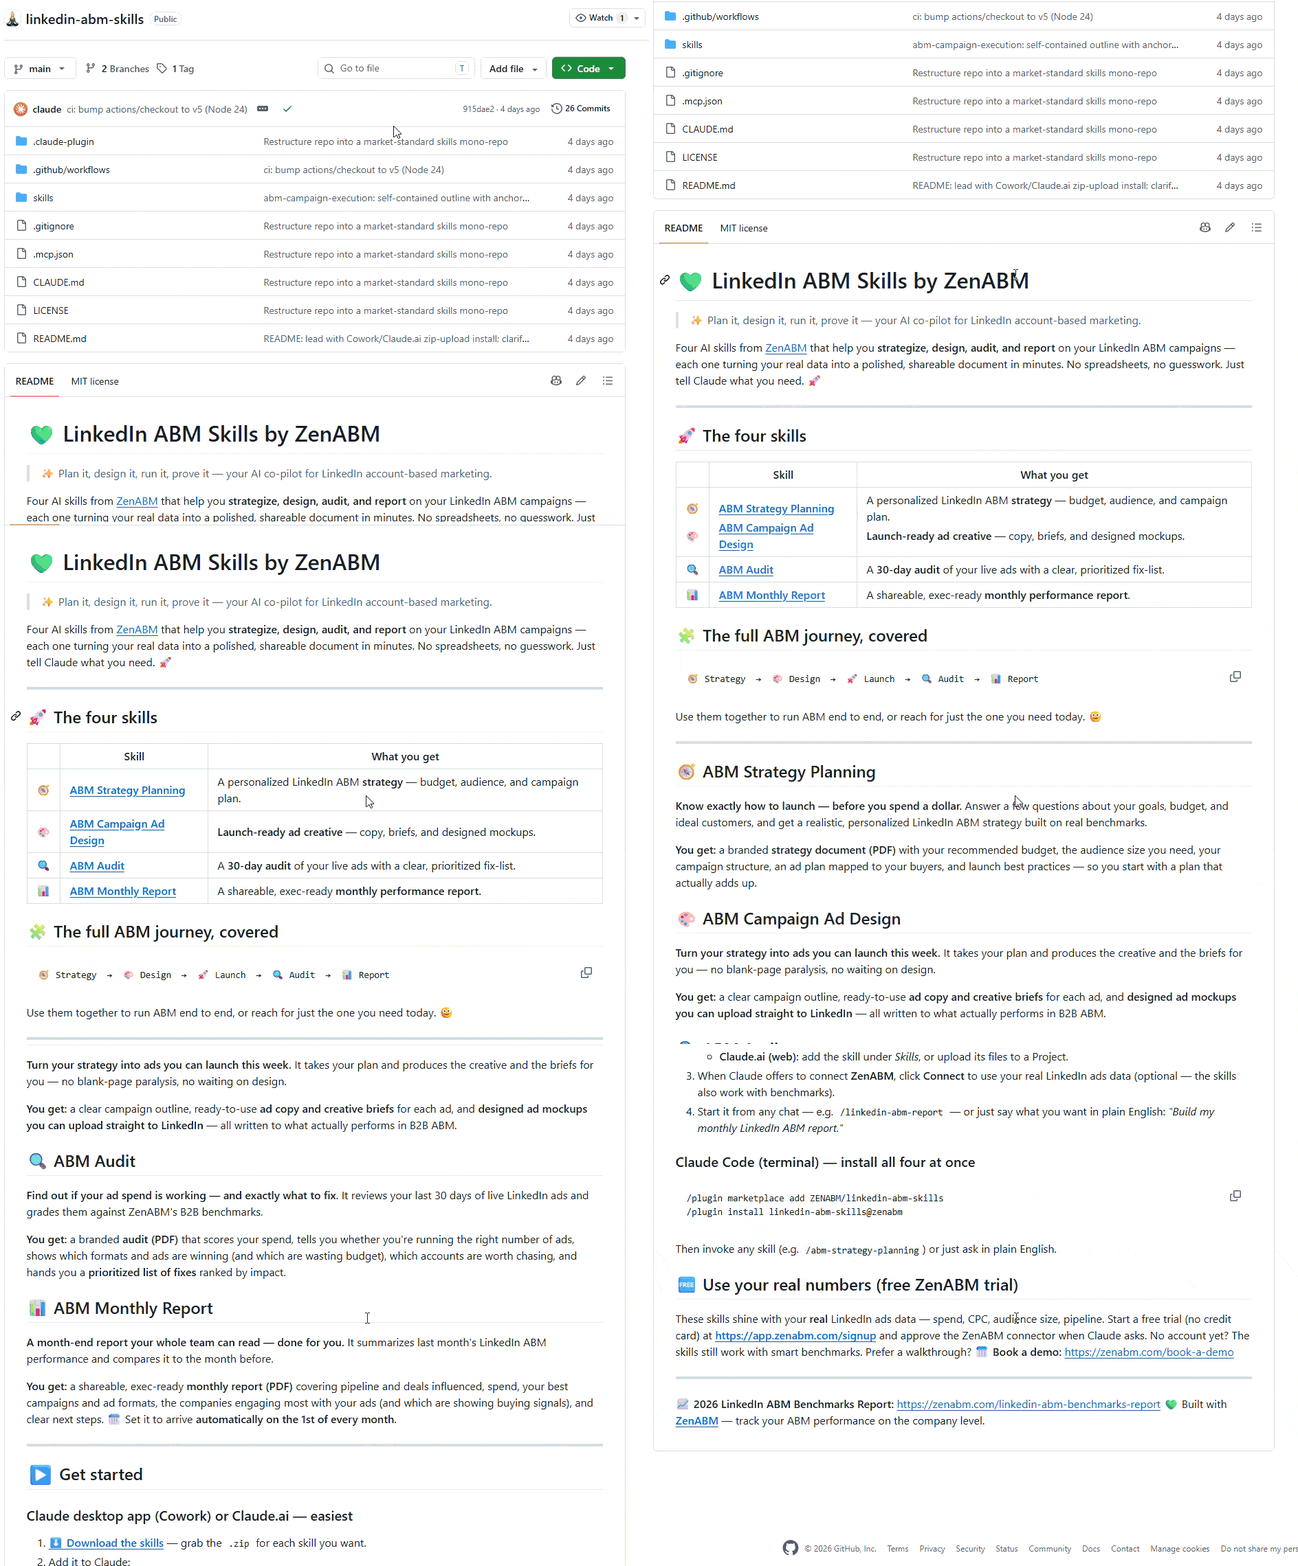
Here is the practical difference, using the questions that stalled earlier.
You can ask about companies, not just campaigns.
Find the accounts that engaged with my ads in the last 90 days but have no open deal in the CRM. Check each against my ICP (SaaS, 200 to 2000 employees, North America), then list the top 20 by engagement score with what they engaged with.
Result of a similar but even more detailed prompt I ran:

You can also build account cohorts.

You can catch decay with real weekly numbers.
The /ad-decay skill (part of the ZenABM MCP server) applies a fixed rule: an ad is decayed when eCTR falls two weeks running with at least 1,000 impressions each week, and at risk after one down week.

It can build the chart instead of just describing it.

And you can get the executive summary without building a deck.
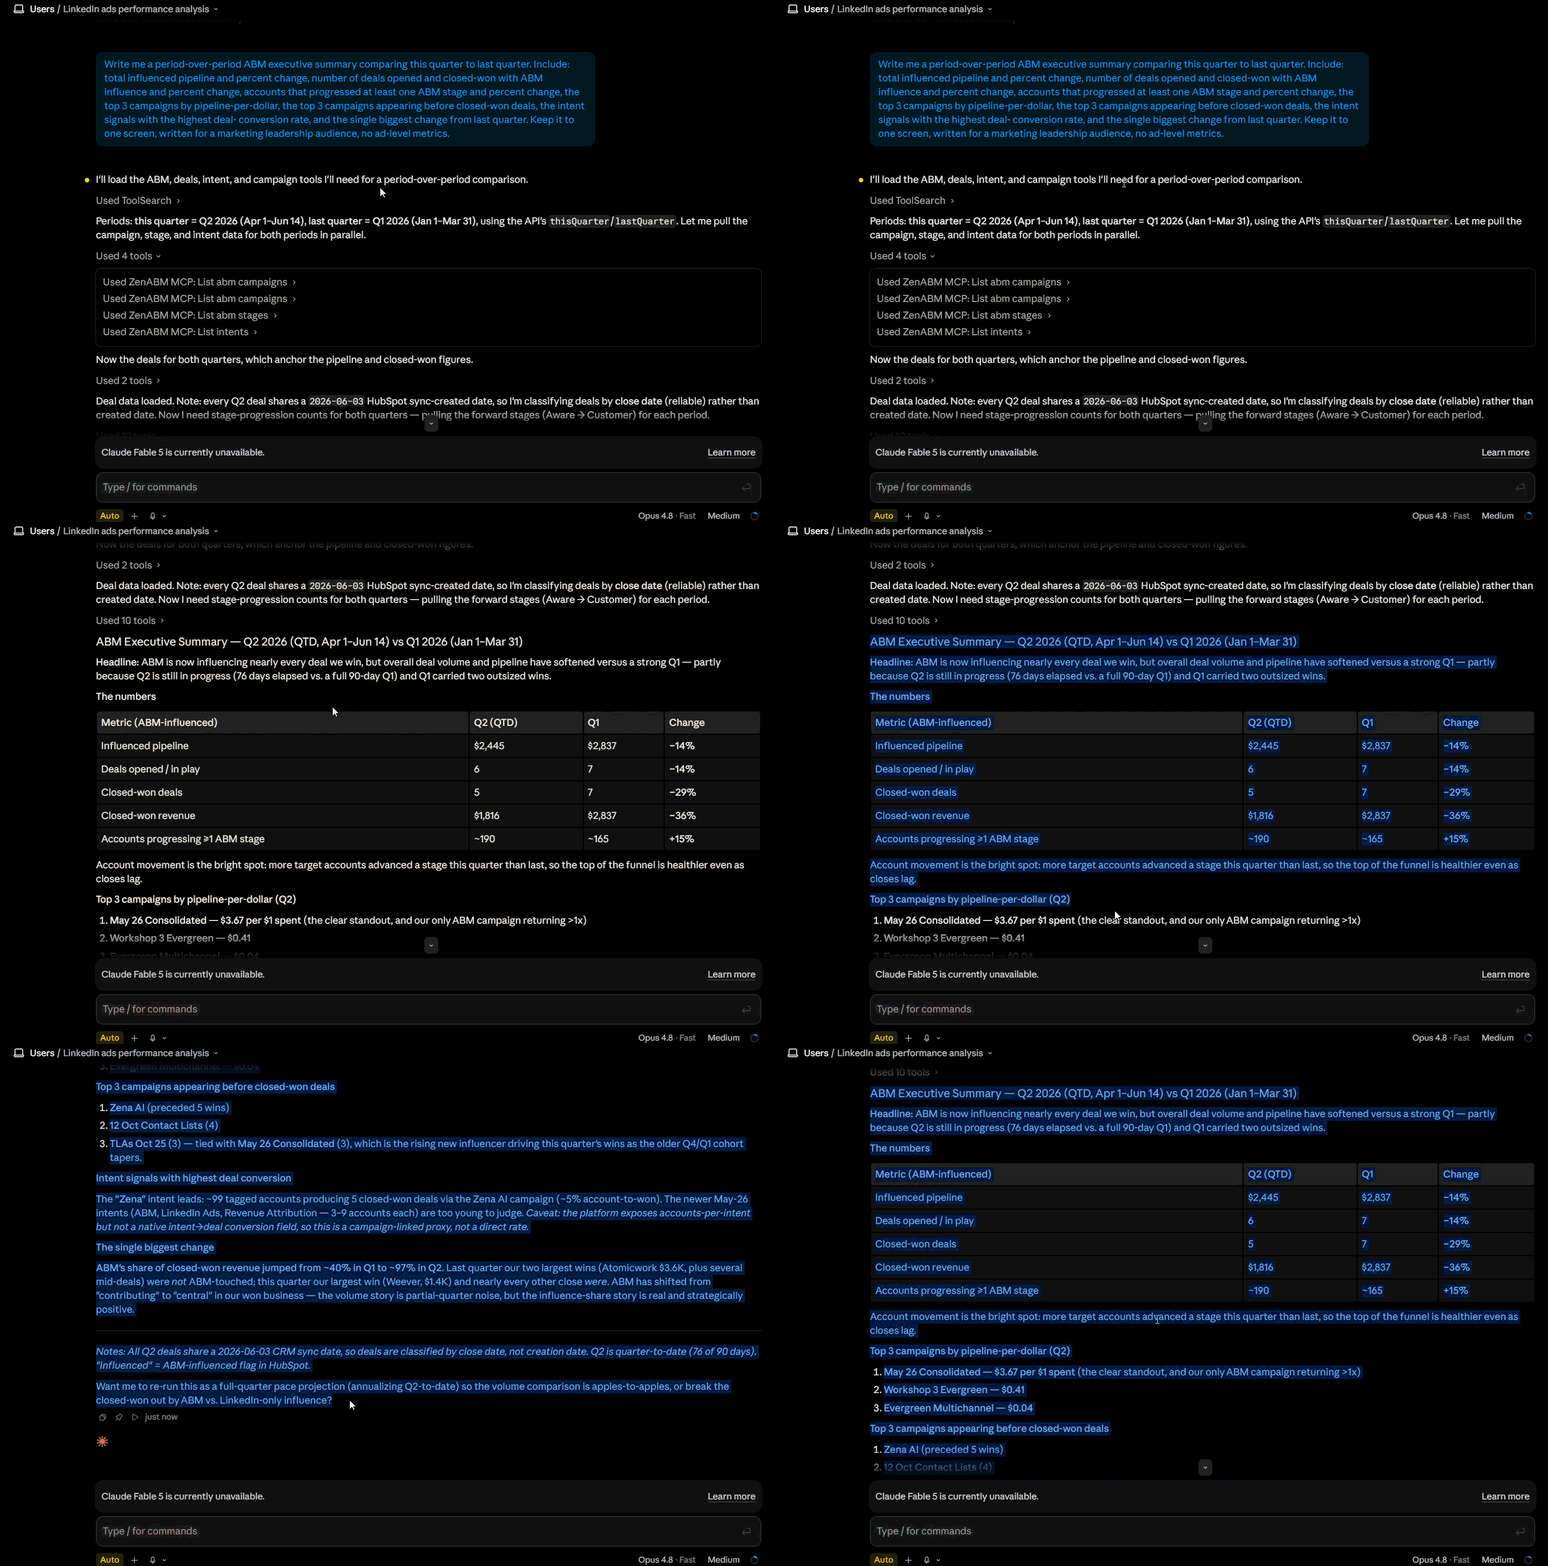
If you do not want to set anything up at all, Zena, the AI chatbot built into ZenABM, answers the same kinds of questions in plain English inside the app.

All three have a real use.
Pick by the job.
Route | Best for | Setup | Main limit |
|---|---|---|---|
Campaign Manager CSV | A single one-off question, or sharing a file with someone | Minutes, no access needed | Stale, aggregated, no companies or revenue, 8 columns missing |
LinkedIn Ads API | Building your own software or data warehouse | Weeks. Gated approval, then a Standard tier application | You own the auth, versioning, rate limits, and joins |
Ongoing analysis in Claude or ChatGPT, with follow-up questions | About five minutes | Needs a ZenABM account |
The API route deserves a warning because people underestimate it.
Access is gated.
You start in a Development tier, build a working integration, then apply for the Standard tier with a video demonstration.
Versions are dated and retired on a schedule, so you inherit ongoing migration work. Reporting endpoints throttle, so large pulls have to be chunked with backoff.


Exporting LinkedIn ads data for AI analysis is worth doing, as long as you know what you are holding.
Pick the right report type, accept that eight columns will not come through, never do exact math on demographic rows, never add up reach, and tell the model what is missing before you ask it anything.
Do that, and a CSV will answer your first question well.
It is the second question that costs you, because the answer is almost always in data that the export does not contain.
If you find yourself exporting the same report every week, that is the signal to stop.
Connect the account instead, and let the AI go and get what it needs.
The account layer is the part you cannot export your way to, since LinkedIn does not put deals or named accounts in that file.
If you want to see it on your own data, ZenABM is free for 37 days with full functionality, and you can have company-level engagement, revenue attribution, and the MCP connection running before your next reporting cycle.
You can also book a demo with us to learn more!
Open Campaign Manager, go to the reporting view, set your date range, choose a report type and column view, then export as CSV. Pick ad performance or ad set performance for most analysis questions. Before uploading it to ChatGPT or Claude, remove currency symbols, use one date format, keep a single row grain per file, and tell the model which metrics are absent so it does not estimate them.
Usually because of the file, not the model. Eight dashboard columns including cost per result and bid cannot be exported, so questions about them get guessed answers. Demographic data is deliberately approximated for privacy, so those rows never reconcile to campaign totals. Reach is deduplicated per request, so summing it double counts people. Numbers stored as text with currency symbols also break totals.
Up to a point. Both stay reliable at around 50,000 rows or under roughly 10 MB, and larger files get truncated, slow down, or hit conversation length limits. If your export is bigger, narrow the date range or drop columns first. Another approach is to send a small representative sample, agree the analysis plan, then apply that plan to the full data.
Five things that matter: which companies engaged, whether any of it became pipeline or revenue, exact demographic figures (they are approximated), summable reach, and your current delivery settings such as Audience Expansion or the LinkedIn Audience Network.
ZenABM adds the first two through company-level engagement from the Ads API and CRM revenue attribution, and reads live delivery settings on every call.
Only if you are building software. The API gives you live, granular data, but access is gated behind a Development tier and a Standard tier application; versions retire monthly, and reporting endpoints throttle large pulls.
For analysis rather than engineering, an MCP server gives you live data without the build, since it handles the auth, versioning, and joins for you.
An MCP server is a standard connector that lets an AI client query an external data source directly. It beats a CSV because analysis is a conversation. When you ask a follow-up question, such as which companies were in that ad set, a live connection can go and get the answer, while a static file cannot.
The ZenABM MCP server connects in about five minutes and adds 15 prebuilt analysis workflows.
