
LinkedIn Campaign Manager shows you that 1,247 people clicked your ad last month. What it does not show you is that 23 of those clicks came from companies on your target account list, 8 of those companies are now in active buying conversations, and 3 of them have open deals worth $180k in total pipeline.
That gap between “clicks” and “pipeline” is where most LinkedIn ads analytics falls apart. The analytics that matter for B2B are not campaign-level metrics. They are company-level engagement signals that tell you which accounts are progressing toward a purchase.
This post covers what LinkedIn ads analytics should look like for B2B teams, why the default tools fail, and how to build an analytics stack that actually connects ad engagement to revenue.
Let me be fair to Campaign Manager. It does a decent job at what it was designed for: managing ad campaigns and showing basic performance data.

Here is what you get out of the box:
For someone running awareness campaigns or lead gen with gated content, this is workable. The problem shows up when you try to answer B2B-specific questions.
These are the questions I get asked in every pipeline review meeting:


Campaign Manager cannot answer a single one of these. And these are not edge-case questions. They are the core analytics that every B2B marketer running ABM on LinkedIn needs to answer.
ZenABM provides answers to all of the above 😎

I think about LinkedIn ads analytics in three levels. Most teams never get past level one. The ones that do are the ones that can prove ROI and scale their budgets.
This is what Campaign Manager gives you. Performance metrics at the campaign level.
| Metric | Benchmark (ZenABM data, 211 companies) |
|---|---|
| TLA CTR | 2.68% median |
| Single Image CTR | 0.42% median |
| Video CTR | 0.24% median |
| Carousel CTR | 0.32% median |
| TLA CPC | $2.29 median |
| Single Image CPC | $13.23 median |
These numbers come from the 2026 LinkedIn ABM Performance Benchmarks Report. They are useful for benchmarking, but they do not tell you anything about business impact.
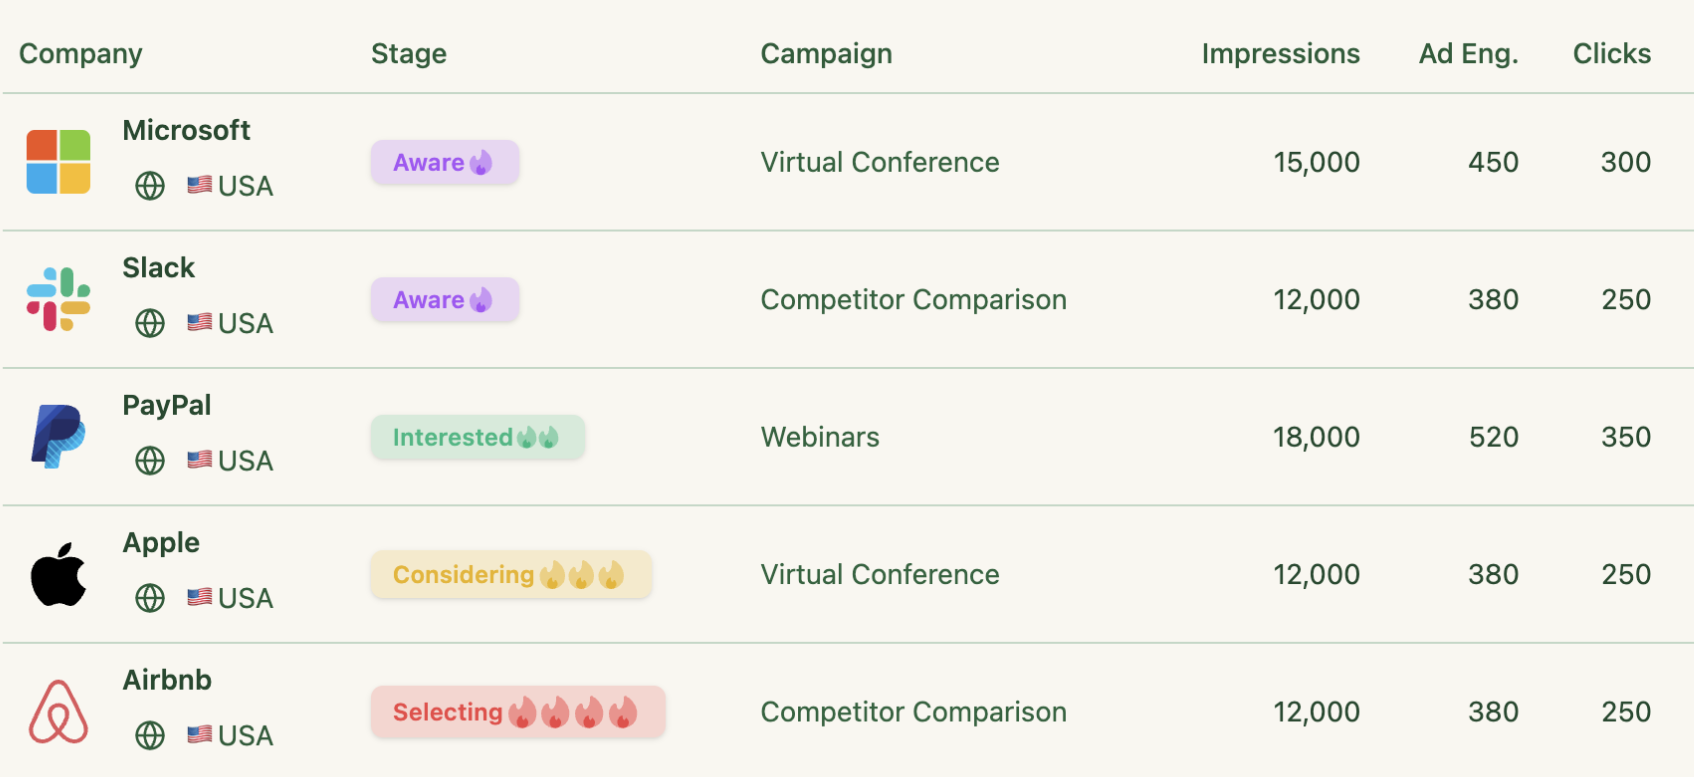
This is where most LinkedIn ads analytics stacks break down. Account-level analytics answers: which companies are engaging, and how deeply?
The metrics that matter at this level:
This is the data that makes ABM work. Without it, you are running ads blindfolded – you can see aggregate performance, but you have no idea if the right accounts are responding.
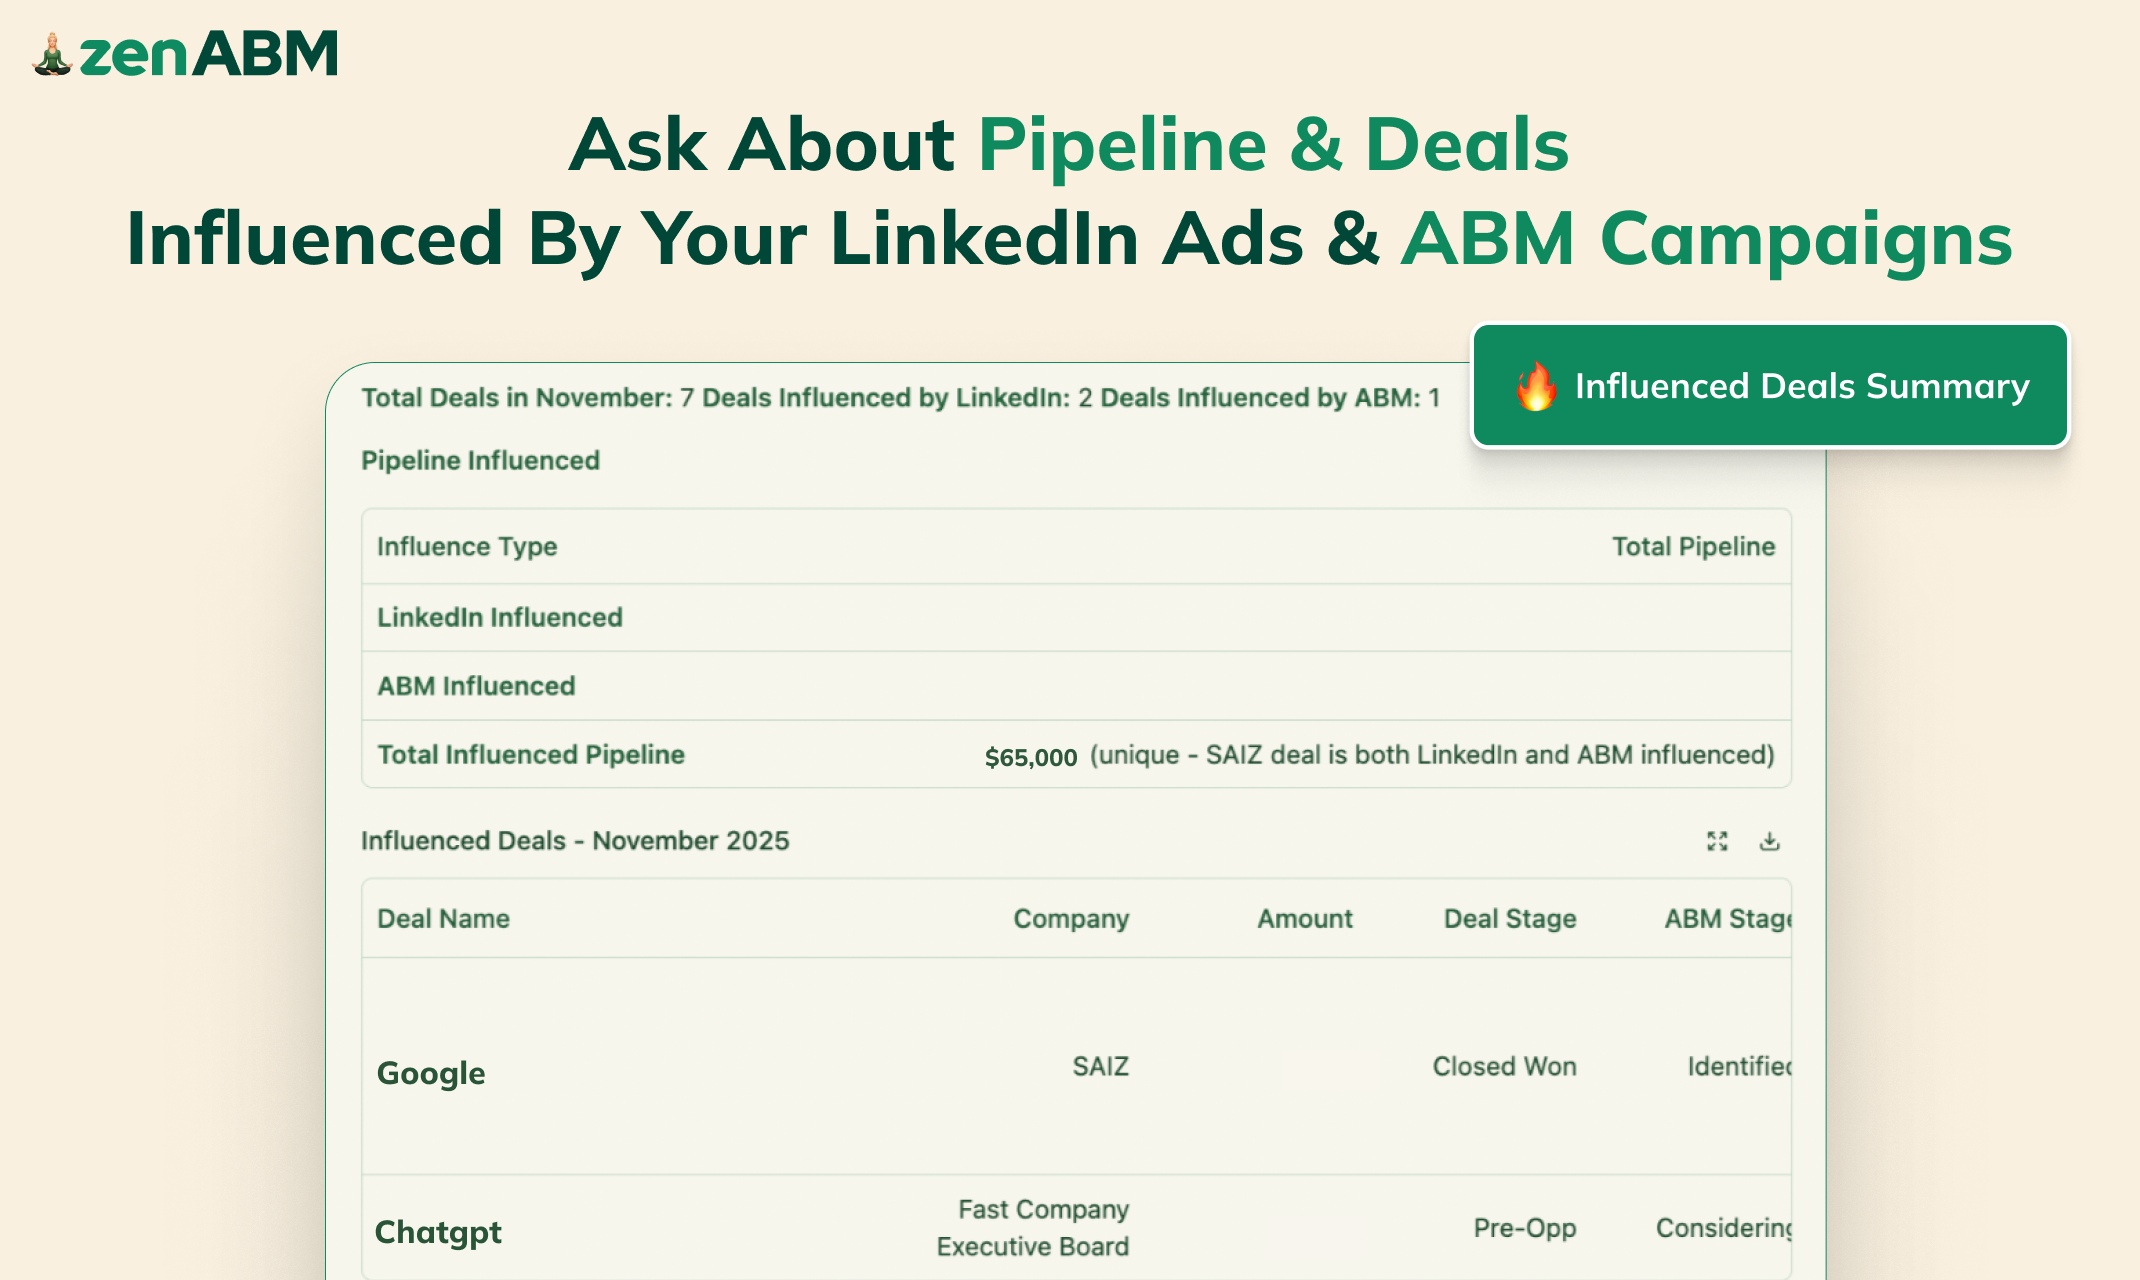
This is where LinkedIn ads analytics becomes a strategic asset instead of a reporting obligation. Revenue analytics connects your ad engagement data to your CRM pipeline.
The metrics:
This level requires two things: influence-based attribution (not click-based last-touch) and a CRM integration that connects LinkedIn ad data to deal records.

The default attribution model in most LinkedIn ads analytics setups is click-based last-touch. This model assigns 100% of conversion credit to the last ad a person clicked before taking action.
For B2B, this model is fundamentally broken. Here is why.
B2B buying committees have 6-10 people. Any one of them might see your ad, but only one needs to click and convert. Click-based attribution gives credit to the one person who clicked while ignoring the 5-9 others who were influenced by impressions.
The buying journey is months long. Our data shows the average time from first ad impression to deal creation is 60-90 days for mid-market and 90-180 days for enterprise. Last-touch attribution only sees the end of that journey.
Awareness formats get penalized. Thought Leader Ads have the highest CTR (2.68%) and lowest CPC ($2.29). But because they are typically used for awareness – not direct response – they rarely appear as the “last click.” Under click-based attribution, your best-performing format looks like it generates zero pipeline.
Influence-based attribution fixes this by crediting every touchpoint an account experienced before a deal was created. If any person from a company engaged with any of your LinkedIn ads before a deal was opened, those campaigns get influence credit.
When I switched to influence-based attribution, our reported pipeline influence from LinkedIn ads increased by over 3x. The campaigns were always working. The analytics model was just ignoring most of the impact.
Here is the analytics stack I recommend for B2B teams running LinkedIn ads. You do not need all of these – but you need more than just Campaign Manager.
Use it for what it is good at: campaign management, A/B testing, audience configuration, and basic performance monitoring. Pull your weekly campaign health metrics from here.
You need something that pulls company-level engagement data from LinkedIn’s API and maps it against your target account list. This is what tells you which accounts are engaging and at what rate.
ZenABM does this automatically. It connects to LinkedIn’s official API, captures company-level engagement data for all campaigns, and maps it against your target account list. You can see which companies saw your ads, which ones clicked, and their engagement trend over time.
Your LinkedIn ad engagement data needs to live in your CRM. Sales needs to see which companies are engaging with ads. Marketing needs to see which engaged companies turned into pipeline. This requires a tool that pushes LinkedIn engagement data into your CRM and pulls deal data back.
ZenABM syncs bidirectionally with HubSpot (and Salesforce on higher tiers). Engagement scores, ABM stages, and ad exposure data all flow into company records automatically.
As your data grows, you need a way to surface insights without manually building every report. ZenABM includes Zena AI, an AI chatbot that can answer questions like “Which campaigns had the highest pipeline influence last quarter?” or “Which job titles are engaging most with our TLAs?”
Different ad formats serve different purposes in your funnel. Your analytics should reflect that.
| Ad Format | Primary Purpose | Key Metrics to Track | What “Good” Looks Like |
|---|---|---|---|
| Thought Leader Ads | Awareness and trust | CTR, engagement rate, reach among target accounts | 2%+ CTR, 30%+ TAL reach/month |
| Single Image Ads | Mid-funnel education | CTR, CPC, landing page conversion rate | 0.4%+ CTR, LP conversion 3-5% |
| Video Ads | Awareness and education | View rate, 50% completion, dwell time | 30%+ view rate, 15%+ at 50% completion |
| Carousel Ads | Story-based education | CTR, swipe-through rate, card-level engagement | 0.3%+ CTR, 3+ cards viewed average |
| Text Ads | Website visitor deanonymization | CPM, companies identified on website | $2 CPM, identifies which target accounts visit your site |
| Document Ads | Lead gen and education | Open rate, download rate, pages viewed | 3%+ download rate |
The mistake most teams make: measuring all formats against the same KPI (usually CTR or CPC). A video ad with a 0.24% CTR is not “underperforming” compared to a TLA at 2.68%. They serve different purposes. Your LinkedIn ads analytics should evaluate each format against its own purpose and benchmarks.
At minimum, you need LinkedIn Campaign Manager for campaign management and a company-level analytics tool like ZenABM or Factors.ai for account engagement tracking and pipeline attribution. Optionally, add a BI tool for custom dashboards. The critical piece most teams are missing is the company-level layer that connects ad engagement to specific target accounts.
Campaign Manager shows a limited “top 25 companies” list. For full company-level analytics across all your target accounts, you need a tool that connects to LinkedIn’s official API. ZenABM provides this – it shows every company that saw, clicked, or engaged with your ads, mapped against your target account list.
Click-based analytics counts conversions that happened after someone clicked an ad. Influence-based analytics credits every ad touchpoint an account experienced before a deal was created, regardless of whether they clicked. For B2B, influence-based is far more accurate because buying decisions involve multiple people and months of touchpoints.
Focus on business impact: target accounts reached, accounts engaged, pipeline influenced, pipeline per dollar spent, and ROAS. Save campaign health metrics (CTR, CPC, frequency) for your marketing team reviews. Leadership wants to know one thing: is this investment creating pipeline and revenue?