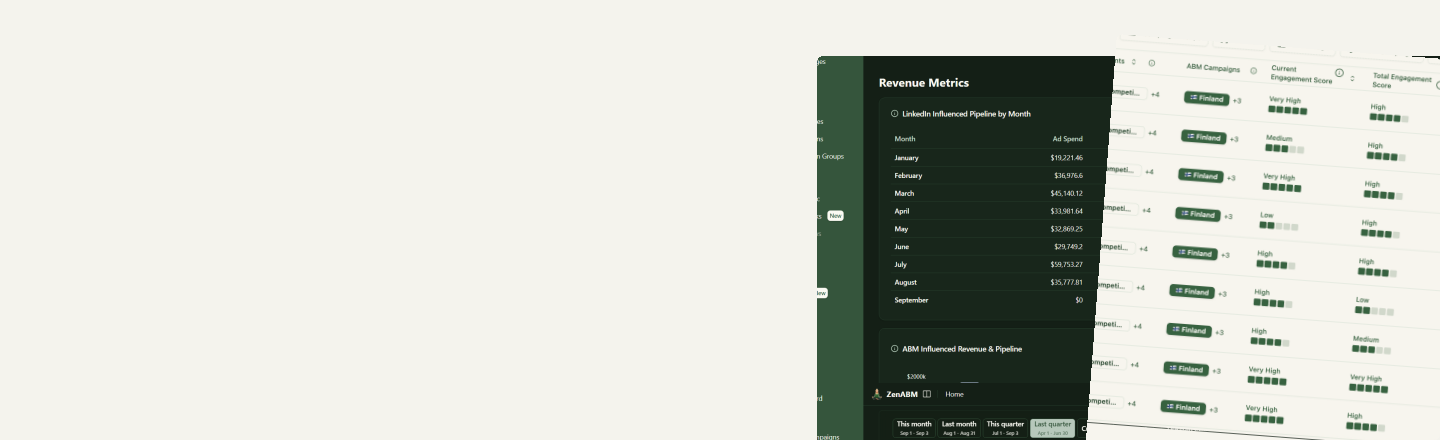
Every ABM and LinkedIn Ads number in one place
Ad spend next to influenced pipeline, closed revenue, ROAS and pipeline per dollar. Pick a period, pick a context, and every number on the screen follows. Then click any figure to see the accounts behind it.
The overview
Your executive summary, in one scroll
The home screen answers the questions you get asked, before you get asked them.
Spend and efficiency
Ad spend, influenced pipeline, closed revenue, ROAS and pipeline per dollar, all on the same screen so cost and return never live in separate tabs.
Any period, with a comparison
This month, last month, this quarter, last quarter, year to date or a custom range. Turn on compare and every metric gains a change against the previous period.
Scoped to the right context
Read everything LinkedIn influenced, every ABM campaign together, or a single motion on its own. The whole dashboard re-reads against the context you pick.
Funnel and campaign effectiveness
A breakdown of how accounts sit across your funnel, and which campaigns are actually moving them, rather than just collecting impressions.
Per motion
A dashboard per ABM campaign, not one blended average
Group LinkedIn campaigns into the motions you actually run, then read each one on its own: pipeline, ROAS, stage movement and the accounts inside it. The ABM campaign analytics dashboards page covers this in full.
- Compare two motions against each other instead of guessing which carried the quarter.
- Scope each campaign to its own date range, so a pilot is not judged on the year.
- Set a target account count and watch coverage and progression against it over time.
The deal dashboard
The touchpoints behind every deal
Open a deal and see what actually touched the account on its way there: LinkedIn Ads, Google Ads, Reddit Ads, AI referrals and organic visits, on one timeline with the people involved.
- Influenced pipeline and closed revenue, separated from deals your ads never reached.
- The campaigns and ad formats that appear most often before a deal is created, so you know what to fund next.
- Every account page carries the same view, ready to open before a sales call. See company journeys.
Drill down
Insights pages behind every headline number
A dashboard figure is only useful if you can reach the rows that made it. Every one of these is a click away.
Companies
Every account engaging with your ads, with engagement score, ABM stage, intents and CRM data alongside.
Job titles
Which roles your spend reaches and which ones engage, so you can confirm the ads land on the buying committee.
Campaigns and ad sets
Performance at every level of the LinkedIn hierarchy, including the format mix and the creative inside each ad set.
Sources
Multi-touch attribution across every channel that touched the account, not just the last click before the form.