

©2026 ZenABM - All Rights Reserved.

A LinkedIn ads account engagement score sounds simple.
Add up what each company did with your ads, rank the list, and call the top of it.
We built ours that way first, and it ranked large companies at the top for a while.
Not companies that liked us.
Just the big ones.
The reason is mechanical.
A 6,000-person company has more people in your target job titles, so it generates more impressions and more clicks than a perfect-fit 200-person company that is genuinely interested.
A raw count scores headcount.
The second flaw is that most scores only go up.
They are cumulative, so an account that was curious in March still looks hot in September.
This guide fixes both.
You get the five steps to build the score, the exact formulas, the decay curve, the thresholds that trigger action, and the backtest that tells you whether your weights are right.
A quick overview:
Before the build, understand what you are correcting for.
Almost every homemade score has one or both of these.
LinkedIn delivers ads to people, not companies.
So a company with 40 people matching your job titles gets far more impressions than one with 4, at the same bid, without wanting your product any more.
Add those impressions and clicks into a score, and the biggest names float to the top every time.
I have watched a sales team lose faith in a scoring model in about three weeks because of this.
They called the top accounts, found nobody had heard of us, and stopped opening the list.
If your score is a running total, it cannot fall.
An account that engaged heavily six months ago outranks one that engaged four times last week.
That is backwards.
Recent behavior is the whole point of an engagement score, because it is the part that tells you to act now.
ZenABM gives you exactly that.
ZenABM pulls company-level LinkedIn ad engagement data for each ad campaign and campaign group from the LinkedIn ads API, and then calculates both a total engagement score and a current engagement score for each account.


Only score things that are yours and that you can trace to a named company.
Guessing accounts from a third-party feed puts noise straight into the model.
Weight each signal by how much effort it took the buyer.
An impression costs them nothing.
Downloading a document costs them a little.
Clicking through to your pricing page costs them more.
Here is the starting weight set I would use.
Treat these as a first draft, because step 5 will correct them.
Signal | Weight | Why |
|---|---|---|
Impression | 1 | Almost no effort, but it still matters. Impressions correlate with pipeline in the benchmark data, even when clicks do not. |
Social engagement (like, comment) | 2 | Cheap to give, and often from people outside your ICP. |
Landing page click | 8 | The click you actually paid for. This is the workhorse signal. |
Document download | 12 | Real effort and real interest in the topic. |
Video watched to 75 percent or more | 10 | Attention over time, which is rarer than a click. |
Lead form opened but not submitted | 10 | Interest plus hesitation. Badly underused as a signal. |
Lead form submitted | 20 | They gave you their details on purpose. |
Pricing or demo page visit | 25 | The strongest ad-adjacent signal you can collect. |
Two rules about this table.
Do not weight CTR heavily as its own factor.
In the ZenABM ABM benchmarks report of 211 companies, 161,256 ads and $5.5M in spend, CTR against pipeline generation returned a Spearman rho of minus 0.170.
Higher CTR did not mean more pipeline, so a score that chases clicks can point away from revenue.
And weigh the person, not just the action.
An engagement from a buyer in your target role is worth more than one from an intern.
ZenABM’s job title insights show which roles are actually engaging, so you can apply a multiplier for in-persona engagement.

This is the step that fixes flaw one, and it is one line of maths.
Instead of a raw total, divide by the exposure that the account received:
Engagement rate = weighted engagements divided by impressions, in your chosen window
Now, a 200-person company that engaged 6 times out of 400 impressions scores higher than a 6,000-person company that engaged 20 times out of 9,000 impressions.
Which is correct, because the small company is far more interested.
This is exactly what ZenABM’s current engagement score is calculated like this: engagements over impressions in the window you select.
So if you are using ZenABM, the normalization is already done.
A rate alone still cannot tell one enthusiastic person from a committee.
The average B2B buying committee is 11 people, as per Gartner, so an account with four distinct people engaged is in a genuinely different state from an account with one person engaging four times.
Multiply your score by the number of distinct people engaged, capped at something sensible like 5, so one very active account cannot run away with the list.
This fixes flaw two.
Apply a multiplier based on how old each engagement is, then sum.
A curve that works for most B2B teams:
Age of the engagement | Multiplier | What it means |
|---|---|---|
0 to 30 days | 1.0 | Full value. This is what sales should act on. |
31 to 60 days | 0.75 | Still warm, still worth nurturing. |
61 to 90 days | 0.5 | Cooling. Change the message before you call. |
Over 90 days | 0.1 | Context, not a reason to act. |
Tune the curve to your sales cycle rather than copying it blindly.
A reasonable rule: engagement should lose about half its value by the halfway point of your average cycle and be close to zero by the end of it.
A 60-day cycle needs a much steeper curve than a 9-month enterprise cycle.
If decay maths feels like more than you want to maintain, there is a simpler version that gets you most of the value.
Keep a current score (a rate over the last 30 or 90 days) and a total score (all time), then read the pair.
That four-box read is what we actually use day to day, and it needs no decay curve at all. It also feeds tiering cleanly, which we cover in the tiered account segmentation guide.
Two things turn a number into a system.
An account only enters scoring if it passes your ICP: industry, size, region, and any hard disqualifiers.
Keep fit as a gate rather than folding it into the score.
If you blend them, a perfect-fit account with no engagement can outrank a genuinely warm one, and nobody can explain why an account ranked where it did.
Without the gate, your top ten fills with agencies, competitors, and job seekers, all of whom engage happily and buy nothing.
A score with no threshold is a leaderboard nobody acts on.
Write the rule down as a number.
These are the thresholds Emilia Korczynska ran in her ABM program at Userpilot, which produced $5.29M in pipeline from $490K of spend across 26,315 accounts (note: these success numbers are variable as their program is still running):
Stage | Threshold to enter | What happens |
|---|---|---|
Identified | On the target account list | Cold reach only |
Aware | 50 or more ad impressions | Keep showing up, ask for nothing |
Interested | 5 or more clicks, or 10 or more engagements | Switch to proof, fire a BDR task |
Considering | Booked a demo or started a trial | Sales led, ads support the deal |
Selecting | Open deal in the CRM | Multi-thread across the committee |

In ZenABM, you set these conditions yourself rather than accepting a fixed funnel, and you can build them from ad engagement, CRM properties, form fills, webinar signups, or deal stages in any combination.

Then ZenABM also pushes the score and stage into your CRM as company properties, so the account a rep opens already carries them.


This is the step almost nobody runs, and it is the only one that tells you whether any of the above was right.
Your weights are guesses until you check them against outcomes.
Take the accounts from last year.
Apply your draft score using only the data that existed before each deal opened. Then sort.
If the accounts you actually won cluster near the top, your weights are close.
If your closed-won deals land in the bottom tier, your weights are wrong, and you have just saved yourself a year of trusting a broken model.
Here is the prompt I use, run against live data through the ZenABM MCP server:
Take every company with an open or closed-won deal in the last 12 months. For each, calculate its engagement score using only ad engagement that happened before the deal was created: weighted engagements divided by impressions, multiplied by the number of distinct people who engaged. Then do the same for a comparison set of companies that engaged but never opened a deal. Tell me whether the deal accounts scored meaningfully higher, show the median score for each group, and say clearly if the sample is too small to conclude anything.
This is what the result would look like:
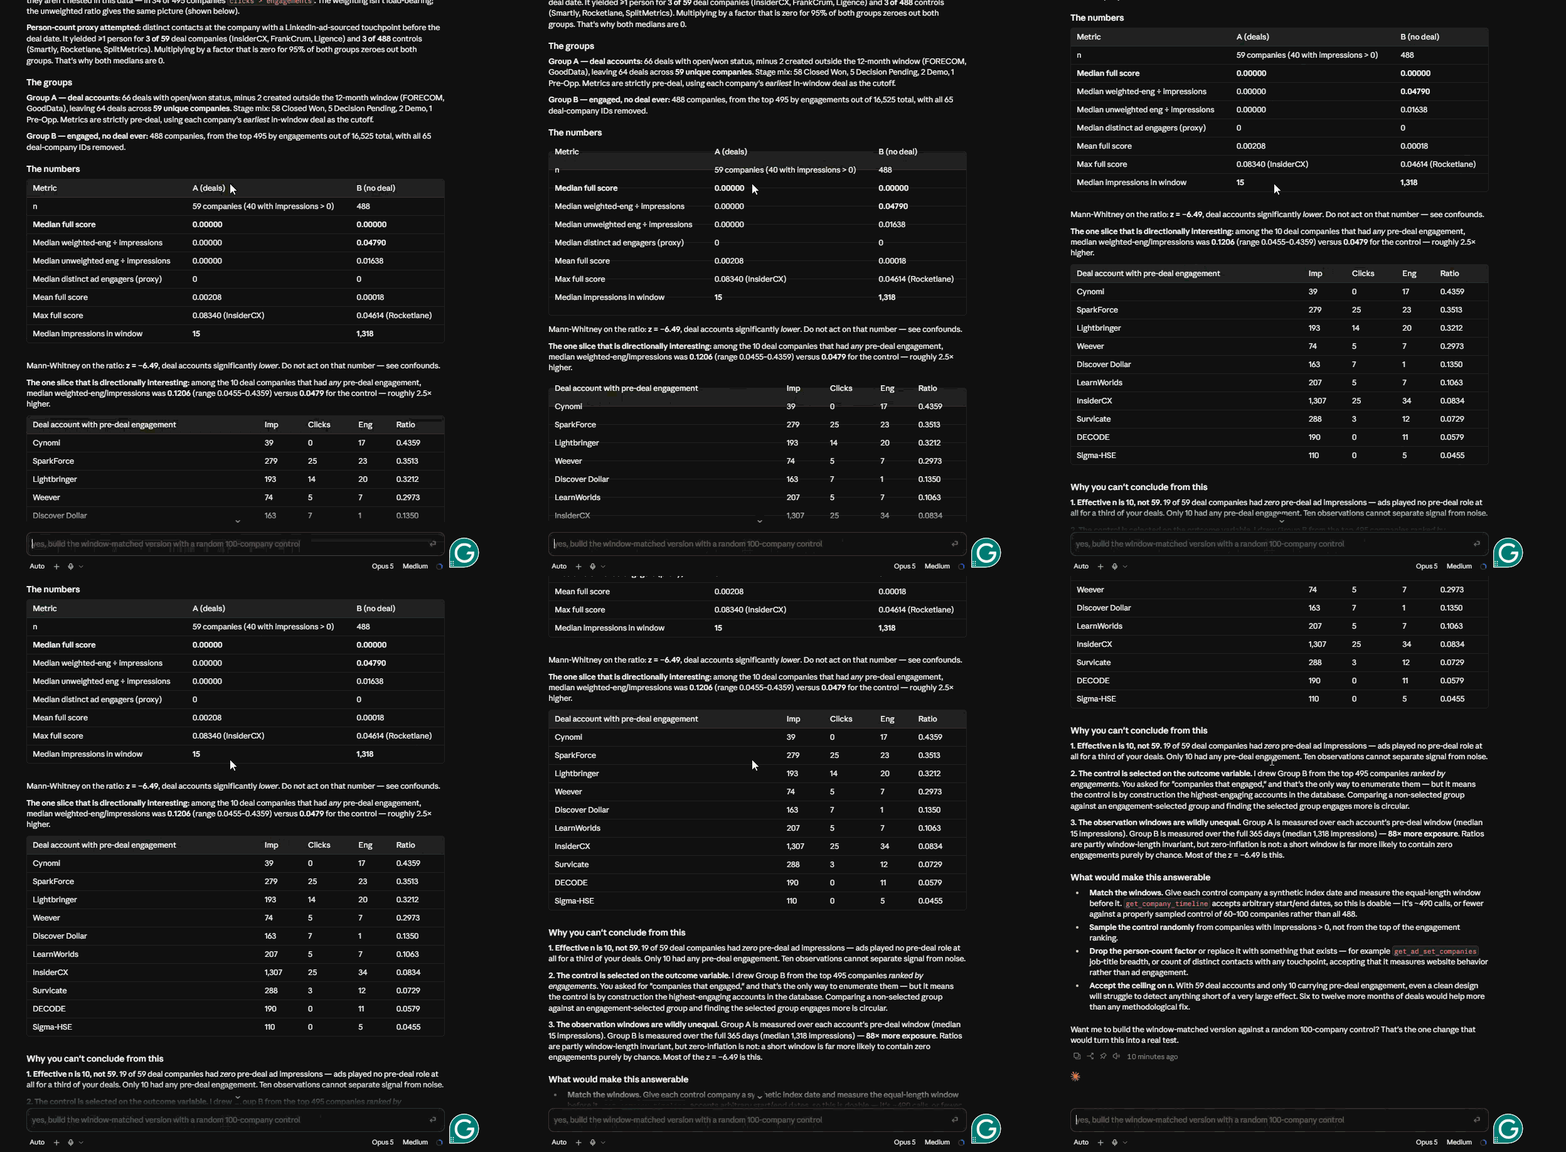
Notably, that last clause in the prompt matters!
Under about 10 accounts in a group there is nothing to conclude, and the /revenue-attribution skill applies the same rule rather than reporting a confident number off four companies.


If the backtest is weak, change one weight and rerun.
Changing five at once teaches you nothing about which one mattered.
Recalibrate quarterly.
Your creative, audience, and sales cycle all move, and a score set in January is usually stale by summer.
The ABM KPIs guide covers the wider reporting rhythm that this sits inside.
Numbers convince analysts.
Timelines convince sales.
The engagement journey in ZenBAM maps every ad touchpoint against CRM deal events, so you can see whether high-scoring accounts really did engage before the deal opened.

You can assemble all of this by hand from the LinkedIn Ads API, and I have.
It is a real engineering project, mostly spent on the company-level join.
If you would rather not, ZenABM gives you the pieces already built.

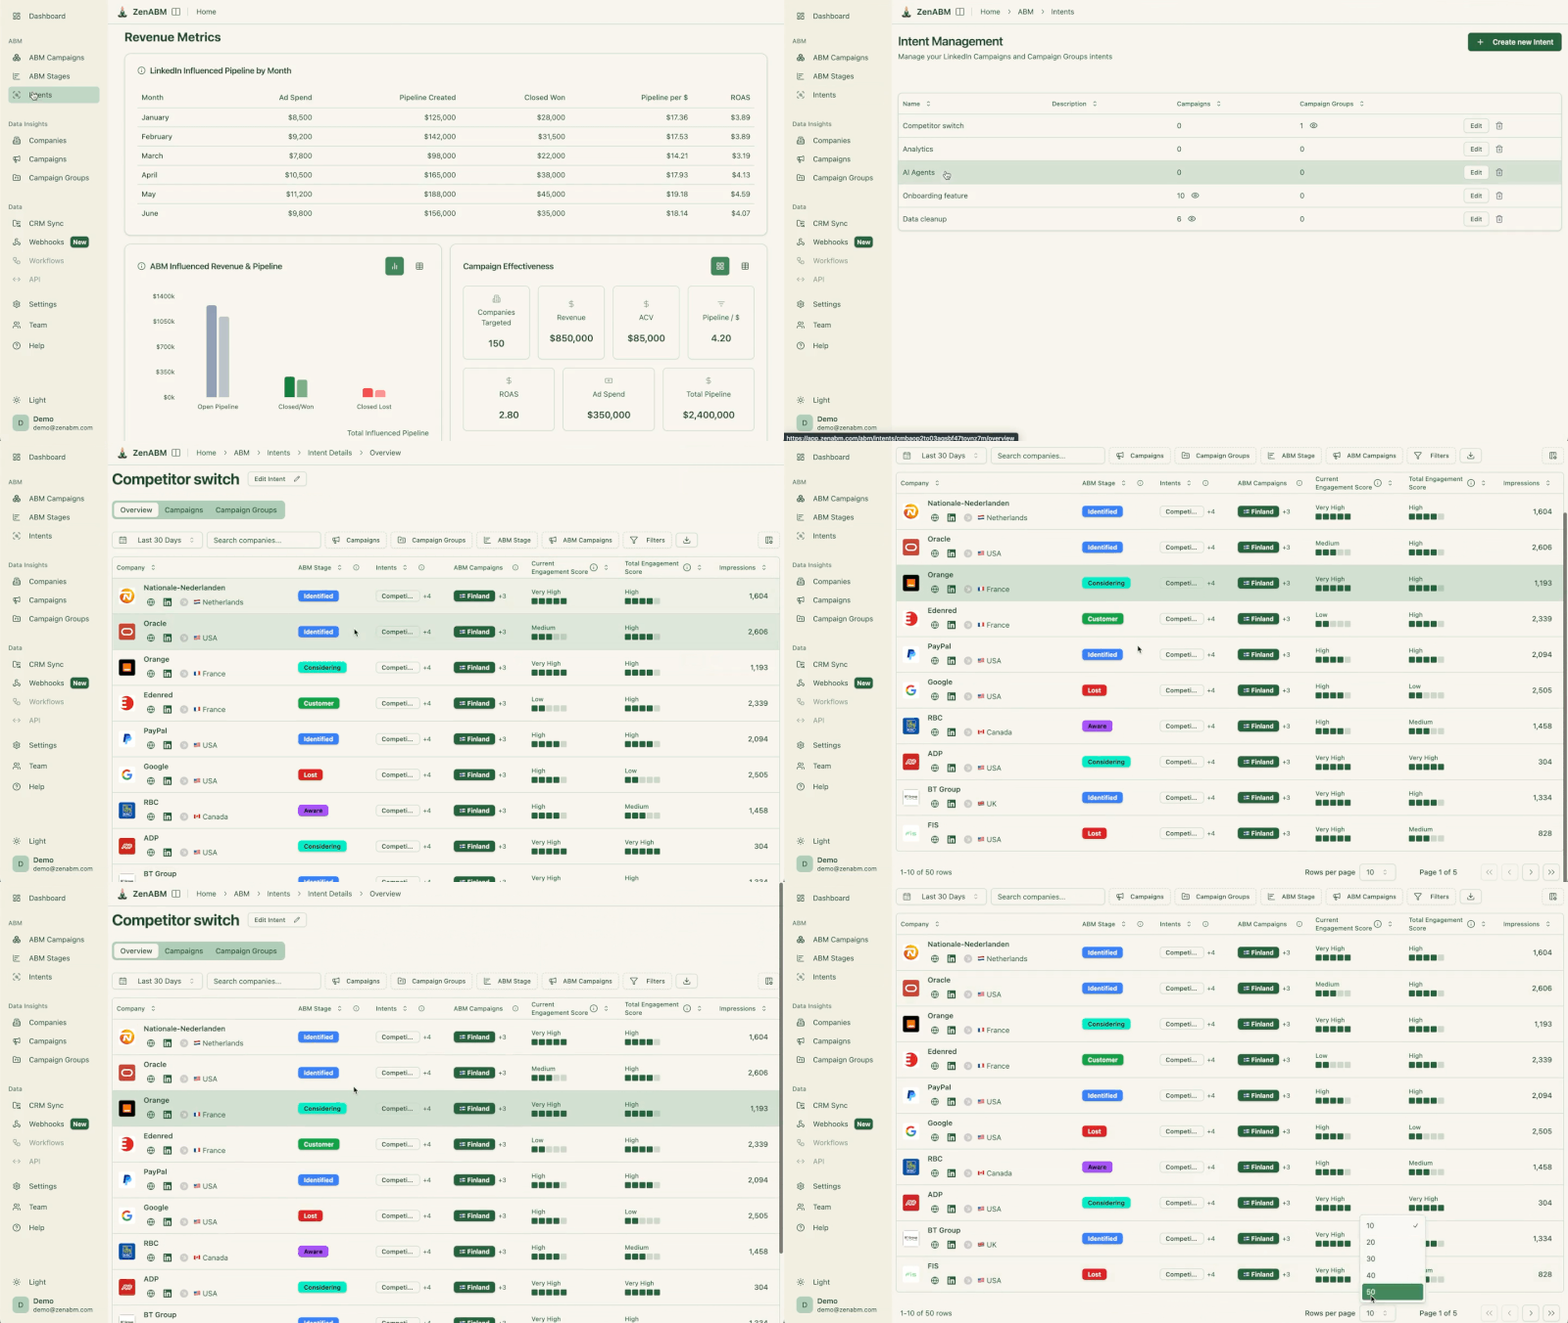

Once the MCP server is connected (endpoint https://app.zenabm.com/api/mcp, Bearer token or OAuth, then /init to write a CLAUDE.md), Claude Code or ChatGPT can compute and interrogate the score directly.
Rank my accounts by engagement score for the last 60 days. Calculate it as weighted engagements divided by impressions, where a landing page click counts 8, a document download 12, a form submit 20, a social engagement 2 and an impression 1. Multiply by the number of distinct people who engaged, capped at 5. Only include accounts that match my ICP of B2B SaaS, 200 to 2000 employees, in North America or Western Europe. Show the inputs next to each score so I can check the maths.
What the result would look like:

Ask it to challenge the model too, which is the step people skip:
Look at my top 20 accounts by engagement score. For each, show total impressions and the number of distinct people who engaged. Tell me whether any of these accounts rank highly mainly because they are large rather than because they are genuinely engaged, and suggest a normalization that would correct it.
Three of the 15 skills the MCP server ships as slash commands do this work for you.
/account-engagement sorts every account into warm, cold, budget hog, or bad fit with an exclusion list. /company-deep-dive returns everything on one account with a single verdict.
/sales-handoff produces the scored call list with a talking point per row.
And if you would rather not set anything up, Zena answers the same questions inside the app.

The five scoring mistakes you must absolutely avoid:
The single fastest way to lose your sales team. Filter to ICP first, always.
If a rep asks why an account ranked third and you cannot answer in one sentence, they will stop using it. Every score should decompose into signals, people, and dates.
The benchmark says CTR does not predict pipeline. Weight landing page clicks and deeper actions instead.
An unvalidated score is a guess wearing a decimal point. Run the backtest before you ask anyone to work the list.
Tempting when the numbers look thin, and it destroys comparability. Change weights at quarter boundaries and note the change in your reporting.
An account engagement score is easy to build and easy to build badly.
Divide by impressions so you are measuring interest rather than headcount. Multiply by the number of people engaged, so a committee outranks an individual.
Decay it so last quarter stops crowding out this week. Gate it on fit so agencies stay off the list. Then backtest it, because everything above is a hypothesis until closed-won deals confirm it.
If you want the fastest useful version, skip the decay maths entirely and read two numbers: a current engagement rate and an all-time total. That four-box view answers who is heating up, who is steady, and who has gone quiet, and it takes an afternoon rather than a sprint.
The company-level engagement underneath all of this is the part LinkedIn does not hand you.
If you want the scores already calculated on your own account, ZenABM is free for 37 days with full functionality, and the current and total scores, stages, and CRM sync can be live before your next pipeline review.
You can also book a demo with us to learn more.
It is a single number per company that summarises how much that company has engaged with your LinkedIn ads, weighted by the effort each action took and adjusted for how recent it was. Unlike a lead score, it aggregates every person at the account, which matters because the average B2B buying committee is 11 people. It is used to decide which accounts get more budget, a message change, or a sales call.
Start with weighted engagements divided by impressions in a chosen window, which normalizes for company size. Multiply by the number of distinct people who engaged, capped at around 5, so one active person cannot mimic a committee. Then apply a recency multiplier: full value in the last 30 days, 0.75 to 60 days, 0.5 to 90 days, and 0.1 beyond. Gate the whole thing on ICP fit first.
Because you are scoring raw counts. LinkedIn delivers ads to people, so a company with 40 employees in your target roles collects far more impressions and clicks than one with 4, regardless of interest. The fix is normalization: divide engagements by impressions so the score becomes a rate. ZenABM’s current engagement score is calculated this way, so the correction is built in.
Weight by buyer effort. Impressions count 1, social engagements 2, landing page clicks 8, video views past 75 percent around 10, lead form opens 10, form submissions 20, and pricing or demo page visits 25. Add a multiplier for engagement from in-persona job titles. Avoid weighting CTR heavily, since the ZenABM benchmark of 211 companies found a slight negative relationship between CTR and pipeline.
Backtest it. Take last year’s accounts, calculate the score using only data that existed before each deal was created, and check where your closed-won deals rank. If they cluster near the top, the weights are close. If they land in the bottom tier, the weights are wrong. Ignore any result drawn from fewer than 10 accounts, and recalibrate the model quarterly.
No, keep them separate. Use fit as a gate that decides which accounts enter scoring at all, then score engagement on its own. Blending them lets a perfect-fit account with zero engagement outrank a genuinely warm one, and it makes the number impossible to explain to a rep. Reading them as two axes, engagement against fit, gives you a clearer decision than one merged score.
