



AI ABM reporting is not about buying another AI wrapper that gives generic advice, or an automation that drops report PDFs into Slack.
All of that is too basic for 2026.
For me, it is about having an AI-native system where I can throw a set of prompts at my own account data and get accurate analysis and personalised optimisation strategies back.
This post gives you exactly that system, with the exact prompts. So the next time your CEO asks “what is the ROI on ABM?”, you will have a better answer than a slide full of click-through rates, cost per click, and impressions: you will be able to draw one clean line from ad spend to pipeline and revenue.
Here is the whole system in one block:
/weekly-digest skill runs it and schedules itself./linkedin-abm-report skill produces it as a branded document./revenue-attribution skill adds a deal-rate lift with a p-value, flags samples under 10 companies, and says “correlation, not causation” out loud.Do not think of this as AI writing the report and you reading it, because that is not the split.
AI does the slow 80%: the pulls, the CRM joins, the sorting, and the first draft of what the numbers say.
You do the judgment, which is deciding whether a finding matters and what to change because of it.
That judgment stays yours, and it should.
One report cannot serve everyone, so automate three, on three schedules:
| Report | Cadence | Who reads it | What it answers |
|---|---|---|---|
| Operator digest | Weekly (Monday) | You and the ops team | What changed last week, what to fix now |
| Exec recap | Monthly | CMO, revenue lead | Pipeline, progression, one decision for next month |
| Attribution report | Quarterly | Board, finance | Which spend produced pipeline, honestly |
The rest of this post builds all three, starting with the data layer they run on.
Every prompt below assumes Claude can see your account, and since there is no official LinkedIn or CRM connector for Claude, the link goes through an MCP (Model Context Protocol) server.
The ZenABM MCP server is built for exactly this: it exposes your first-party ABM data as tools Claude can call, from company-level engagement pulled straight from the LinkedIn Ads API to ABM stages, intent signals, deals from your CRM, and revenue attribution per campaign.
Setup is three steps.

https://app.zenabm.com/api/mcp (Bearer token or OAuth)./init so the server writes a CLAUDE.md file that tells Claude how your account is built.
The same server works in ChatGPT and Cursor too, so your whole team can query the account without opening Campaign Manager.

Two metrics run through every report, so I will define them now.
eCTR is the click-through rate to your landing page, which is landing-page clicks divided by impressions. eCPC is the cost of each of those clicks.
LinkedIn’s own CTR counts likes and comments too, so it reads higher than the click that actually costs your page a visit, which is why eCTR and eCPC are the honest numbers for reporting.
The full connection guide and tool list is at zenabm.com/mcp/docs, and access starts on the $59 per month plan with a 37-day trial (current tiers are on the pricing page).


This is the report you read with coffee on Monday, and it is for you and the ops team, not the CMO. It answers one question: what changed last week, and what do I fix now?
Paste this prompt.
Using the ZenABM MCP tools, list every company that entered a new ABM stage or picked up a new intent signal in the last 7 days. For each, pull the campaigns and creatives that drove the engagement and any open deals. Then flag ads whose eCTR declined for the second consecutive week, and propose (do not execute) which to pause and where to move the budget.
Read the stage movers first, because those are the accounts warming up, and some are ready for sales.
Read the decaying ads second, because a two-week eCTR slide is budget leaking in real time.
The prompt ends in a proposal rather than an action, so nothing changes until you approve it. I ran a similar prompt for our program.

If you do not want to write the prompt at all, the ZenABM MCP server ships a skill that runs this whole thing: /weekly-digest.
It gives you a one-line stakeholder headline over a full operator view of what changed week over week, and it offers to schedule itself for every Monday.
That is the difference between a report you remember to run and a report that just shows up.
This is the report your CMO reads, and here is the thing most people get wrong: executives do not want an attribution debate.
They want to know whether the program is working and growing the business, so you lead with progression (more accounts moving from aware to engaged to opportunity) and pipeline, not clicks.
The thing is, it’s not uncommon for the CTR slide never to land in the room; the pipeline slide always does, though.
Here is the prompt for a monthly recap.
Build a monthly ABM exec summary for last month versus the month before. Give me three sentences at the top: spend and its trend, influenced pipeline and pipeline per dollar and its trend, and one decision for next month. Then a table of the campaigns that touched new deals, how much pipeline, at what spend. Then which accounts moved into buying stages, and the top 3 risks and top 3 opportunities, each with its number.
I ran a similar prompt for our program.

The free /linkedin-abm-report skill, which is part of the ZenABM free skills package, runs this exact recap: spend, pipeline and deals influenced, best campaigns and formats, top engaged companies, month-over-month change, and recommendations, written for a reader who will never open Campaign Manager.


It helps to see what the skill produces on real data, so here is our own July 2026 run, section by section.
The report opens with an executive summary that reads the way a good analyst would write it: July was a turnaround month, because the account shifted the bulk of spend out of an underperforming Single Image ad set and into Thought Leader Ads, and the account-level numbers moved with it. Clicks nearly quintupled, CPC fell, and influenced pipeline grew 22.6% to $4,206 on an essentially flat spend.
Three cards at the top carry pipeline generated, deals influenced, and total spend, each with its month-over-month change, so the headline lands before anyone scrolls.
From there, the report walks seven sections, and each one earns its place.
The thing to notice is what the report refuses to do.
It does not hide the open problem (a share of TLA clicks are profile or reaction clicks rather than real site visits), it does not count test deals as pipeline, and it does not flatter a format by grading it on the wrong metric.
That honesty is the whole point, and it is why the output survives the meeting instead of getting picked apart in it.
A useful frame from years of doing this is to split your metrics into leading and lagging. Leading indicators predict pipeline, so track them monthly.
Lagging indicators are the ones you fix to grow pipeline over time, so track them quarterly.
Here is the split I report.
| Type | Metric | Why it earns a place |
|---|---|---|
| Leading (track monthly) | ||
| Reach | Percent of target accounts with 1+ impression | If you are not reaching the list, nothing else matters |
| Engagement | Percent of reached accounts clicking or engaging | Early sign the message is landing |
| Stage progression | Accounts moving aware to engaged to interested | The single best predictor of future pipeline |
| Lagging (track quarterly) | ||
| Influenced pipeline | Deal value from accounts with ad engagement | The number the CFO actually asked for |
| Pipeline per dollar | Influenced pipeline divided by ad spend | A clean efficiency number, hard to argue with |
| ROAS (closed-won) | Closed revenue from influenced accounts over spend | The end of the argument, once deals close |
The rule that ties it together is to measure pipeline per dollar, not cost per lead. ABM does not make leads in the old sense; it moves buying committees at target accounts.
Report cost per lead and ABM will always look expensive next to demand gen, even when it produces far more pipeline.
The benchmark to hold yourself against is $5.21 in influenced pipeline per dollar at the median, and $15.20 for top performers, from the ZenABM ABM Benchmarks Report 2026.
This is the report that answers “what is the ROI”, and it is where the model matters most.
The default report in Campaign Manager and most tools uses click-based last-touch attribution, which gives 100% of the credit to the last ad someone clicked before converting.
For ABM, that is broken, and here is why. Picture one target account.
Under last-touch, the retargeting ad gets all the credit and the TLA that started the whole thing gets zero. Multiply that across 200 accounts, and your report tells you TLAs make no pipeline and retargeting makes all of it. So you cut TLAs, pipeline drops, and you conclude ABM does not work.
The program was fine; the model was wrong.
Influence-based attribution asks a better question, which is which campaigns touched this account before the deal opened, and every one of them gets credit.
AI makes this practical because it can join every account-level touchpoint to every CRM deal in one pass, which is exactly the join that used to take a data warehouse.
Here is the prompt to put in Claude or ChatGPT connected to the ZenABM MCP server.
Which campaigns and ad sets were the most common touchpoints before open deals and before closed-won deals? And which spend produced no pipeline at all this quarter?
The answer reframes the whole report. A campaign with a weak CTR that shows up before half your closed-won deals is not one to cut; it is one to defend, and a campaign with a great CTR that never appears before a deal is the opposite.
Here is where a lot of AI reporting goes wrong, and where you should hold the line. When the report says “campaign X correlates with deals”, that is a correlation, not proof that X caused the deal, because engaged accounts may already have been in-market. A good attribution report says so out loud.
The /revenue-attribution skill in the ZenABM MCP server builds this in, and ZenABM has the same capability in its UI.


It tests which campaigns, intents, and stages predict open deals and shows a deal-rate lift with a p-value for each. It flags “sample too small” under 10 companies, and it says “correlation, not causation” in plain language. That is the difference between a report that survives a sharp CFO and one that gets torn apart.
If you take one habit from this post, take that one: report influence and correlation honestly, and your numbers become impossible to dismiss.

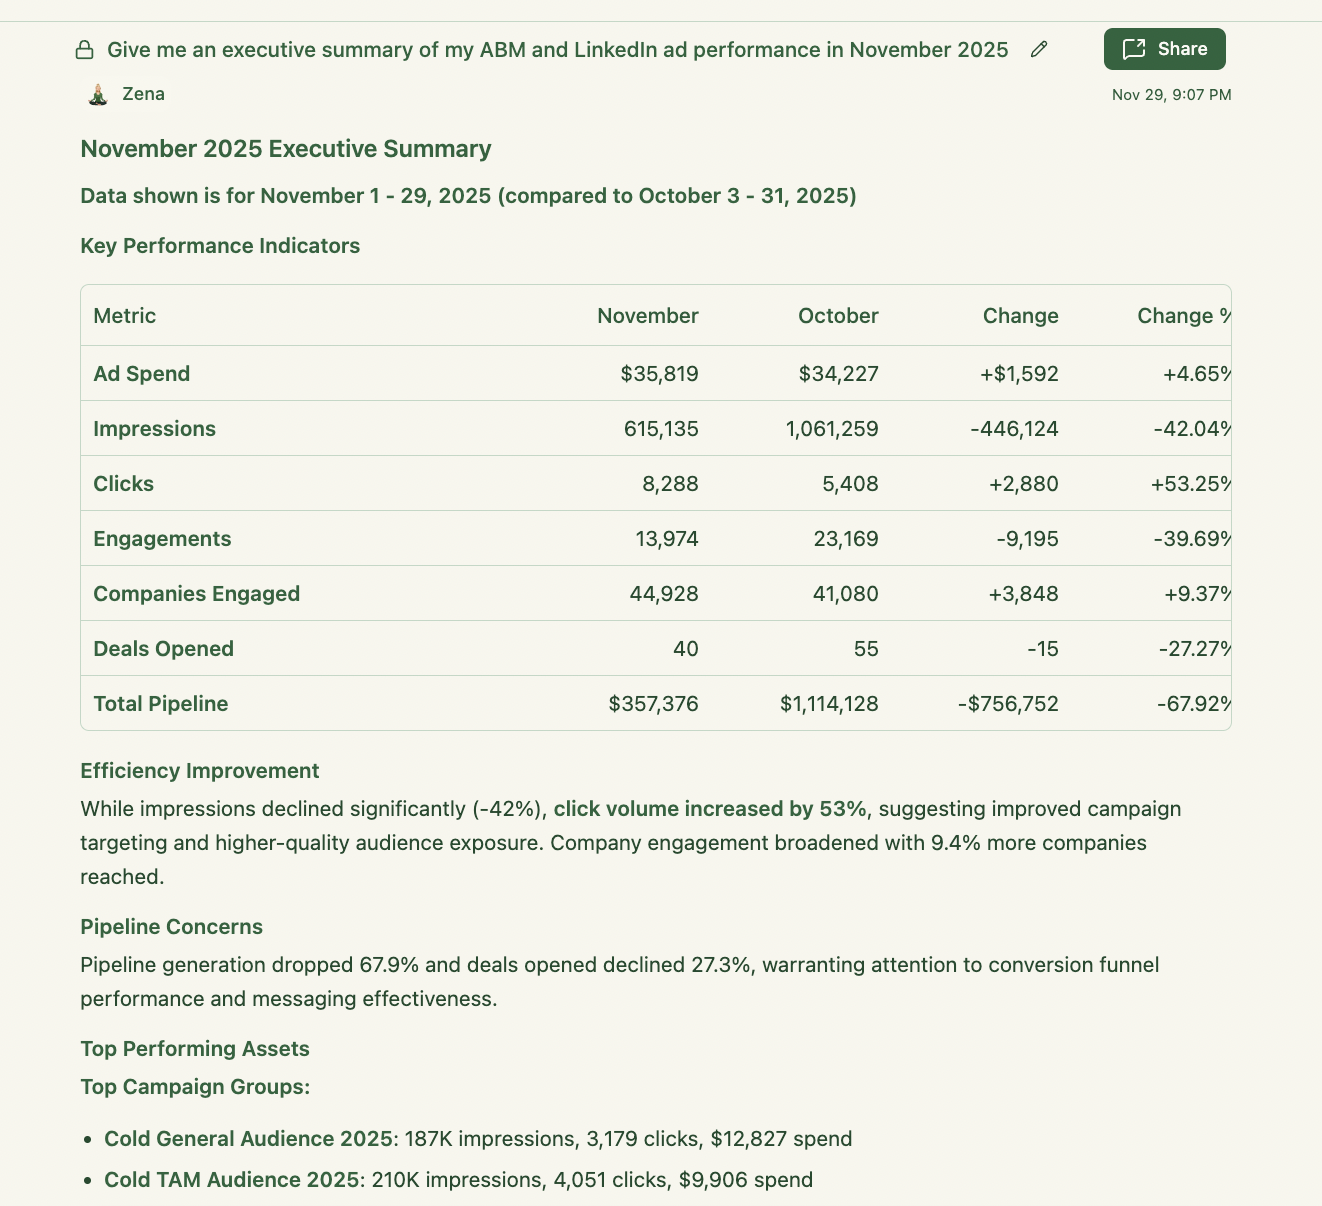
The MCP server is for teams that want the data inside their own agent. Zena is the reverse: it lives inside ZenABM, so anyone on the team can ask a reporting question without opening a terminal.
You ask which campaigns drove the most pipeline, or which companies engaged this week, and Zena answers from the live account.
You can try Zena free without an account.
Zena Proactive is the part that matters most for reporting, because it removes the asking entirely.
Instead of waiting for you to run the prompt, it builds the summary on a schedule and shows it on your dashboard: every Monday the weekly report, every first of the month the monthly, every first of the quarter the quarterly.
It answers a fixed question set each time, so the reports are comparable period over period.
It also flags things you would otherwise miss: the 5 accounts surging in engagement and ready for sales, and the decaying ads, defined as an eCTR decline four weeks in a row.
That flag is deliberately strict, so you are acting on a real trend rather than one noisy day.
This is what “AI ABM reporting” actually means: not a faster export, but a report that writes itself and tells you what to do.
The three reports above cover most of the job, but the real reason to connect your data is the question you did not plan for. Your CEO pings you: “How is the finance vertical doing?” Before, that was a fresh export and an hour.
Now it is one prompt.
For target accounts in the finance industry, show me this quarter: reach, engagement rate, how many moved into interested or later stages, influenced pipeline and pipeline per dollar, and the three campaigns that touched the most of those accounts before a deal opened.
That is the shift. When the data is connected and the model is right, reporting stops being a weekly chore and becomes a conversation you can have in real time, in front of the person asking.
Running prompts by hand is fine once, but to report every month without thinking about it, you save the workflow as a skill.
There are two free paths.
The first is to install the four ZenABM Claude skills in Claude Code.
/plugin marketplace add ZENABM/linkedin-abm-skills
/plugin install linkedin-abm-skills@zenabm
That gives you /linkedin-abm-report for the monthly recap, plus /abm-strategy-planning, /abm-campaign-execution, and /linkedin-abm-audit for the rest of the program. On Claude Desktop or web, you download the zips from the releases page and upload them under Customize, then Skills.
The second path is the MCP server itself, which ships 15 skills as slash commands with no install, including the three that matter for reporting: /weekly-digest, /linkedin-abm-report, and /revenue-attribution.
Ask the connected agent what it can do, and it lists them.
Either way, the point is the same: you build the report logic once, and after that the machine runs it while you read the answer and make the call.
To give these skills an account to run on, just try ZenABM’s 37-day free trial or book a demo with us to know more.
Yes. With your ABM data connected through an MCP server, Claude can build the report in minutes: it pulls company-level engagement, joins it to your CRM deals, ranks campaigns by influence, and drafts the summary. You still make the calls about what to change. The working split is AI for the mechanical assembly and the first read, a human for the judgment, and a confirmation gate before any action.
Lead with pipeline and progression, not clicks. A strong ABM report has three layers: leading indicators (account reach, engagement rate, stage movement), lagging indicators (influenced pipeline, pipeline per dollar, ROAS), and an influence-based attribution view showing which campaigns touched deals. Report correlation honestly, not as proof of cause. Skip cost per lead entirely, because ABM moves buying committees, it does not make leads in the old sense.
A dashboard shows you fixed charts you still have to read and interpret. AI ABM reporting answers questions in plain English, joins your ad data to CRM deals automatically, and writes the summary and the recommendation. The bigger difference is cadence and reach: a scheduled agent like Zena Proactive builds the report before you ask and flags what changed, and any new question becomes one prompt instead of a fresh export.
Use influence-based attribution, not click-based last-touch. Track every ad touchpoint at the account level, connect it to CRM deals, and credit every campaign that touched an account before the deal opened. Then report influenced pipeline divided by ad spend. AI does the join in one pass. The benchmark to aim for is $5.21 in influenced pipeline per dollar at the median, rising past $15 for top performers, per the ZenABM 2026 report.
Run three cadences. A weekly operator digest catches leaks and stage movers while you can still act on them. A monthly exec recap shows pipeline and progression to leadership. A quarterly attribution report answers the ROI question for the board. Once it is automated with a skill or with Zena Proactive, the marginal cost of running weekly is near zero, so there is no reason to report quarterly only.
Three things: a company-level engagement source that captures which accounts engage with your ads, a CRM with deal records, and an agent runtime like Claude connected to both. ZenABM covers the first from the LinkedIn Ads API. It syncs bi-directionally with HubSpot and Salesforce for the second. And it exposes all of it to Claude through its MCP server for the third, plus Zena for teammates who prefer plain chat over a terminal.
