
Having mountains of LinkedIn ad data but struggling to make sense of it?
In this article, I have laid out all that you need to use LinkedIn ad analytics for account scoring for your ABM campaigns. Experts on social media and Google had a lot to say about this. So I have compiled the most consistent and actionable tips I found during my research.
And yes, ZenABM can help with LinkedIn ad data-led account scoring, and I have discussed that here.
Read on!
Account scoring is the backbone of a successful ABM strategy.
Why?
Because ABM isn’t about volume; it’s about precision. You have a finite list of target accounts that could be high-value customers – your job is to figure out which of those companies are warming up to your outreach, and which ones aren’t worth your focus right now. Traditional lead scoring (scoring individual people) doesn’t cut it for ABM, where you’re selling to a buying committee. You need to look at the account as a whole.
In other words, it keeps everyone focused on the right companies, not just the right leads. Another reason account scoring is crucial: timing. Industry data indicate that only about 5% of your target market is actively searching for a solution like yours at any given time. If you can identify the 5% (in-market accounts) and alert your sales team, you gain a huge advantage. Scoring models help surface those telltale signals (web visits, ad engagement, content downloads, etc.) that indicate an account is in a buying cycle.
It’s the difference between your sales team calling a company that has no idea who you are, versus calling after that company spent the last week bingeing your LinkedIn content and visiting your pricing page.
LinkedIn Ads are a fantastic ABM channel because they let you get in front of the right people, but those people rarely click on the ads. The average LinkedIn ad CTR is around 0.4 to 0.5%.
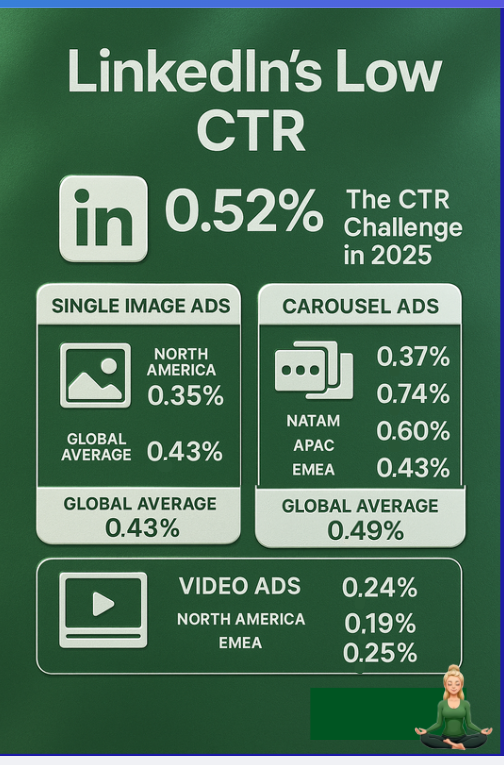
That means 199 out of 200 people who saw your ad didn’t click it.
Does that mean they felt no impact?
Of course not.
Many may visit your website later, Google your brand, or read an email from you after seeing your LinkedIn ad. But if you’re only tracking clicks, all those accounts look “inactive” and your reports undervalue LinkedIn’s influence as a result.
Say Acme Corp is on your target list. Five people see your LinkedIn ads in a month but don’t click. A week later, one Googles your product and visits your site; another fills out a demo form. Traditional analytics credit Google or your site, missing LinkedIn’s “assist.” Scoring only on clicks would give Acme zero, ignoring their warming interest. That’s why view-through engagement matters in ABM and why LinkedIn’s native reports miss it when different people from the same company take action.
Traditional metrics focus on individual leads/MQLs. But in ABM, you care if anyone from Acme engaged. Maybe the CTO ignored your ad, but a director clicked – that’s still buying committee engagement. Conventional tracking might miss it if the CTO later becomes the opportunity. Account scoring solves this by aggregating activity at the company level.
Marketers have attempted patchwork solutions to fill these gaps, like:
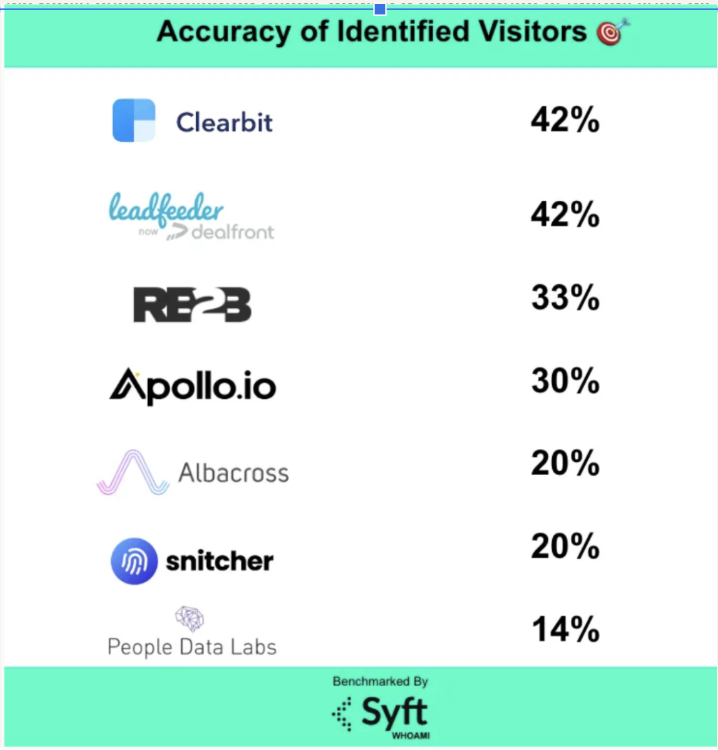 So, chasing anonymous web traffic isn’t a reliable way to measure your LinkedIn campaign impact.
The takeaway: ABM needs a different lens. We can’t judge an account’s interest solely by direct clicks or last-touch attribution. Instead, we need to capture all the meaningful interactions an account has with our ads and content, including passive engagements like viewing an ad and measure those cumulatively. That’s the only way to fairly score an account’s true engagement level. It’s a shift from a lead-centric, click-centric mindset to an account-centric, engagement-centric one.
Let’s focus specifically on LinkedIn ad analytics now.
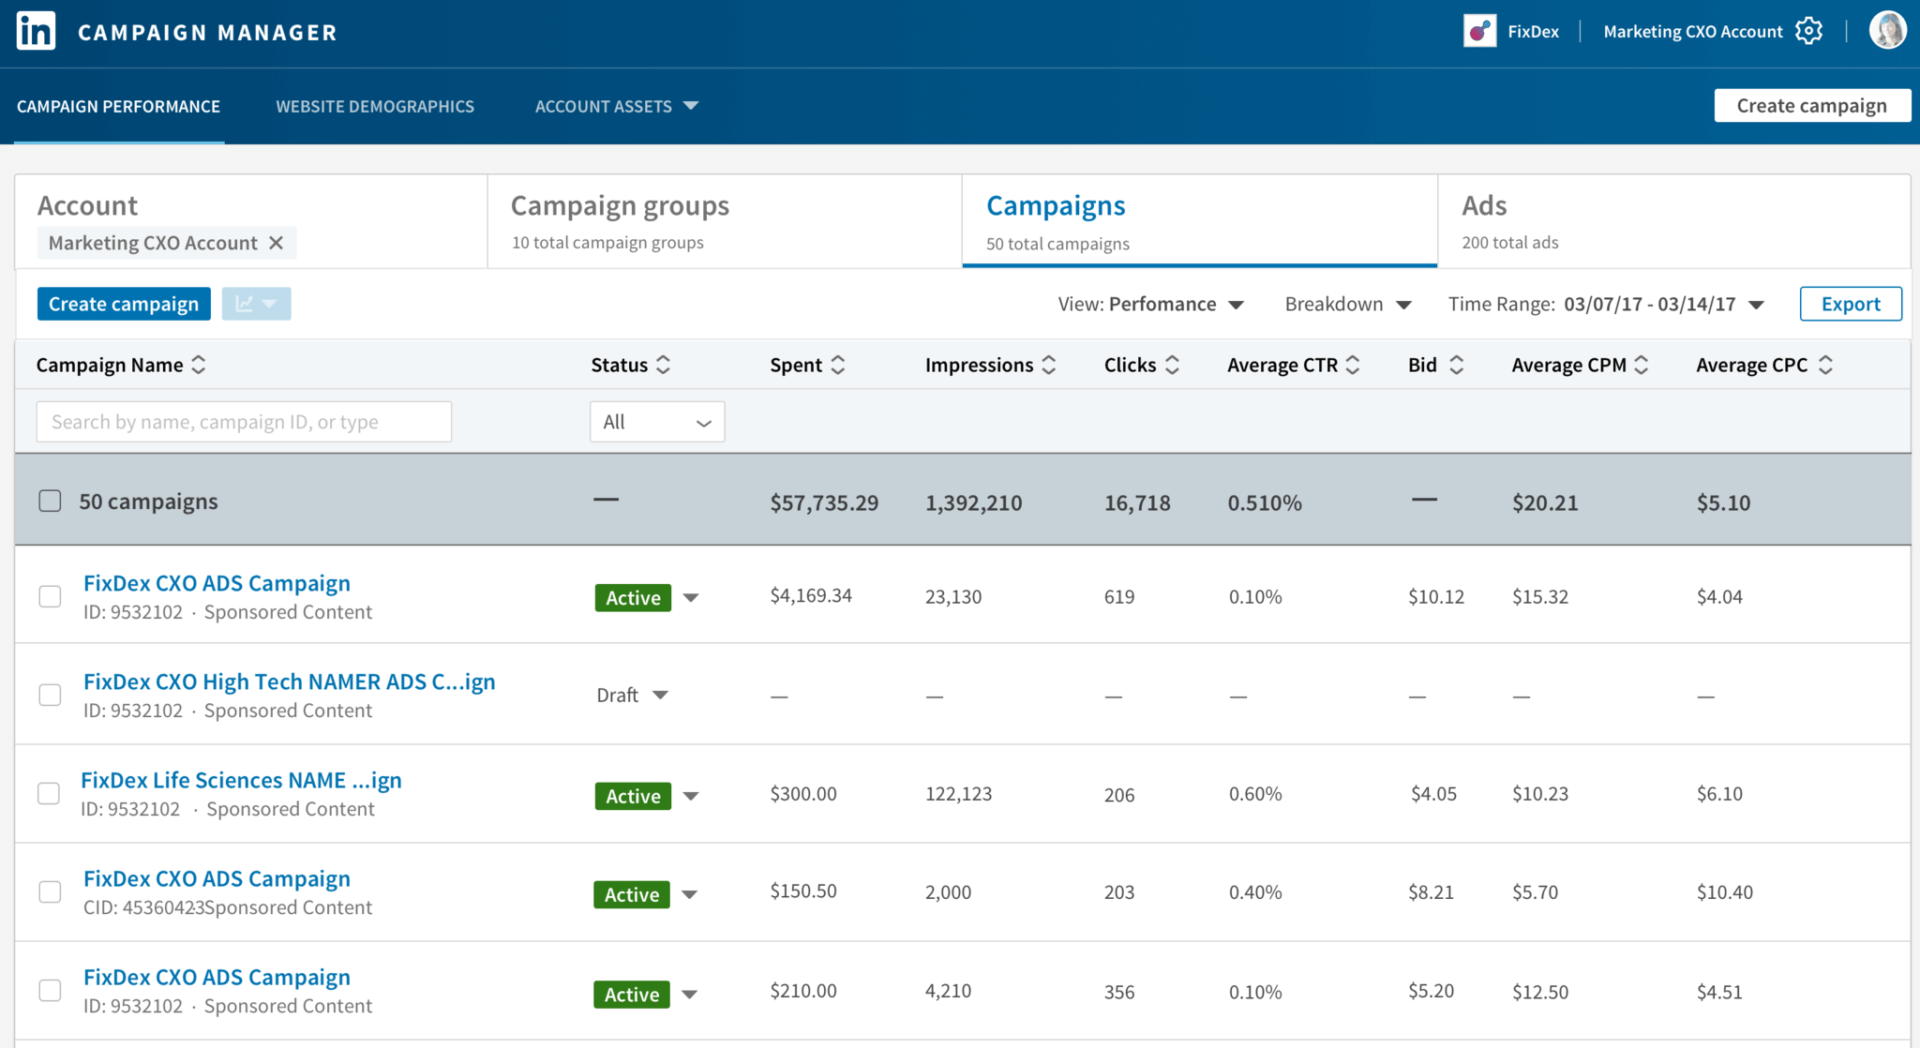
 Now, from an intent standpoint, not being able to see company-level engagement at the campaign level is a huge missing detail. I mean, wouldn’t your sales team love to know if Acme is interested in Feature A vs. Feature B to personalise their pitch?
Not all engagement metrics are created equal.
When constructing an account scoring model from LinkedIn analytics, focus on these first:
Baseline metric: how many times your ad was shown to the account. High counts mean repeated exposure, not intent. A sudden jump, especially with a frequency cap, can mean more people from that company entered your audience. Include impressions in scoring to credit exposure and capture view-through interest.
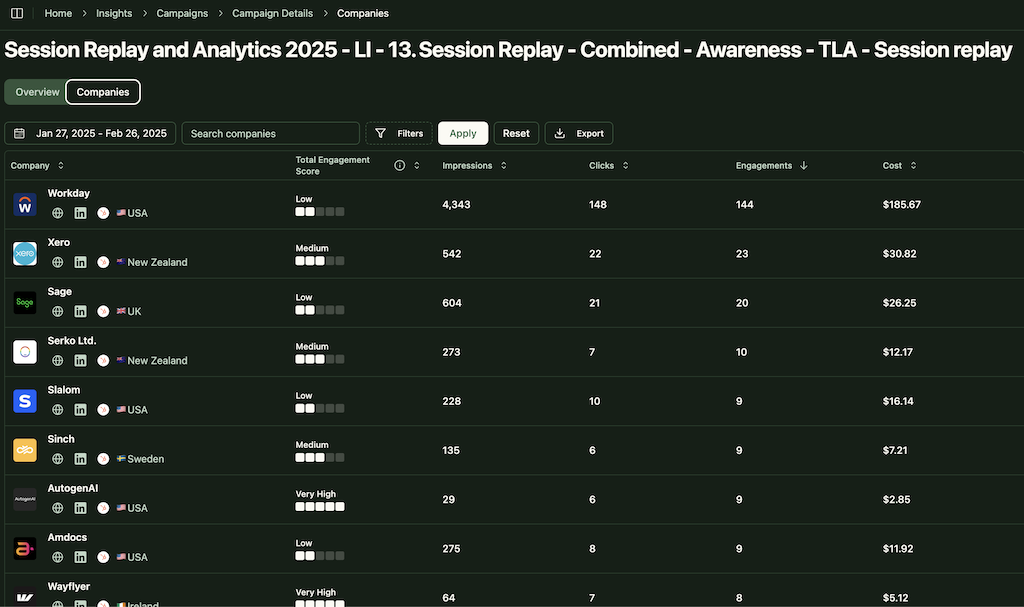
Clicks show active interest. At the account level, a click means someone took action. Prioritize clicks higher than impressions. Watch CTR, for example, 10 impressions and 3 clicks is unusually high and should boost the score. The Companies tab shows clicks per account, and exported or API data lets you calculate CTR per account.
These signal public interest. Comments or multiple reactions indicate high engagement, trigger a sales follow-up. Even a Like can be weighted above a click because it shows on-platform content resonance. LinkedIn counts these social actions in engagement metrics, and they are available via API.
Lead Gen Form submissions are top-tier signals, equal to or above a demo request. The Companies tab shows lead counts for lead gen campaigns. One form fill from a target account can justify a high score.
Not a behavior, but high spend on an account signals heavy targeting and reach. If you spent a large amount to reach Acme last quarter, they were costly or saw many ads. Use this as a diagnostic to judge whether engagement justifies continued spend. If impressions are in the model, raw spend is usually unnecessary for scoring.
Shameless plug: All this is available to be tracked in ZenABM (more on this later in the article).
Here’s a step-by-step approach to creating a scoring model for account engagement using LinkedIn ad data:
Decide which LinkedIn metrics to include. As discussed, impressions and clicks are the primary ones. Let’s say you choose impressions, clicks, and LinkedIn lead fills (if applicable). You might also include an “engagement” count if you want to group likes/comments with clicks, but to keep it simple, let’s focus on impressions and clicks for now.
Give each metric a weight that reflects its importance. For example:
These numbers can be whatever makes sense for your business – the ratio matters more than the absolute value. The idea here is that clicks are ~5x more indicative of intent than a mere impression, and an actual lead form is even more indicative, hence a higher score. If you also want to factor in reactions or comments, you might slot them in at, say, 7 points each (somewhere between a click and a lead form in intent strength).
Build in a time decay.
Accounts that engaged heavily 12 months ago but have gone quiet shouldn’t outrank accounts that started engaging last week.
There are a few ways to do this. One simple method is to have two scores: recent score (e.g. last week’s activity) and all-time score. Or, you could subtract points for periods of inactivity (e.g. minus X points if no clicks in the last 60 days).
Decide what score ranges constitute cold, warm, or hot (or whatever labels you use, such as “aware”, “engaged”, “sales-ready”). For example, you might say:
These thresholds will vary based on how much engagement you expect. If your campaigns are high-volume, scores will be higher; adjust accordingly. What’s important is that you have a clear line at which an account becomes worthy of sales attention. Maybe that line is “at least 2 different people clicked” or simply “score above 20 points triggers a BDR to follow up.”
Backtest the model on historical data. Won accounts should score high before conversion; never-engaged accounts should stay low. Use results to tune weights: raise impressions if clicks are rare; raise clicks if impressions are common. Treat v1 as a draft and keep iterating.
Clearly write out how the score is calculated and make sure your team understands it. For example: “Score = (Impressions in last 90 days * 1) + (Clicks in last 90 days * 5) + (LinkedIn leads in last 90 days * 10). After 90 days, engagements are dropped from the score.” This clarity is useful when communicating to sales why an account is scored a certain way. It also helps if you want to implement it in a system (since a developer or admin might need the formula).
I’d be remiss not to share how we tackle all of this at ZenABM, since solving these exact challenges is our bread and butter 😉
ZenABM connects to the LinkedIn Ads API and pulls in company-level engagement data for each campaign you run. This includes impressions, clicks, and other interactions, broken down by account, for every single LinkedIn campaign and campaign group in your ABM strategy.
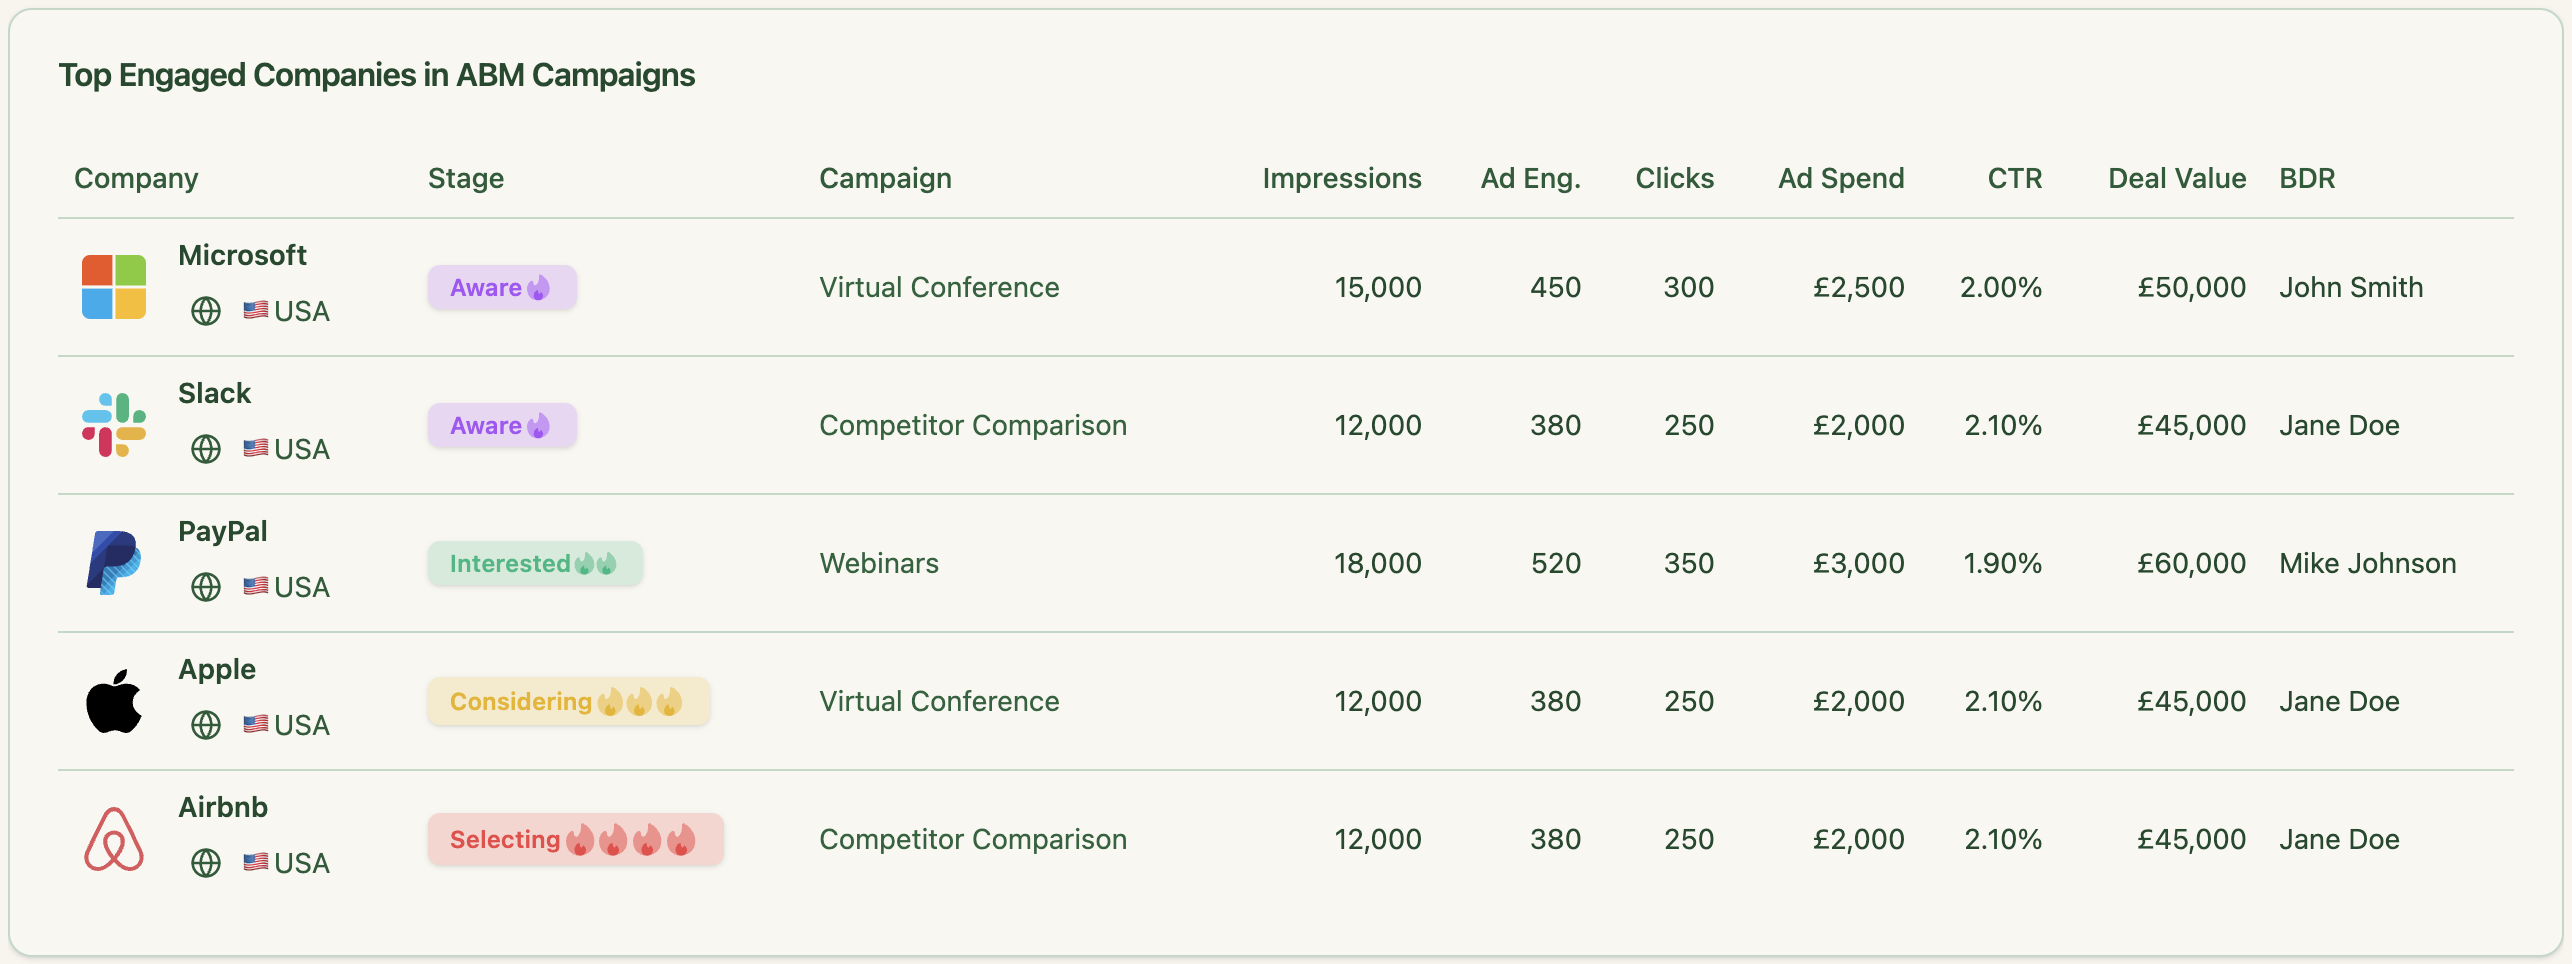
The result: you get a detailed view like Company X saw Ad A 5 times and Ad B 3 times, and clicked Ad B once. This is the level of granularity ABM teams need but can’t get from LinkedIn’s native UI.
By having campaign-specific engagement, you immediately know each account’s interests. And because ZenABM uses the official LinkedIn API with first-party data, it’s reliable and compliant (no sketchy scraping or guessing).
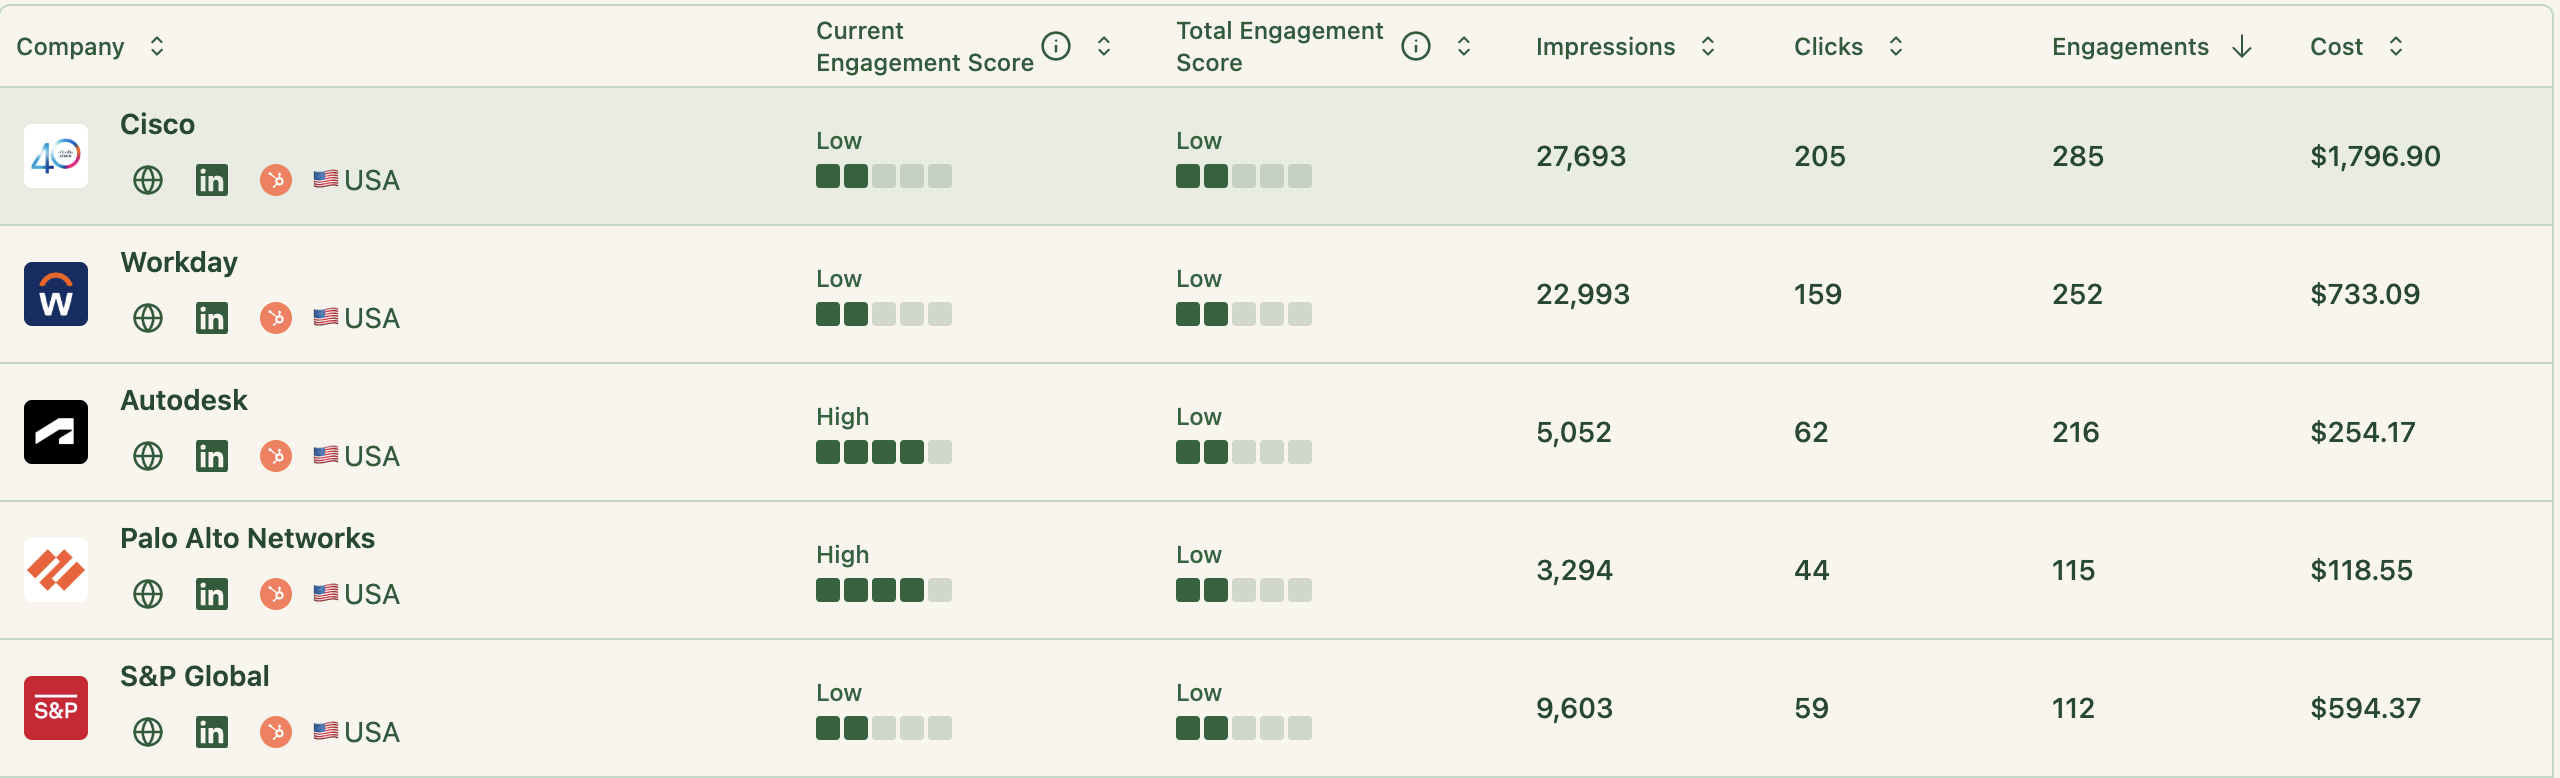
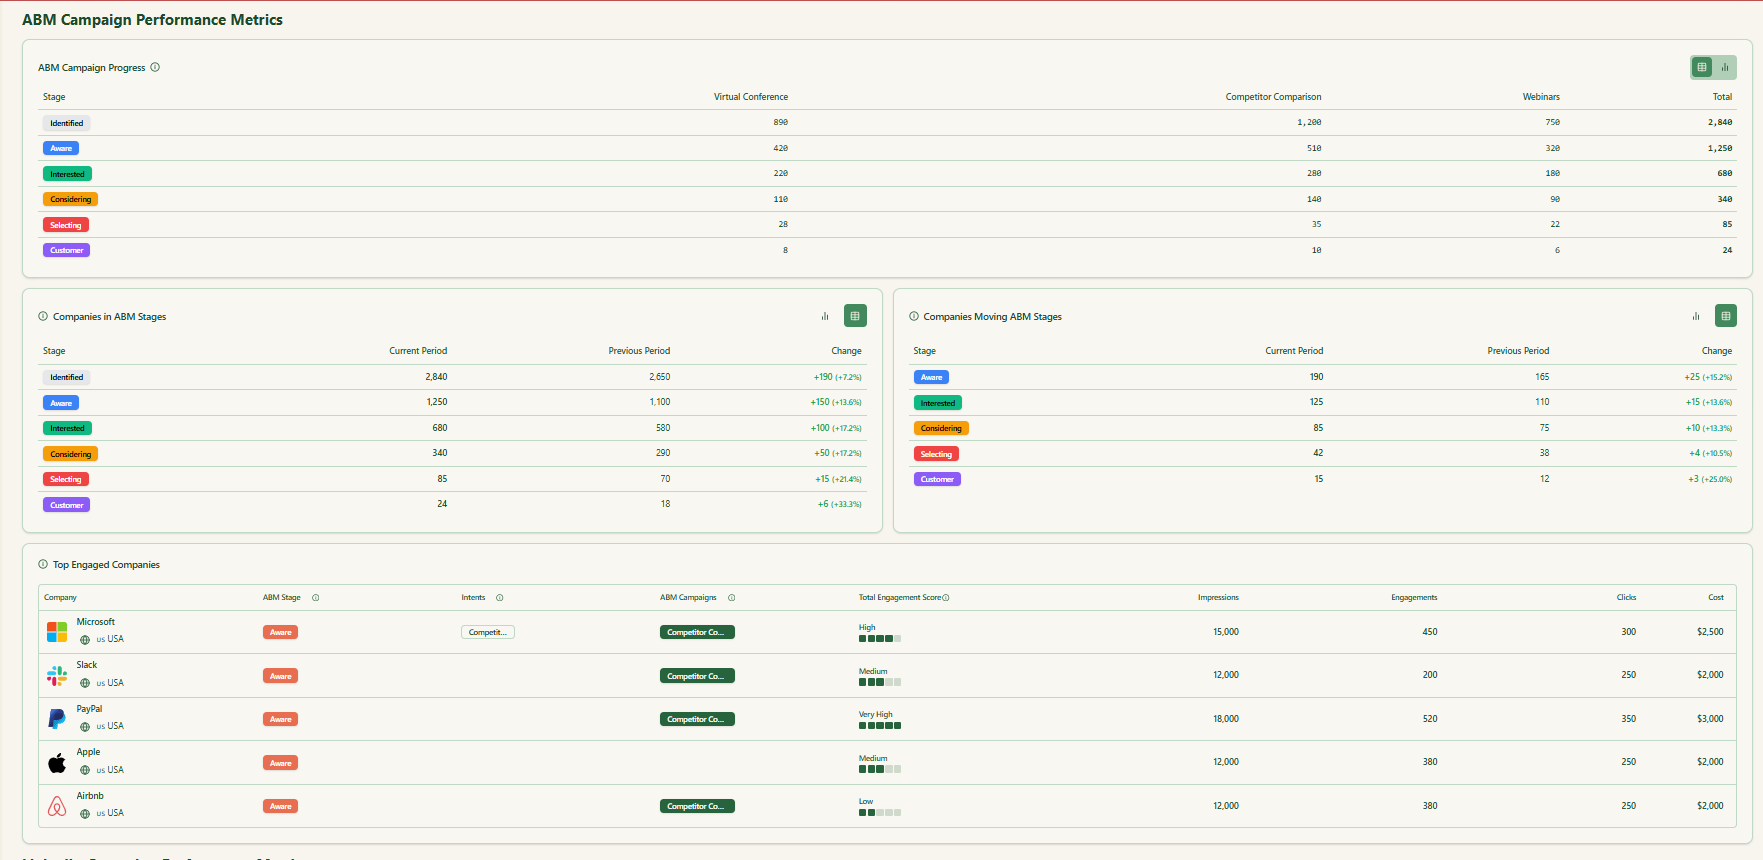
The platform automatically calculates an Engagement Score for each account based on the LinkedIn data (and you can bring in other channels too).
And the score is available for both ‘recent’ and ‘historic’ activity.
Also, this score updates in real time as new data comes in.
So if Acme Corp suddenly racks up a bunch of ad views and clicks this week, their score will surge accordingly this week, not a month later.
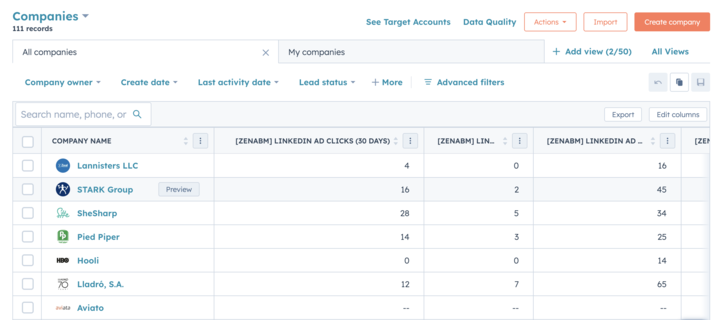
All of the LinkedIn metrics and the resulting scores are pushed to your CRM as company properties automatically, with no code or manual import.
For example, in HubSpot or Salesforce, you’ll have fields like “LI Impressions (Last 30d)”, “LI Clicks (Last 30d)”, and “ZenABM Engagement Score”. This sync is bi-directional and continuous.
What it means for users is that they can use these fields in whatever way they want inside the CRM: reports, list filters, workflow triggers, etc., just like any other property.
Essentially, ZenABM keeps the CRM in the loop with what’s happening on LinkedIn, bridging that gap automatically.
ZenABM doesn’t stop at scoring. It helps you act on the scores. We have built-in automation that will alert your sales team when an account hits a defined score threshold or stage. For instance, you might configure that once an account’s score qualifies it as “Interested” (say 20+ points), ZenABM flags it and can auto-assign that account to a BDR if it’s unowned.

Earlier, I mentioned the importance of knowing what an account is interested in.
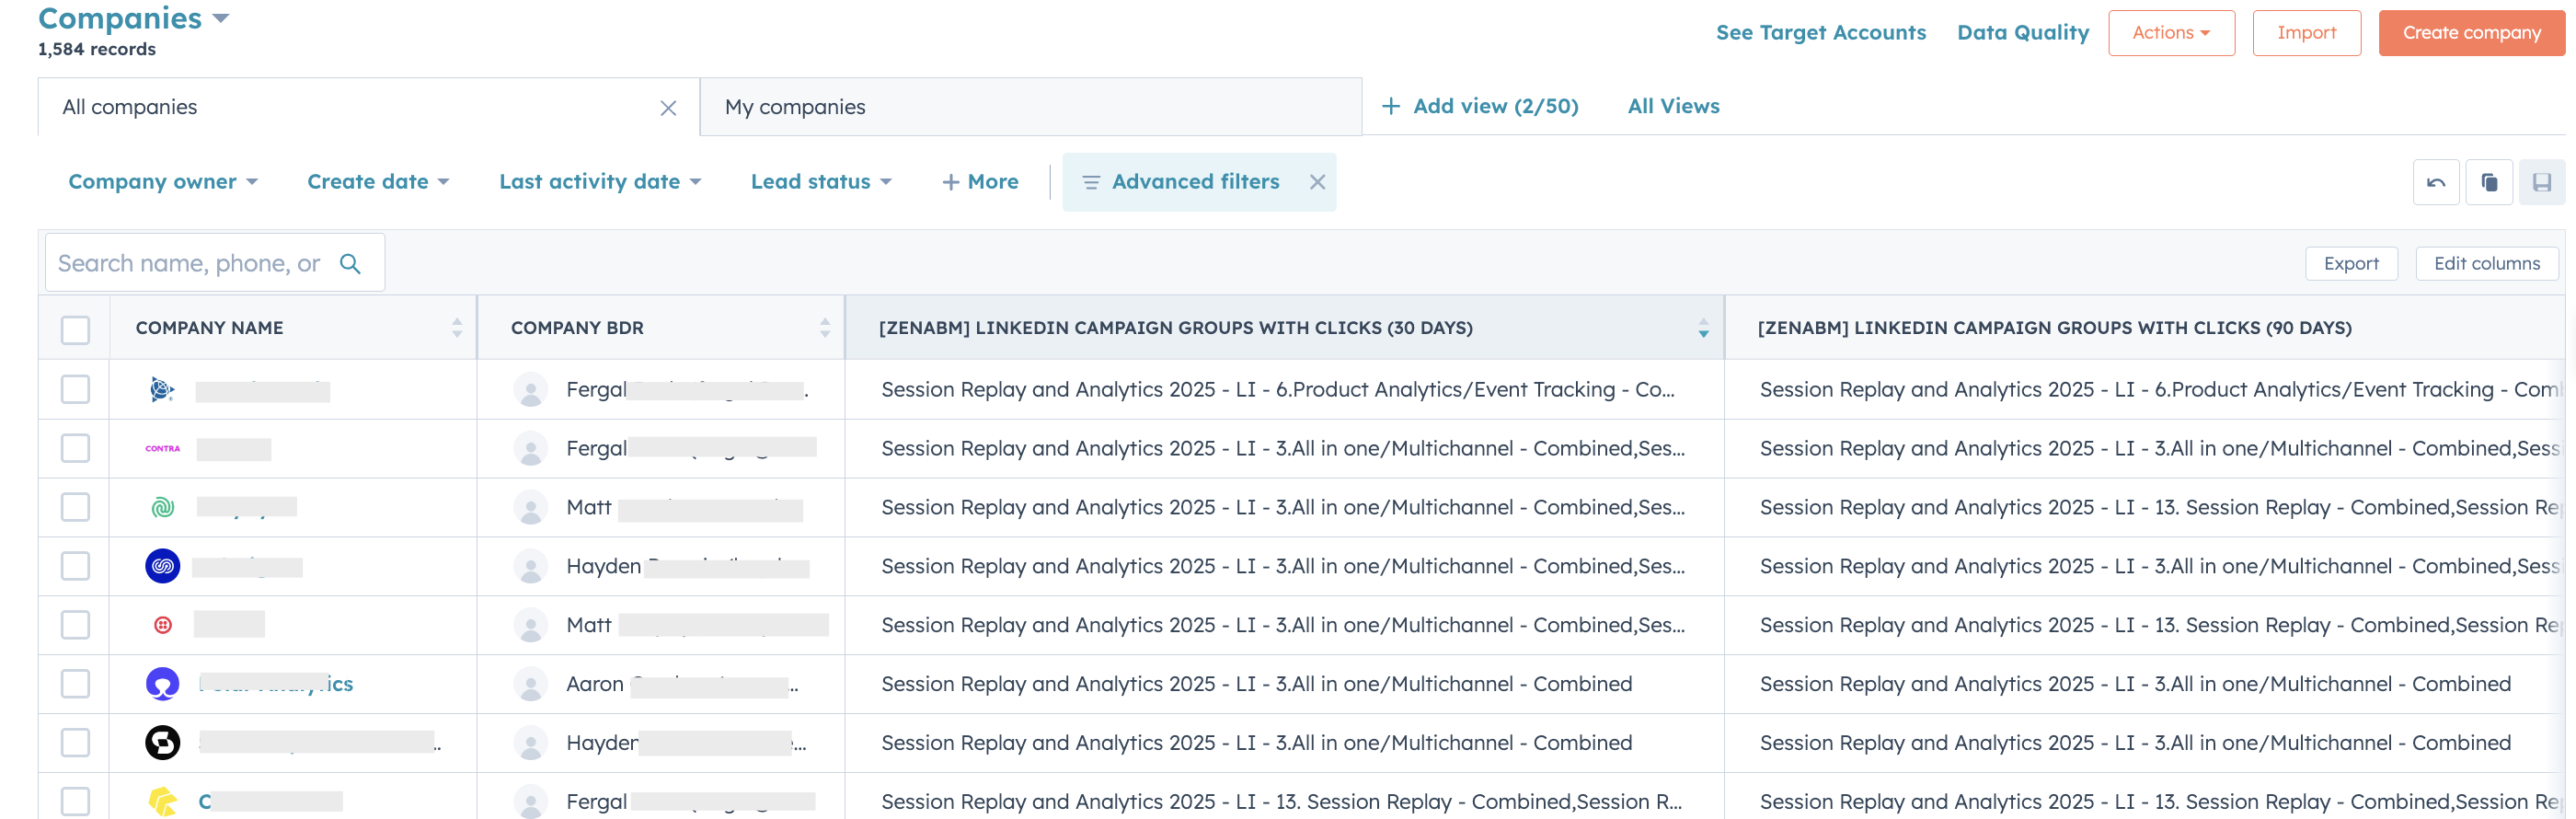
ZenABM addresses this by allowing you to tag each LinkedIn campaign or ad group with an intent topic or theme (e.g., product feature, solution area, pain point). The platform then groups engaged accounts by those intent tags. So if Acme engaged with two campaigns tagged “Cloud Security,” ZenABM will cluster Acme under that intent and even sync an “Interest: Cloud Security” flag to your CRM.
For your sales reps, this is a cheat code – they have talking points ready. “Ah, Acme has been engaging with our cloud security content. I’ll make sure to lead with that in my outreach.” This kind of insight is usually hard to get; reps often ask marketing, “What have they been looking at?” and with ZenABM, it’s plainly visible.
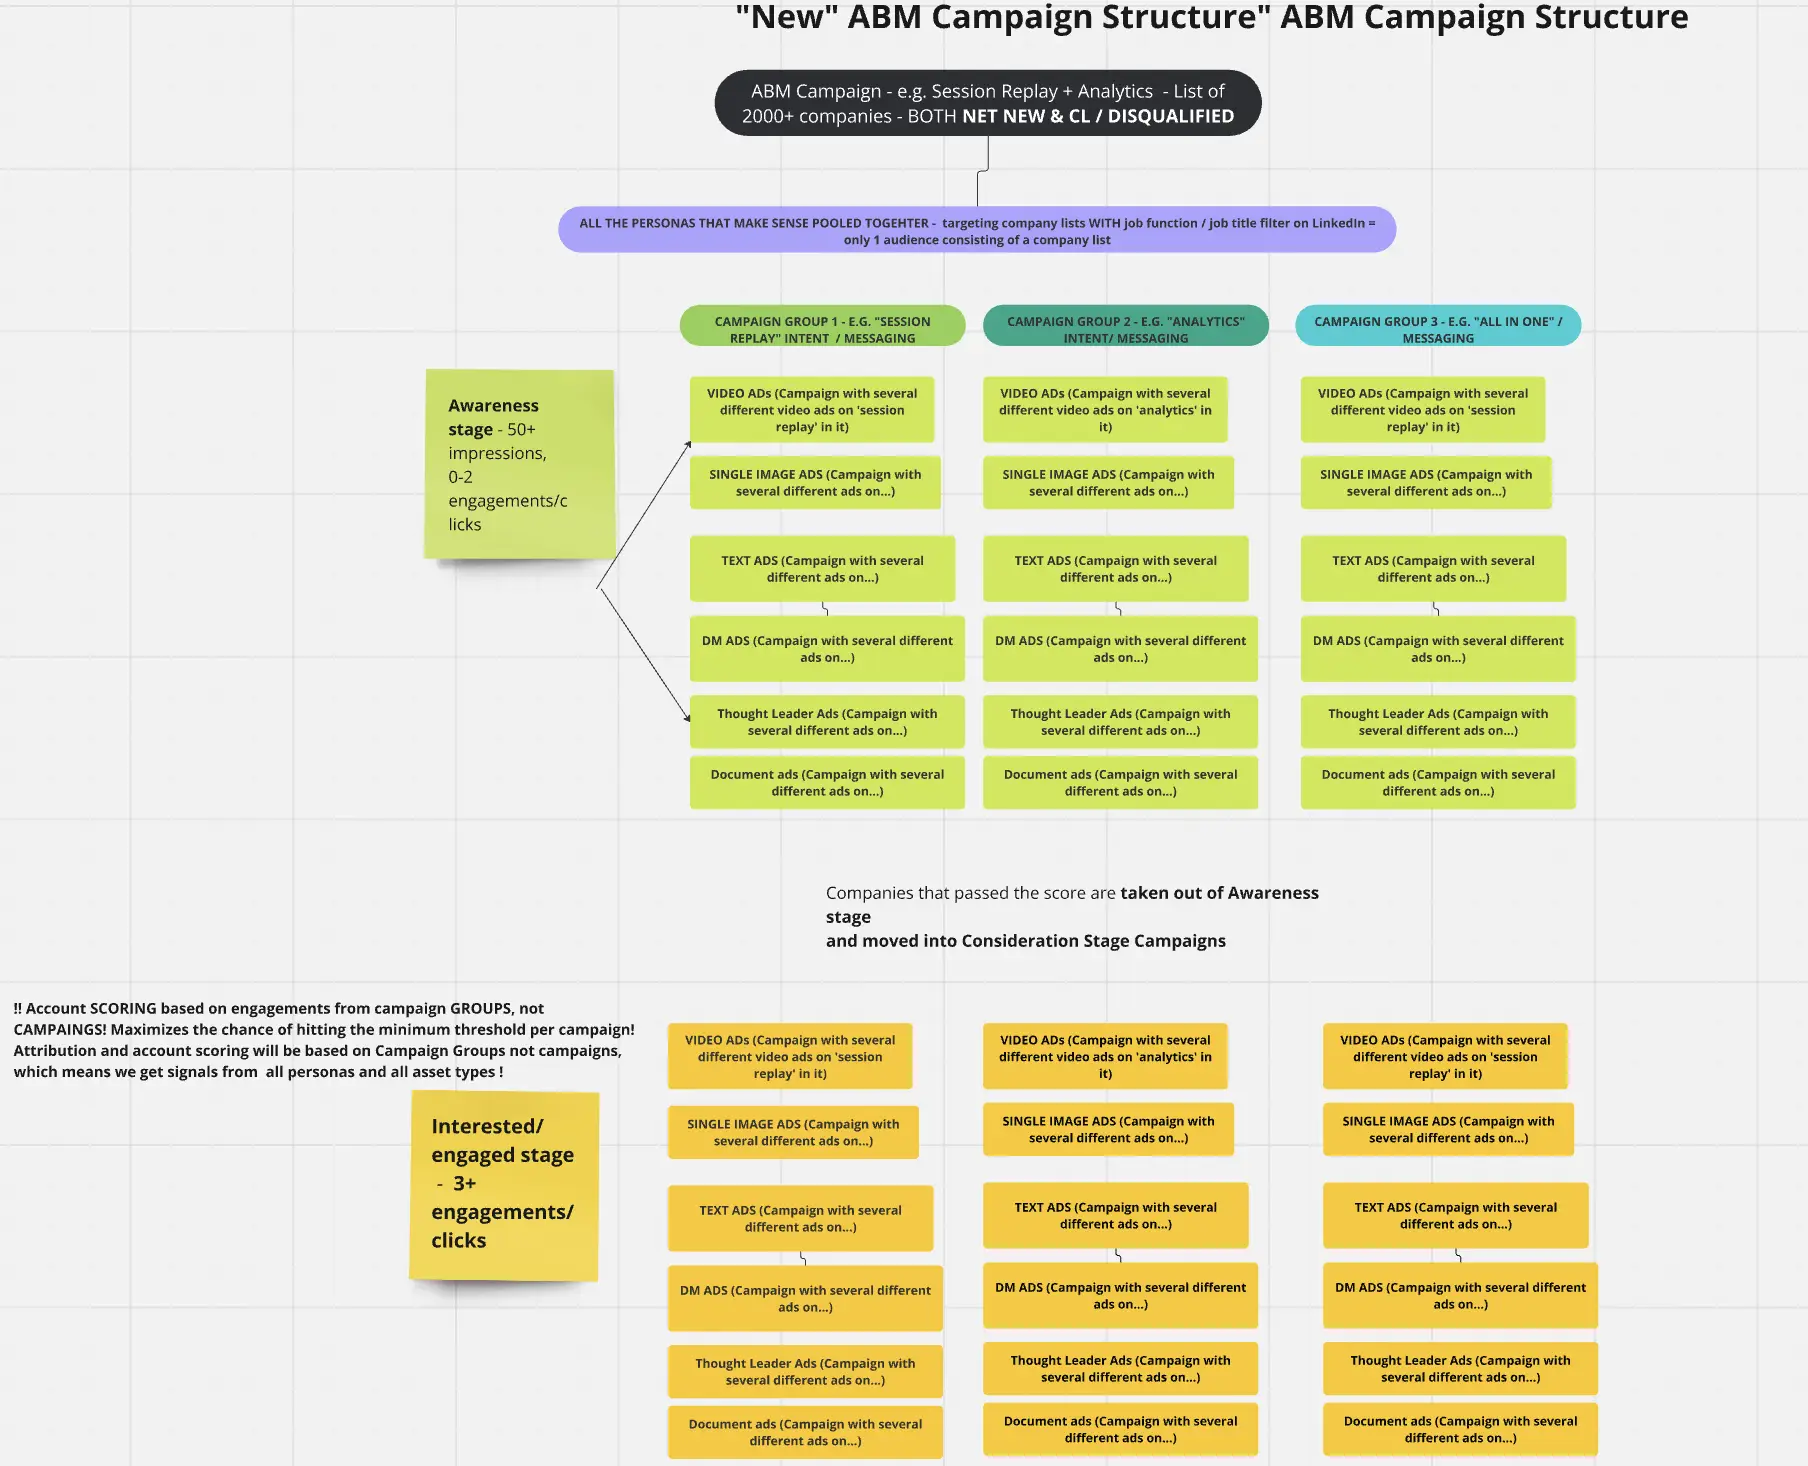
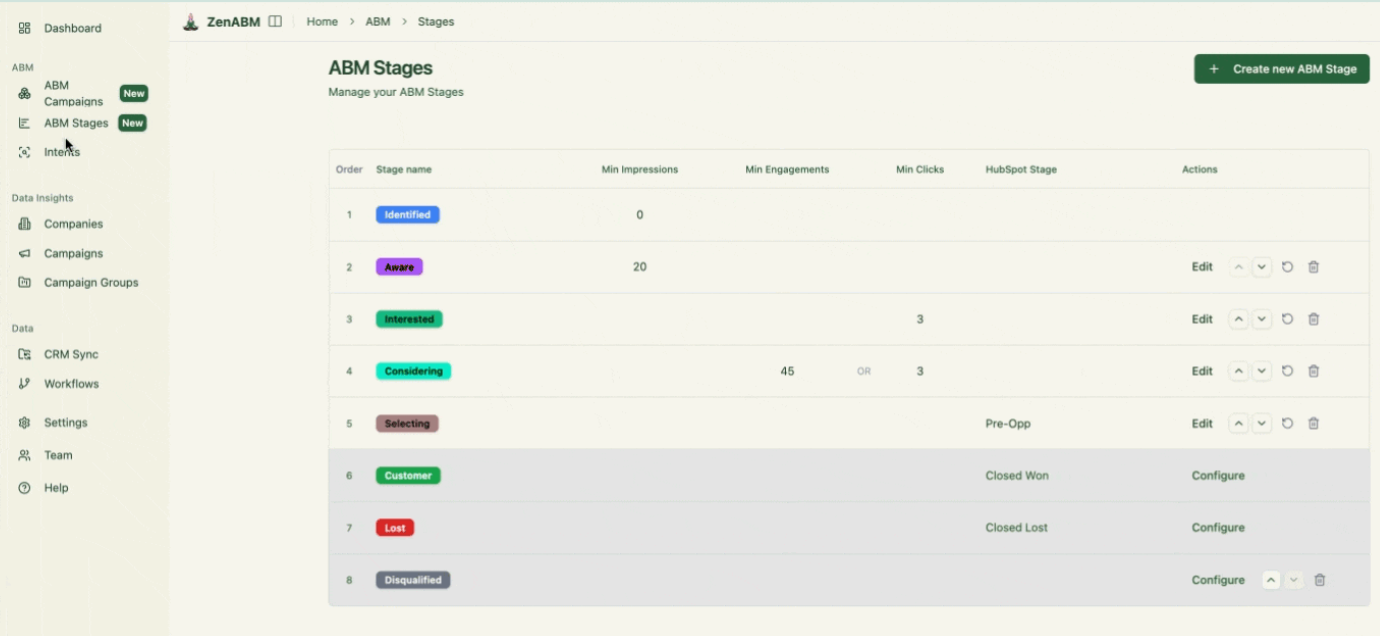
ZenABM uses a customizable engagement funnel (Aware, Interested, Considering, Selecting, etc.). It auto-classifies accounts from LinkedIn and CRM signals, advances them as engagement grows, and lets you set thresholds:
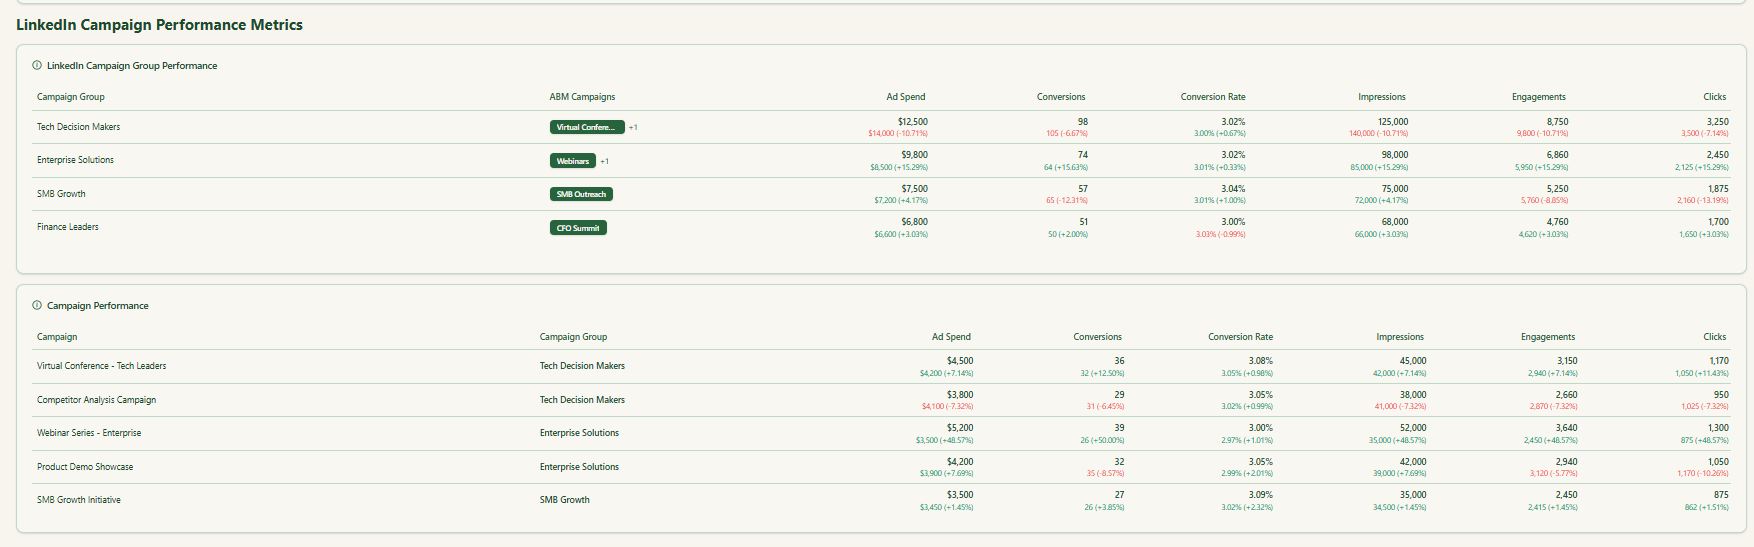
Since ZenABM ties into both LinkedIn and your CRM, it can connect the dots from ad spend all the way to revenue. On the reporting side, it will show you which accounts saw or clicked ads and later became opportunities or closed deals.
It basically performs the attribution analysis that we wish LinkedIn’s native tools did.
For instance, you can get a report like “$500k of pipeline was influenced by Campaign A” or “Campaign Group X sourced 10 opportunities.”
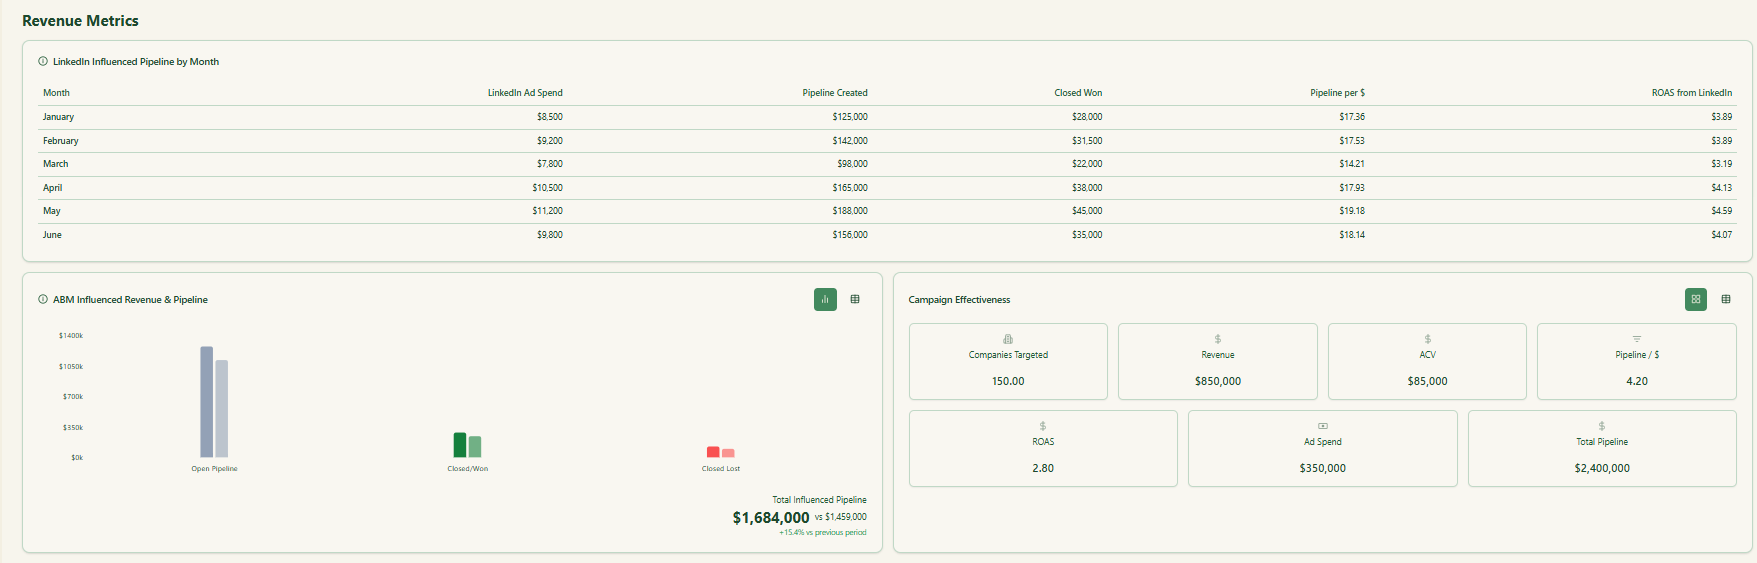
We’ve built dashboards that present metrics like Pipeline per Account, Pipeline per $ Ad Spend, ROAS (Return on Ad Spend), and top engaged accounts by stage.
All of this uses the underlying account-level data from LinkedIn combined with CRM outcomes. The benefit is that you not only score accounts for sales, but you also prove to leadership what your LinkedIn campaigns are doing in concrete terms (influencing pipeline or revenue).
LinkedIn ad analytics is buyer intel, not just ad math.
In ABM, every impression or click is an account-level signal.
Score it to prioritize who to engage, when, and with what. Lead-level metrics miss this; LinkedIn’s company-level data fixes prioritization.
Close the insight-to-action gap: wire the data, run a scoring model, and auto-alert sales when a target spikes.
Want account scoring using LinkedIn ad analytics out of the box?
Try ZenABM now for free or book a demo to know more!