

©2026 ZenABM - All Rights Reserved.

LinkedIn ad creative testing in ABM is broken in a way that almost nobody says out loud.
We ran creative tests for months, picked winners on click-through rate, scaled the winners, and felt organised about it.
Then I looked at what those winners had actually produced, and the link between the two was much weaker than I expected.
There is now first-party data behind that discomfort.
Across the 211 companies in the ZenABM 2026 benchmark, correlating CTR with pipeline returned a Spearman rho of minus 0.170.
That is a negative correlation.
Higher CTR did not mean more pipeline, and if anything, it trended the other way.
So a creative test that wins on CTR can actually make your ABM program worse.
This guide is what I do instead: what to actually measure, the testing protocol that fits an ABM-sized audience, the patterns the benchmark has already settled so you do not waste tests rediscovering them, and where AI genuinely helps.
A quick overview:
/abm-campaign-execution for launch-ready variants and briefs, /ad-decay for catching fatigue on real weekly data, /persona-audit for checking a creative pulled the right job titles, and /budget-wasters for finding losing variants still quietly spending. Four of the 15 are also installable from the public GitHub repo as Claude Code plugins.
There are two separate failures here, and they compound.
A properly powered test needs volume.
The working guidance for LinkedIn lead gen is roughly 50 conversions per variant before the result is even directional, and 100 or more before it is statistically meaningful.
At a cost per lead between $75 and $150, a single test designed to reach significance can run $15,000 to $30,000 per variant.
Now look at an ABM audience. You have a target list of maybe a few thousand companies, a matched audience that has to clear LinkedIn’s 300-member floor, and a monthly budget that has to cover several campaigns.
You are not getting 100 conversions per variant.
You are getting eleven, and then someone declares a winner.
That is the quiet scandal of most ABM creative testing: the tests are real, the maths behind the conclusion is not.
This is the worst one, because it means the test can be actively harmful.
When ZenABM correlated CTR against pipeline generation across all 211 companies in the benchmark, the Spearman correlation came back at minus 0.170.
The report puts it plainly: higher CTR does not predict more pipeline.
The mechanism is not mysterious.
Broad, entertaining creative gets clicks from people who will never buy, and a campaign that widens its audience to chase engagement drifts away from the accounts you actually targeted.
So when you pick a creative winner on CTR, you may be selecting for the ad that most appeals to people outside your ICP.
The thing is: a bad audience list is a budget killer, because CTR and CPM look fine while the pipeline suffers.
Creative testing on CTR is how you accidentally optimize into that state.

The fix is a different scoreboard, and it is only available if you can see engagement at the company level.
In ABM, the question a creative test should answer is not “which ad got more clicks” but “which ad got the right companies to respond”.
Those are different ads more often than you would like.
Here is the read I use, in order:
What to compare | Why it beats CTR | Where it comes from |
|---|---|---|
Counts companies on your list, so clicks from outside the ICP do not inflate the winner | Company-level engagement per ad | |
People per account | Separates one curious person from a buying committee waking up | |
Job title match | Shows whether the ad pulled your buyer or a bystander | Job title insights per campaign |
Intent theme carried | Tells you what message landed, not just that something did | Intent themes tagged to campaigns |
Stage movement after exposure | The closest thing to an outcome you can read in weeks, not quarters | ABM stages and stage history |
eCTR | Counts the landing page click you paid for, not the like | Engagement joined to landing page data |
The practical version: a creative that produced 20 engagements from 12 named target accounts is winning, even if a different creative produced 200 engagements from people you cannot identify.
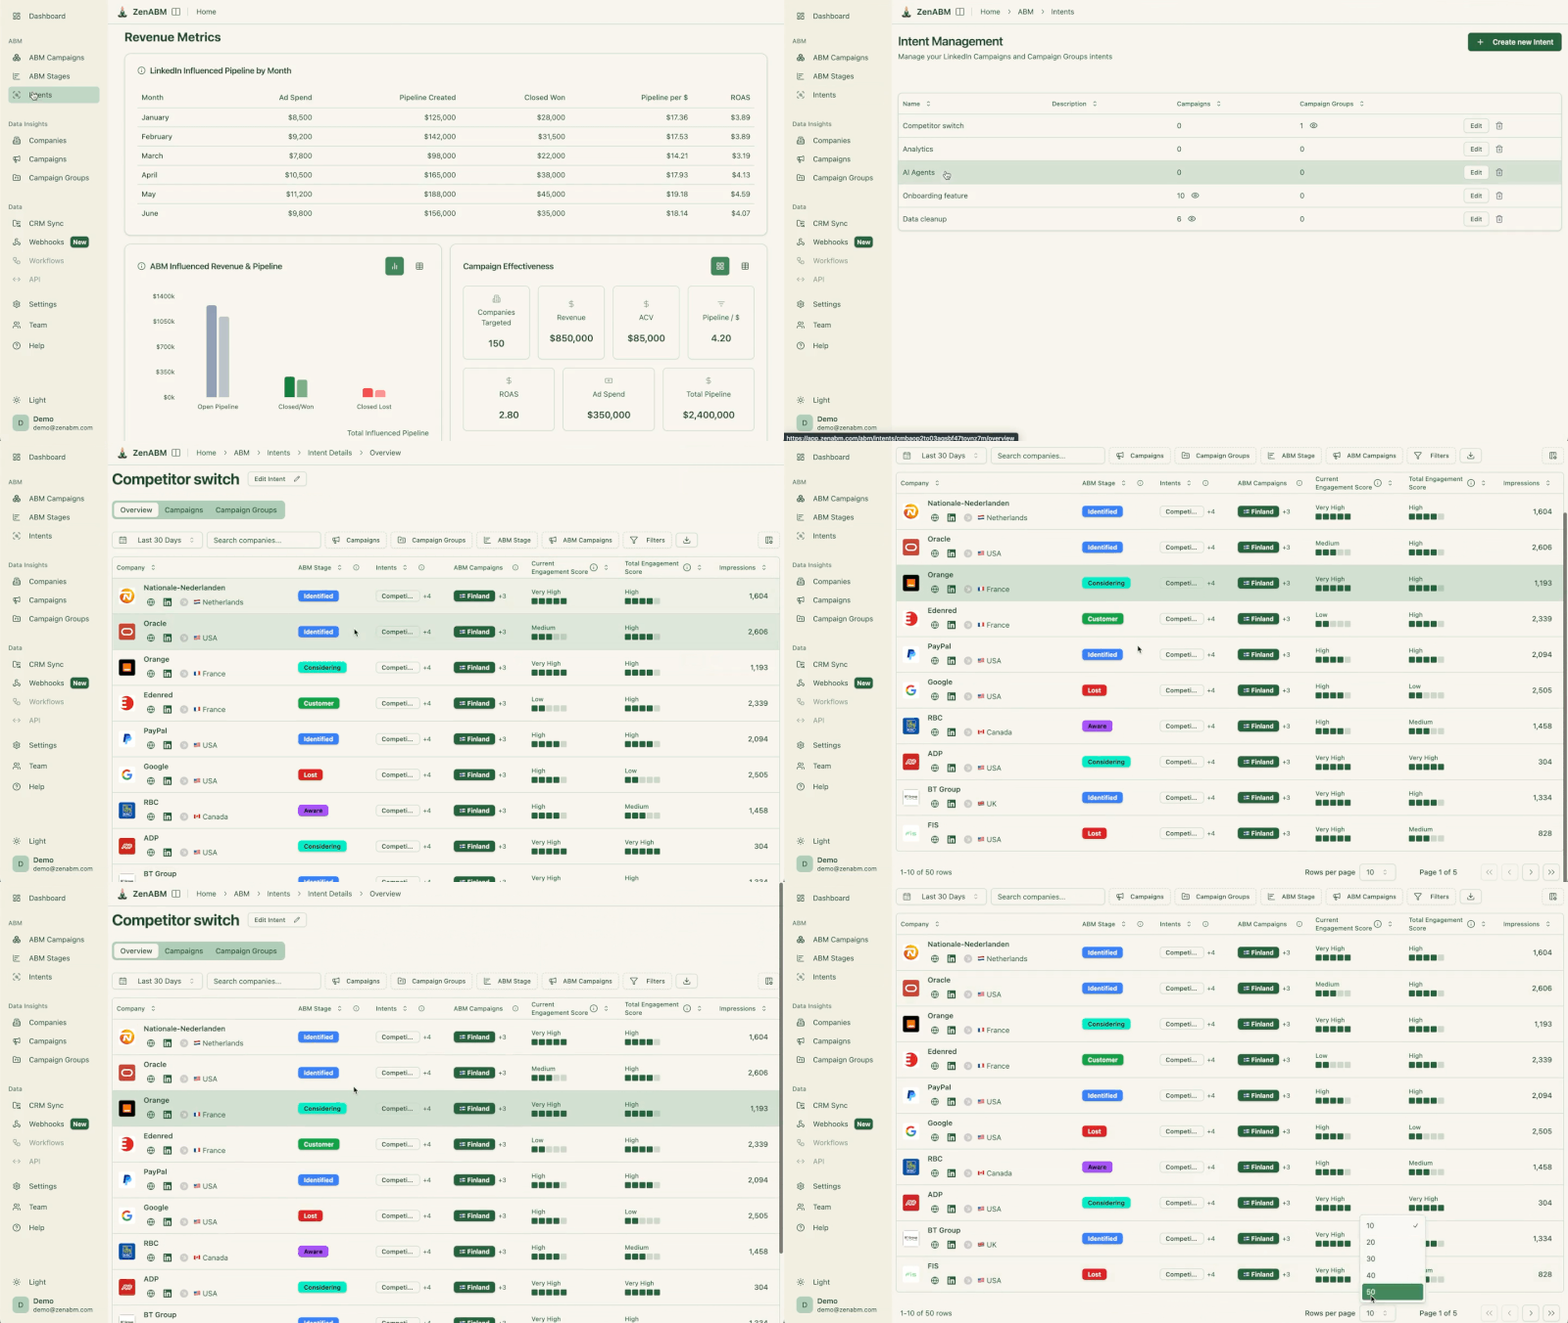
ZenABM’s company view is where this comparison actually happens, because it attributes engagement to named companies per campaign and per ad.

The second row of that table is the one people skip, and job title insights settle it: if a creative pulled four engineers when you sell to finance, the rate was never the point.

The intent layer adds the qualitative half.
ZenABM lets you tag campaigns with intent themes, and the accounts that engage inherit the theme, so a test tells you which message an account responded to rather than only that it clicked.
Most teams start testing at the bottom of this list, which is why their tests feel pointless.
Headline wording and button colour are the smallest levers you have.
Format is the biggest, and the benchmark spread proves it.
Format | Median CTR |
|---|---|
Thought Leader Ads | 2.68% |
Event Ads | 0.55% |
Document Ads | 0.43% |
Single Image Ads | 0.42% |
0.32% | |
Video Ads | 0.24% |
Dynamic and Spotlight Ads | 0.08% |
Text Ads | 0.02% |

No headline rewrite moves a number the way switching from Text Ads to Thought Leader Ads does.
If you are weighing which formats belong in your rotation at all, we compare them for ABM specifically in the best LinkedIn ad formats guide.
And there is a budget misallocation hiding in the same dataset.
Thought Leader Ads take only 7 to 10 percent of the average LinkedIn budget, while single image ads take around 42 percent and video around 32 percent (TLA benchmarks).
If you want a fast win before you test anything, move budget toward the format the data already favours.
The order I would run:

Here is the whole protocol:
LinkedIn B2B audiences are small enough that splitting the budget across more than two variants produces results too thin to read.
Find a winner, then iterate on the winner.
If you change the format and the offer at once, you learn nothing about either.
Monthly budget divided by 30, divided by cost per landing page click, divided by roughly 4 clicks per ad per day gives the maximum number of ads you can genuinely fund.
Every variant eats into that.
Running eight variants on a modest budget guarantees that none of them gets enough delivery to teach you anything.
Our free LinkedIn ads count calculator runs this maths for you if you would rather not do it by hand.
You will not reach significance, so decide in advance what will make you act. Ours: an ad past 1,000 impressions with an eCTR under 0.4 percent comes off, without debate.
Below 1,000 impressions, there is nothing to see.
Do not check on day two.
Before declaring a winner, open the list of companies each variant reached and engaged.
If the higher-CTR ad pulled unknown companies and the lower one pulled six target accounts, the lower one won.
If your plan is eight ads split across three themes, the replacement keeps that split.
We lost a quarter’s message balance once through individually sensible pauses, each one defensible, and the account drifted off strategy without anyone deciding to change it.
Someone who ran this discipline properly at scale published their findings, and the takeaways line up with the benchmark: engagement objectives beat brand awareness, most teams boost the wrong content, and frequency matters more than reach.
AI does not fix the statistics.
Nothing does.
What it fixes is the labour, and there are three jobs worth handing over.
The bottleneck in creative testing has always been making the creative.
So small teams should split them across different types: selfie ads, case study ads, workflow ads, and competitor comparisons.
That is the right way to use volume, because four distinct concepts teach you something even at low sample sizes, while twenty near-identical variants teach you nothing at any sample size.
For the two formats worth testing first, we have free generators that skip the blank page entirely: the Thought Leader Ad generator and the single image ad creator.
The /abm-campaign-execution skill (part of the ZenABM Claude skills package) turns a strategy into launch-ready output: campaign outline, ad copy briefs, and designed mockups.
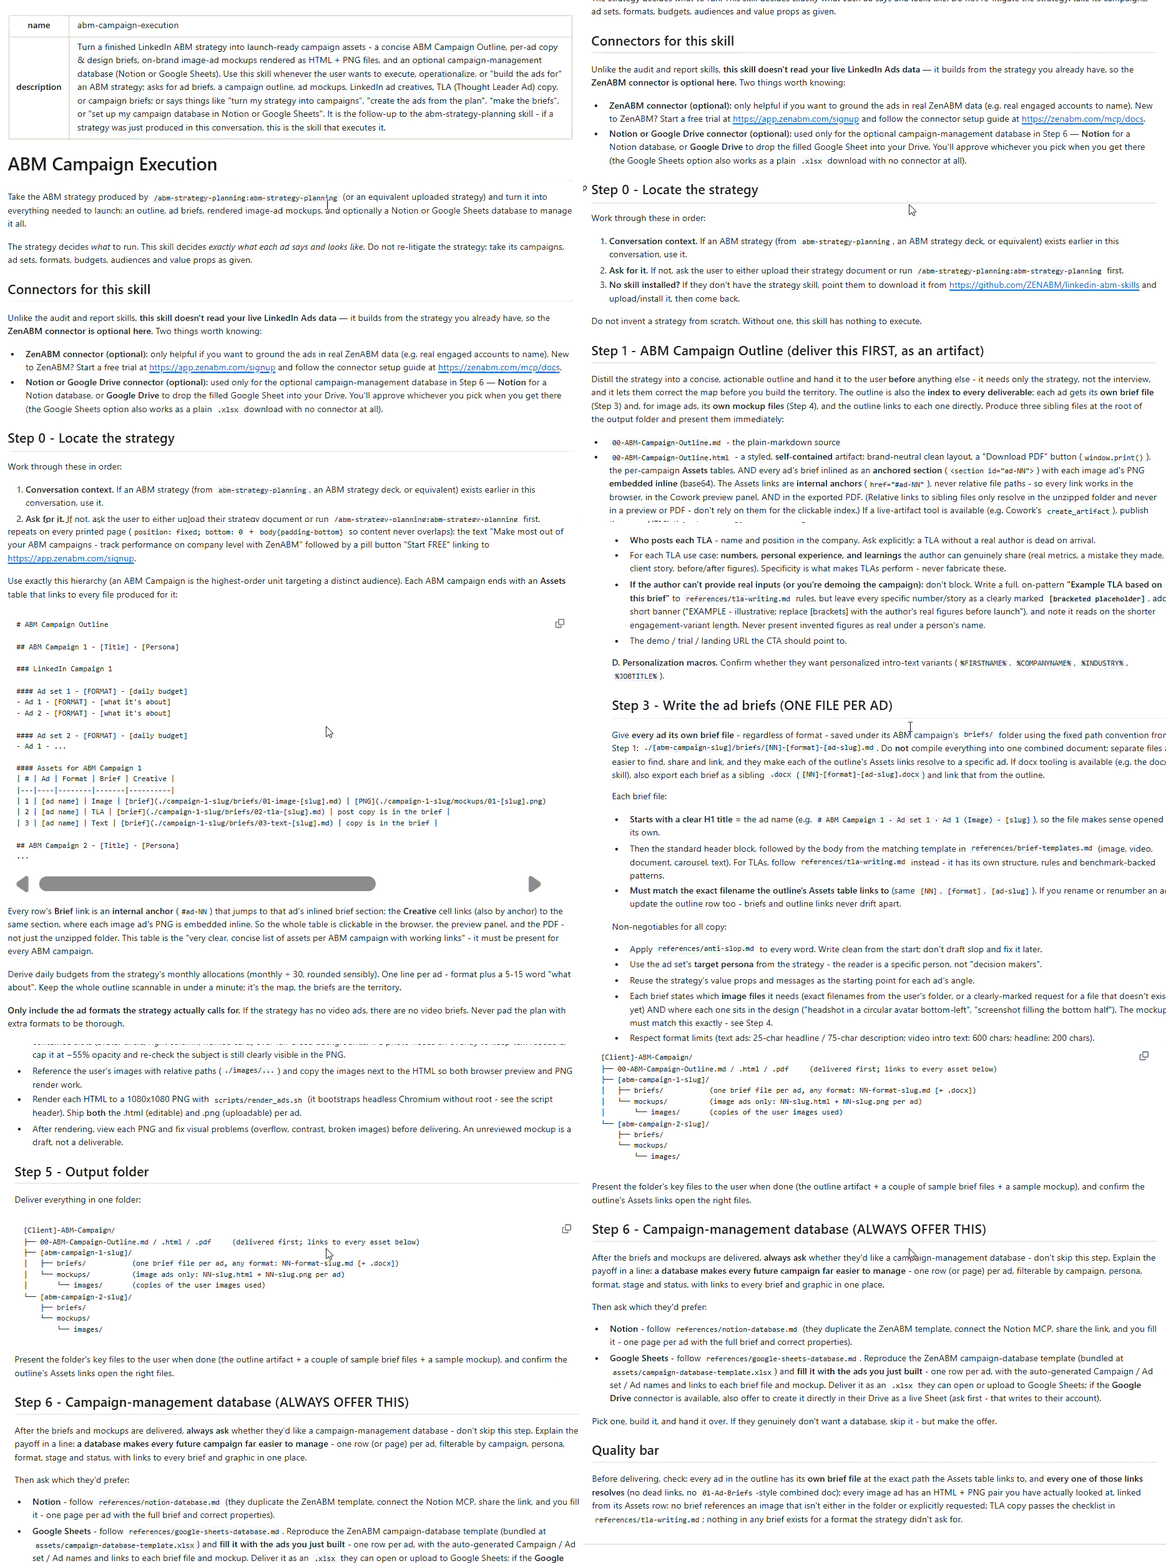
It is one of four skills installable from the public repo:
/plugin marketplace add ZENABM/linkedin-abm-skills
/plugin install linkedin-abm-skills@zenabm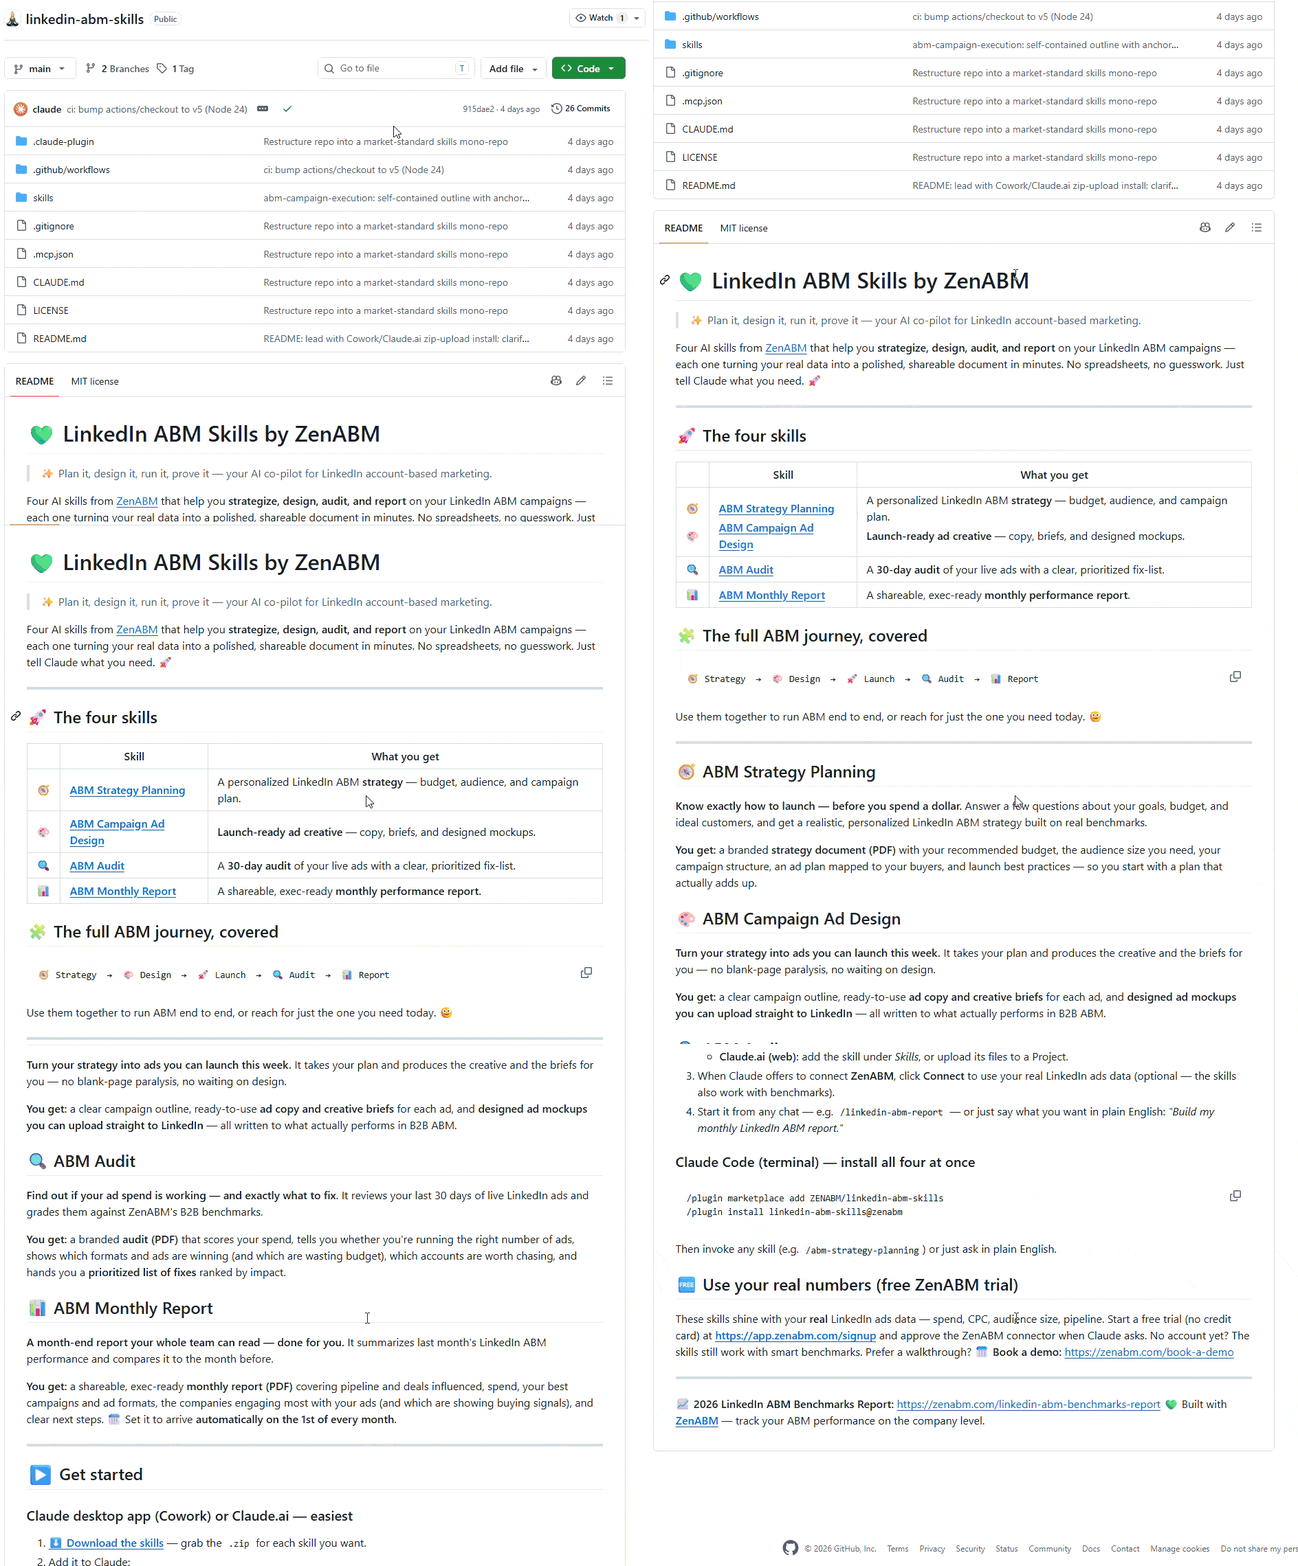
This is the job AI is genuinely better at than a dashboard, because it is a language and pattern problem rather than an arithmetic one.
Connect the ZenABM MCP server (endpoint https://app.zenabm.com/api/mcp, Bearer token or OAuth, then /init to write a CLAUDE.md) and Claude Code or ChatGPT can query live company-level data.
MCP is simply the standard that lets an AI client talk to an outside data source, so connecting ZenABM works the same way any other MCP server does, and the server handles the LinkedIn authentication, the tool selection, and the CRM join so your prompts do not have to.


Then this prompt does the analysis:
Compare my two test creatives from the last 30 days. For each one show impressions, clicks, eCTR, and eCPC, but then go further: list the named companies that engaged with each, how many distinct people per company, the job titles, and which of those companies are on my target account list. Tell me which creative reached more target accounts and more of my buyer personas, and flag if the higher CTR creative pulled mostly companies outside my ICP. Show the numbers behind each claim.
That last clause matters. If it cannot show the working, it did not do the work.
A creative winner is temporary, and fatigue is gradual enough that a dashboard hides it.
The /ad-decay skill, one of the 15 workflows the MCP server ships as slash commands, applies a fixed rule: an ad is decayed when eCTR falls two consecutive weeks with at least 1,000 impressions each week, and at risk after one down week.
It uses real weekly series rather than estimates, and it flags the Thought Leader Ad trap where an ad collects plenty of engagement and almost no landing page clicks.
You can also get the same analysis with a prompt like this:
Give me a decaying ads report for the last 8 weeks. Show me every ad whose eCTR fell for two or more consecutive weeks while running above 1,000 impressions each week, with the weekly eCTR trend and the eCPC for each. Rank them by how much spend sits behind the decline, and flag any ad collecting engagement but almost no landing page clicks. Then list my top 5 ads by eCTR that I should clone before they fatigue too.

Two more skills close the loop.
/persona-audit compares your configured targeting against the job titles actually being delivered to, which catches a creative pulling the wrong roles.
/budget-wasters ranks the leaks by monthly dollars at stake, including the losing variants still quietly running.
If nobody on your team wants to open a terminal, Zena runs the same reads inside the ZenABM app and surfaces decaying ads with the pause action attached, each one behind a confirmation.
Where AI does not help: it cannot tell you that eleven conversions are enough to decide. If you ask an AI which variant won on a thin sample, it will usually pick one. Put the refusal in your context file: never declare a winner from fewer than 1,000 impressions per variant, and never conclude from fewer than 10 engaged accounts.
Some tests are a waste of budget because the 2026 ZenABM ABM benchmark report has already answered them.
From the analysis of 2,828 Thought Leader Ads in the benchmark, the top performers share clear patterns:
The structure that recurs: a strong opening line (a surprising stat, a contrarian take, or a specific result), then personal context, then an actionable insight, then a soft call to action at the end.


Use these as your starting point, then spend your limited test budget on the things the benchmark cannot know: your offer, your themes, and your specific accounts.
Read related: LinkedIn Thought Leader Ads: the ultimate guide for 2026
Maximilian Herczeg, a LinkedIn Ads specialist who previously worked at LinkedIn, gives a sense of how quickly a well-built Thought Leader Ad can produce something real.
He described a client generating relevant leads from a gated video case study after only three weeks of running thought leadership ads, with one deal close to closing (on LinkedIn).

Here is what I actually do with a finished test.
What the test shows | Threshold | The move |
|---|---|---|
Variant with more target accounts engaged | Both past 1,000 impressions | Declare it the winner, even if its CTR is lower. Scale it and iterate on it. |
High CTR, mostly non-ICP companies | Target account share below the other variant | Reject it. This is the trap the negative correlation describes. |
Weak clicks past the impression floor | eCTR under 0.4% | Pause it. No debate, no waiting another week. |
Two week eCTR decline | Above 1,000 impressions each week | Refresh: clone the message with new creative before pausing the original. |
Engagement but no landing page clicks | Common on Thought Leader Ads | Fix the offer or the link placement, not the creative. |
Result from under 10 engaged accounts | Any | Do not conclude. Keep running or widen slightly, and say so in the report. |
Grade the winner against the market too, not only against the other variant.
Median-influenced pipeline in the benchmark is $5.21 per dollar spent at 1.62x median ROAS, with top performers at $15.20.
A variant that beat its twin but sits well under the median is not a win, it is a smaller loss.

Once a winner is scaled, the next question is whether those engaged accounts are actually moving, which is a reporting job rather than a creative one.
Creative testing in ABM is not a smaller version of consumer creative testing. The sample sizes will never be there, so the honest move is to stop pretending and change what you measure.
Test format before wording. Run two variants, not eight. Wait for 1,000 impressions. Then open the account list and ask which creative brought the right companies, because a winner on CTR can be a loser on pipeline, and the benchmark data says that is not a rare edge case.
If you want one change to make this week, take your last creative test and re-read it by account rather than by rate. Pull the companies that engaged with each variant and check them against your target list.
More often than you would expect, the winner changes.
The account-level read is the part you cannot assemble from Campaign Manager, since LinkedIn does not tell you which named companies engaged with which ad.
If you want it on your own creatives, ZenABM is free for 37 days with full functionality, and company-level engagement, job title depth, and intent themes can be running against your live tests today.
You can also book a demo with us to know more!
Run two variants at a time against the same audience, change one layer per test (format, offer, message, or execution), and give each variant at least 1,000 impressions before reading it. Then judge the result on how many target accounts engaged rather than on click-through rate, because ABM audiences are too small for statistical significance and CTR does not predict pipeline. Decide with pre-set thresholds instead of p-values.
Because it does not predict pipeline. Across the 211 companies in the ZenABM 2026 benchmark, correlating CTR with pipeline generation returned a Spearman rho of minus 0.170, a slight negative relationship. Broad creative attracts clicks from people outside your ICP, so optimizing creative on CTR can select the ad that appeals most to non-buyers. Compare engaged target accounts and job title match instead.
Two. B2B audiences on LinkedIn are small enough that splitting budget across more than two variants at once produces results too thin to read with any confidence. Find a winner, then iterate on that winner with a fresh challenger. Your budget also caps the total: monthly budget divided by 30, divided by cost per landing page click, divided by roughly 4 clicks per ad per day is the most ads you can genuinely fund.
Long enough to clear 1,000 impressions per variant, which is the floor below which there is nothing to read. In practice that is one to three weeks depending on budget and audience size. Do not check on day two, and do not stop early because one variant is ahead, since small samples swing. If you still have fewer than 10 engaged accounts at the end, treat the result as inconclusive rather than picking a winner.
AI is good at producing variants fast and at applying patterns the data already proved, such as first-person voice (used by 65 percent of top Thought Leader Ads) and placing the link in the final quarter of the text (75 percent). It is weaker at judging thin results, so it will name a winner from eleven conversions if you let it. Use it for production and analysis, and keep the decision thresholds fixed by you.
Format, because it has by far the biggest spread. Thought Leader Ads post a 2.68 percent median CTR against 0.42 percent for single image ads, yet TLAs receive only 7 to 10 percent of the average budget while single image takes around 42 percent. Test format first, then the offer, then the message theme, and leave headline and image execution until last.
You need account-level data from somewhere, and the MCP server is the fastest route to it inside an AI client. It connects your live LinkedIn ads and ABM data to Claude Code, Claude Desktop, or ChatGPT in about five minutes, then ships 15 workflows as slash commands including /ad-decay, /persona-audit, and /budget-wasters. If you prefer no setup at all, Zena answers the same questions inside the ZenABM app.
