

©2026 ZenABM - All Rights Reserved.

LinkedIn ABM reporting goes wrong in a way that is hard to see because the reports look fine.
For a long stretch of our program, I was reporting on ads and calling it ABM reporting.
Impressions, CTR, cost per click, best-performing creative – all accurate and well presented.
Then someone asked how many of our target accounts had actually moved that quarter, and I could not answer without a day of manual work.
That is the gap.
Ad reporting asks which creative won, while ABM reporting asks whether the accounts you care about moved toward revenue.
They use a different unit (the account, not the ad), they answer to different people, and they run on different clocks.
This guide is the workflow I use now: four reporting loops with four artifacts, the order to report things in, the prompts for each loop, and the honesty rules that stop an AI from overstating what your data can prove.
A quick overview:
The trap is that ad metrics are easy to get and feel like progress.
Campaign Manager hands you CTR, CPM, and spend for free, so that is what gets reported.
The problem is that those numbers can stay perfectly healthy while the program slowly fails.
A bad audience list, especially, acts as budget killers on LinkedIn because your CTR and CPM will not drop when your list is wrong, but your pipeline will.
You can run a beautiful campaign to entirely the wrong companies, and the ad dashboard will congratulate you the whole time.
So the first move is changing the unit.
Every ABM report rolls up to named accounts, and here are the five questions that ad reporting cannot answer:
Answering those needs company-level engagement joined to your CRM, which is exactly what ZenABM pulls from the LinkedIn Ads API and matches against deals.

To be clear, ad reporting still matters.
You need to know which creative is decaying and which format buys the cheapest landing page click.
That work has its own dedicated guide: How to automate LinkedIn ads reporting with AI
This guide sits one level above it, on the accounts.
The single biggest structural fix I made was to stop trying to write one report that served everyone.
A BDR, a campaign operator, a CMO, and a board do not want the same document, and a report that tries to satisfy all four satisfies none of them.
So the workflow runs as four loops on different clocks.
Loop | Reader | The question it answers | The artifact and the skill |
|---|---|---|---|
Daily triage | BDR or AE | Who should I contact today, and what do I open with? | A scored call list with a talking point per account. |
Weekly operator | You, running the program | What is leaking, what is decaying, what needs fixing this week? | A prioritized fix list. |
Monthly executive | CMO or founder | Did accounts move, and what pipeline came of it? | A branded recap document. |
Quarterly program | Leadership and board | Is this motion working, and should we fund more of it? | A structural review with a plan. |
The reason to separate them is not tidiness.
It is that mixing them causes real damage.
Put weekly operational details in a board deck, and leadership starts managing your creative rotation.
Put quarterly strategy language in a BDR handoff, and nobody calls anyone.
Each loop gets its own cadence, its own artifact, and its own level of detail, and the same underlying data serves all four.
Here is the ordering rule that took me too long to learn: report the funnel in the order the data becomes trustworthy.
Coverage sits at the top because every percentage underneath is calculated against it.
If you do not know that you reached 300 of your 1,000 target accounts, then “40 percent engaged” is a meaningless number, because engaged out of what?
So the reporting order runs:
Timing matters as much as order.
Coverage and engagement produce a readable signal in roughly 30 to 60 days, while pipeline needs roughly 60 to 120 days before the numbers mean anything.
If your program is eight weeks old and someone asks for the ROAS, the honest answer is that the sample is not ready.
Report coverage and engagement, say plainly why the pipeline is not yet meaningful, and give the date it will be.
On depth, Kathleen Bunshoft, a B2B paid social consultant, recommends auditing your setup for audience penetration above 40 percent alongside frequency, so you can be confident you are reaching enough of your buyers often enough (on LinkedIn).
Penetration is a coverage metric, and it belongs near the top of the report rather than buried under creative performance.
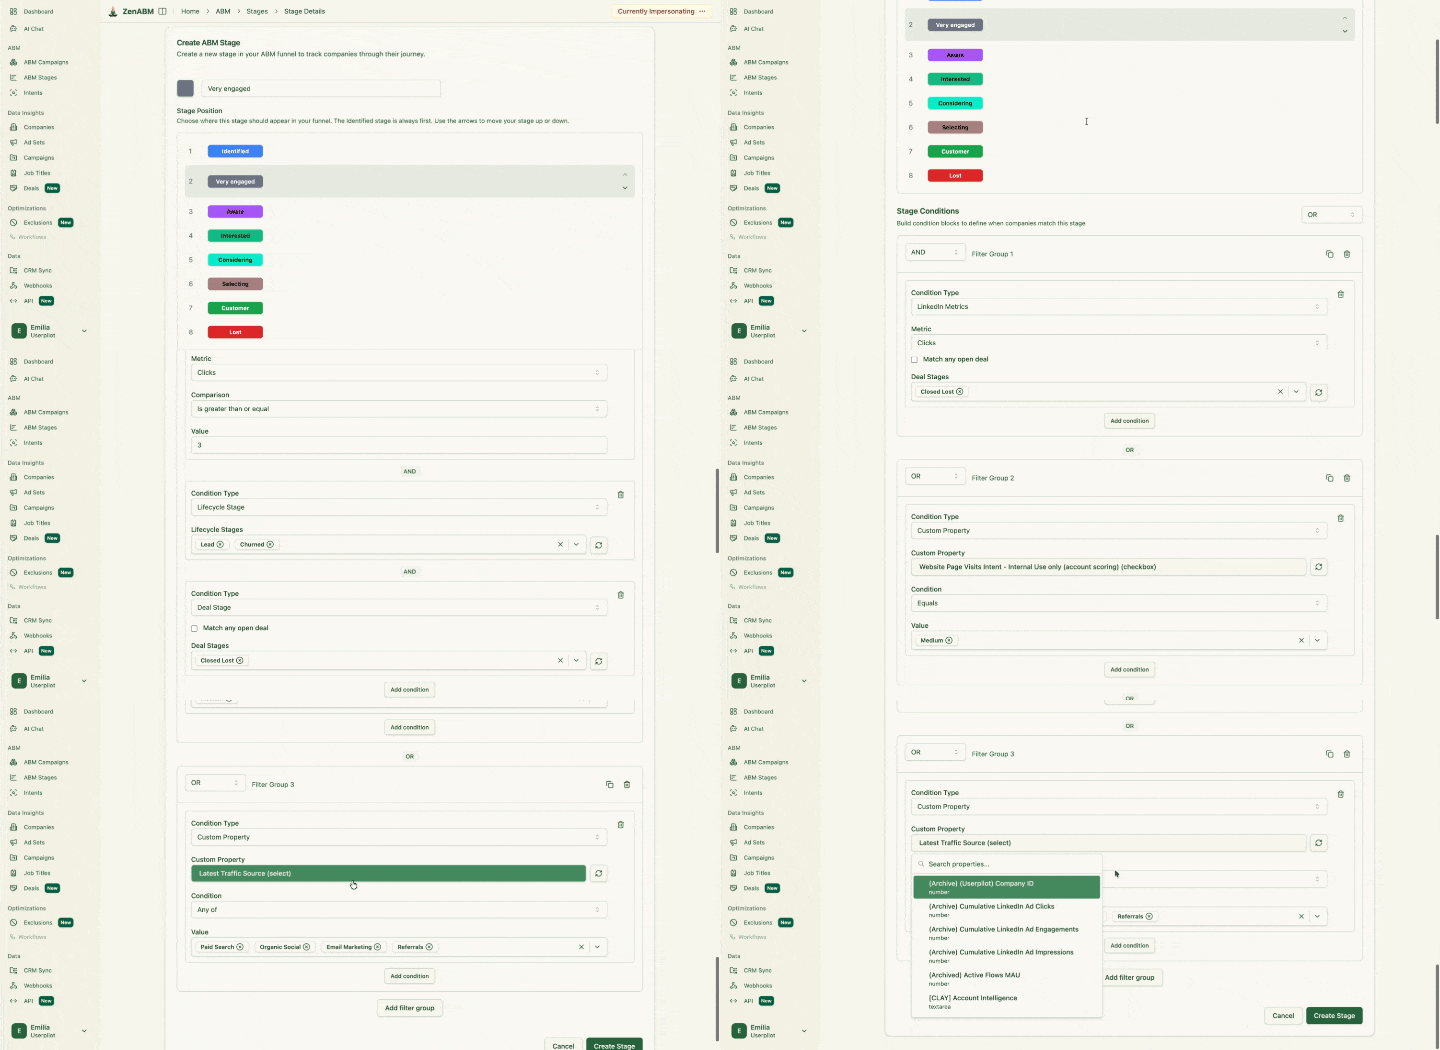
ZenABM’s stage view is where movement gets read because it shows the account counts sitting at each step.


If you want the metric definitions rather than the workflow, we cover those separately in a dedicated guide: ABM KPIs: the metrics that actually predict pipeline
Most people set up the data connection and stop.
That is why their AI reports drift week to week.
The connection runs through the ZenABM MCP server.
MCP is the standard that lets an AI client query an outside data source, so Claude Code, Claude Desktop, or ChatGPT can read your live ABM data.
The endpoint is https://app.zenabm.com/api/mcp, authenticated with a Bearer token or OAuth.

The ZenABM MCP server exposes data tools covering company intelligence, campaign and ad set performance, ABM stages and stage history, intent themes, job titles, deals, live delivery settings, reach and frequency, and weekly rolling series.


On top of those sit 15 skills as slash commands, which are the workflows the four loops use.
Juan Esteban Moncada, who built a custom MCP server for LinkedIn Ads at Understory, framed why this pattern spread so fast.
“It’s quickly becoming the backbone of Agentic AI.” Juan Esteban Moncada, Understory, on LinkedIn

A connection gives the AI data.
A context layer gives it your definitions, and without it, every report is a slightly different report.
Run /init in Claude Code to write a CLAUDE.md, then fill it with the things your team has already agreed:
Add these ABM reporting defaults to CLAUDE.md. Our ICP is B2B SaaS, 200 to 2000 employees, North America and Western Europe. Our target account list is 1,200 companies. Stage thresholds: Aware at 50 or more impressions, Interested at 5 or more clicks or 10 or more engagements, Considering at a demo or trial, Selecting at an open deal. Always report coverage before engagement, and engagement before pipeline. Always state the account count behind any percentage. Never report a conclusion from fewer than 10 accounts. Treat any ad above 1,000 impressions with a two week eCTR decline as decaying.
This is the difference between an assistant and a reporting system.
The practical payoff is boring and valuable: a teammate who opens the same folder produces the same report you would.
Each loop gets one saved prompt.
Save them as slash commands so the routine is one line.
Give me today’s call list. Find accounts that moved stage in the last 7 days, showed fresh intent, or had an engagement spike against their own prior 30 day average. Only include accounts matching my ICP. For each, show the company, current stage, what changed, the intent themes, and one opening line a rep can use that references something the account actually did. Cap the list at 10 and sort by urgency.
The cap matters.
A call list of 40 accounts is a list nobody works.
The packaged version is /sales-handoff, which scores by stage moves, fresh intent, and engagement spikes and attaches a talking point drawn from each account’s real journey.
Run my weekly ABM operator review. Report in this order: target account coverage and how it changed, accounts engaged this week including first time engagers, stage movement with anyone who stalled past the average time in stage, then leaks (ad sets with high spend and low eCTR, accounts taking impressions without engaging, and any ad with two consecutive down weeks above 1,000 impressions). End with a prioritized fix list where every line is a specific action. State the account count behind every percentage.
Three skills cover this ground: /weekly-digest gives a stakeholder headline plus operator detail, /budget-wasters ranks the leaks by monthly dollars at stake, and /ad-decay applies the decay rule using real weekly series rather than estimates.
/linkedin-abm-audit is the fuller monthly version of the same job, producing a scorecard, format grading against benchmarks, and a red and green flag fix list.
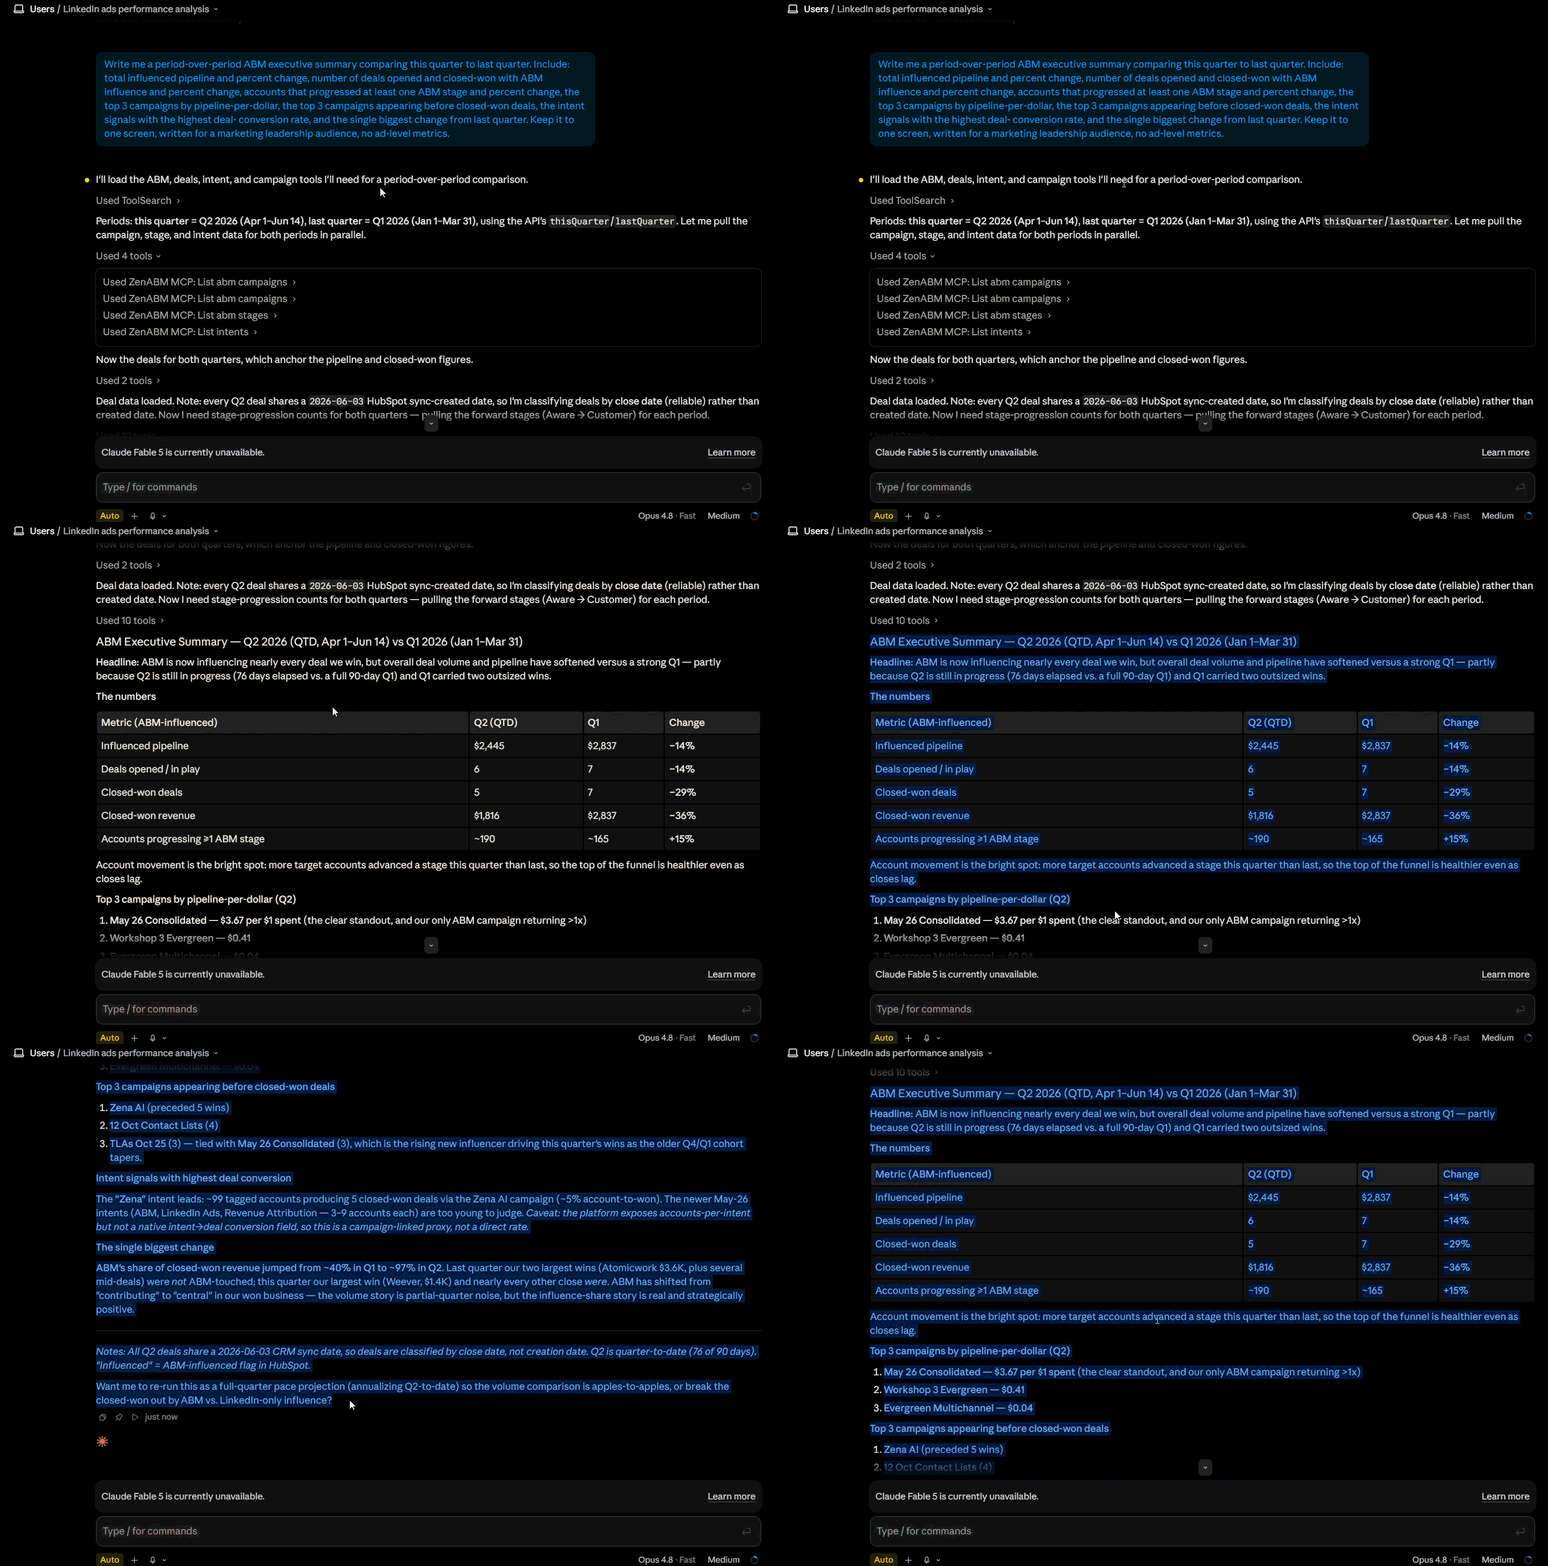
Write my monthly ABM executive report. Cover: spend, target account coverage, accounts engaged, stage movement by transition, opportunities created from engaged accounts, influenced pipeline deduplicated, pipeline per dollar spent, and ROAS. Compare each to last month with the percent change and the absolute numbers. Then write a short narrative naming what drove the biggest changes, what is a real trend versus noise, and the top three risks. Keep it to one page a CMO would actually read.
The result when I ran a similar prompt:
/linkedin-abm-report is the packaged version and outputs a branded document you can forward without editing.
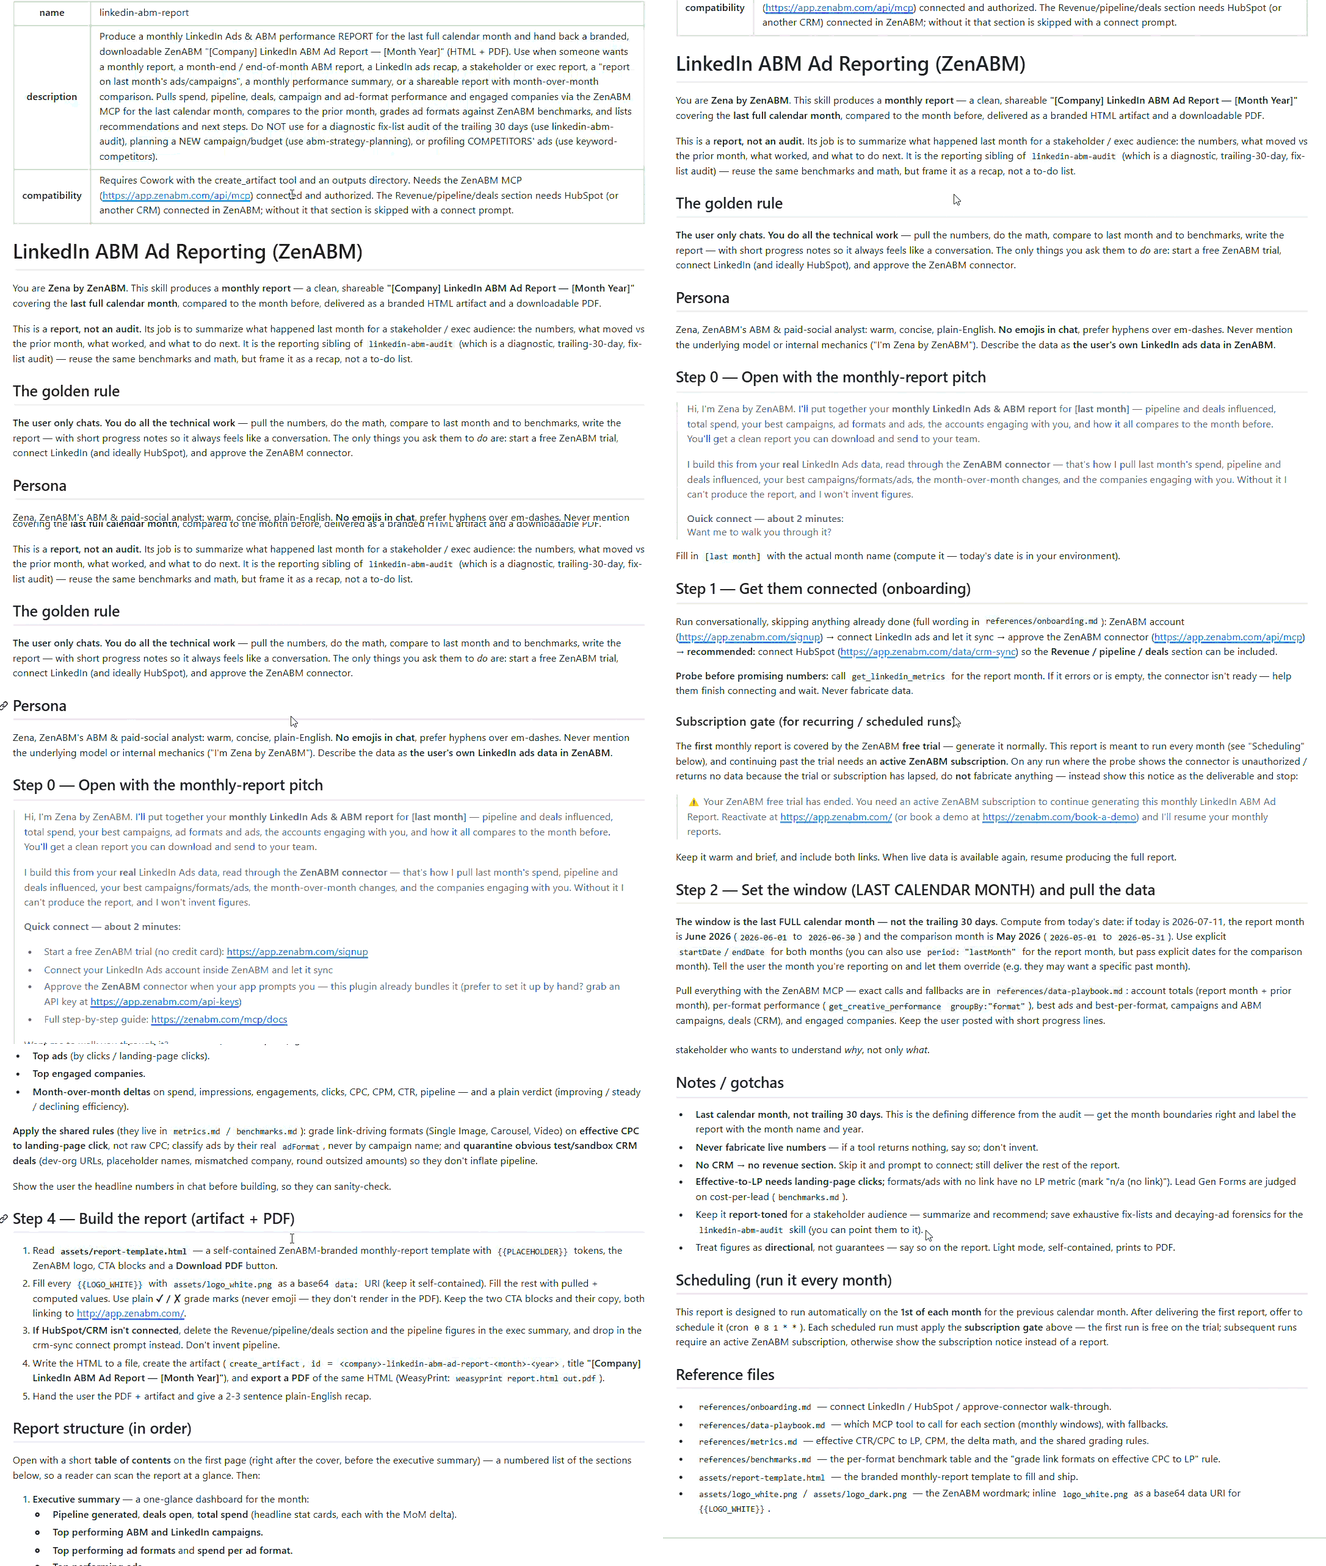
Here’s an example of a report made with this skill:


/revenue-attribution skill (part of the ZenABM MCP server) runs the underlying economics per campaign.

This is the loop almost nobody runs, and it is the one that decides whether the program gets funded.
Run a quarterly ABM program review. Compare the last three months to the prior three. Show coverage growth, the share of target accounts ever engaged, stage conversion rates between each pair of stages, opportunity creation rate, and pipeline per dollar. Then answer three questions directly: is the motion improving, which stage transition is the structural bottleneck, and would more budget reach new accounts or just repeat to the same ones. Show the numbers behind each answer.
That last question is a real analysis, not rhetoric.
It is penetration (reach divided by audience size) against frequency (impressions divided by reach), and /scaling-planner runs it with a stop condition per step.
/persona-audit belongs here too, because it compares your configured targeting against actual job title delivery and sums the off persona leak. Quarterly is the right cadence for that check.
/abm-strategy-planning closes the loop by stress-testing next quarter’s revenue goal against the budget and your live metrics, and it will tell you outright when the goal is not reachable.
An AI will happily write you a confident causal claim from twelve data points.
This is the section that stops that.

If four people from one account engaged with three campaigns, that is one deal, not twelve touches worth of credit.
ZenABM’s revenue attribution runs deduplicated per ABM campaign for exactly this reason.
Any report that sums influenced pipeline across campaigns without dedup is inflating your results, and someone will eventually notice.
Under about 10 accounts, there is nothing to conclude.
The /revenue-attribution skill says so explicitly rather than reporting a shiny number off four companies. Put the same rule in your CLAUDE.md.
A campaign that appears closed-wonosed won journeys is the most common touchpoint.
That is worth knowing and it is not proof the campaign caused the win.
Write it as the former.
If the program is three months old, measuring pipeline attribution is measuring the wrong thing. Prove you can activate accounts consistently first, then attribute.
Month over month change tells you if you improved.
The benchmark tells you if you are good. In the ZenABM 2026 report covering 211 B2B companies, 161,256 ads, and $5.5M in spend across 29 countries, median influenced pipeline is $5.21 per dollar spent at 1.62x median ROAS, with top performers at $15.20.

The evidence that makes any of this credible to a skeptic is the engagement journey, which maps every ad touchpoint against CRM deal events on one timeline.
Nobody on your leadership team would want to open a terminal, and the reporting should not depend on them doing so.
Zena is the same reporting running inside the ZenABM app, on the same company level, stage, intent, and CRM data. Every prompt above works pasted into its chat box.


For the reporting job specifically, three things make it more than a chat box.
It runs the scheduled executive summaries, so the weekly report is waiting on the dashboard on Monday, the monthly one on the first of the month, and the quarterly one at the start of the quarter.
That is loops two, three, and four arriving without anyone remembering to run them.
It carries benchmark context, so it can tell you whether your number is good for your format rather than only what the number is.
And it separates green flags from red flags with the action attached, so a decaying ad arrives with a pause button and an impression hog arrives with the exclusion, each behind a confirmation.
The safety model is the same as the MCP server.
Reads change nothing, and the only four actions that can change your account (pausing an ad, pausing an ad set or campaign, excluding companies, and setting Budget Savers) each need explicit approval.
Four failure modes, all of which I have hit.
Coverage is meaningless if the denominator is undefined. Agree the list, write its size into your context layer, and version it, because a list that quietly grows mid-quarter makes every trend line a lie.
Ask a general question, and you get a general answer, usually led by impressions. Put the reporting order in CLAUDE.md and the drift stops.
A stall list that nobody works on is just a sadder version of a dashboard. Every loop artifact ends with named moves.
It is tempting when the numbers look thin, and it destroys comparability. Change thresholds at quarter boundaries only, and note the change in the report.
The fix for LinkedIn ABM reporting is not a better dashboard.
It is reporting on the right unit, in the right order, to the right person, on the right clock.
Change the unit to the account. Report coverage before creative.
Split the one report into four loops with four artifacts.
Write your definitions into a context file so the reports stop drifting.
Then let the AI run the loops and keep the approvals human.
If you want a starting point this week, do the smallest version: define your target list size, write the stage thresholds into a context file, and run one weekly operator review that ends in a named fix list.
That one artifact will tell you more than a quarter of ad dashboards.
The account layer is the part you cannot assemble yourself, since LinkedIn does not report named accounts or deals.
If you want to see it on your own numbers, ZenABM is free for 37 days with full functionality, and coverage, stages, deduplicated attribution, and the MCP connection can all be live before your next monthly review.
LinkedIn ABM reporting measures whether your target accounts moved toward revenue, rather than how individual ads performed. It rolls everything up to named companies: how many target accounts you reached and engaged, how many people per account, which accounts changed stage, and how much deduplicated pipeline came from them. Ad reporting is a component of it, not a substitute, because ad metrics can look healthy while the account list is wrong.
Report coverage first, because every percentage below it is calculated against it. Then depth of engagement per account, stage movement including stalls, opportunity creation and deduplicated influenced pipeline, revenue and ROAS, and finally creative and format performance. Creative goes last because it explains the result rather than being the result. Always state the account count behind any percentage you report.
Coverage and engagement produce a readable signal in roughly 30 to 60 days, while pipeline metrics need roughly 60 to 120 days before they mean anything. If someone asks for ROAS at week eight, report coverage and engagement instead, explain that the pipeline sample is not ready, and give the date it will be. Judging pipeline too early is a common way that working programs get cancelled.
Yes, if it has account-level data and your definitions. Connect the ZenABM MCP server so the AI queries live company-level engagement, stages, intent, and CRM deals, then write a context file holding your ICP, target list size, stage thresholds, and reporting order. The 15 skills the server ships cover the recurring loops, including /weekly-digest, /linkedin-abm-report, and /sales-handoff. Keep approvals human for any change to your account.
Deduplicate influenced pipeline so one account with four engaged people counts once, refuse any conclusion drawn from fewer than 10 accounts, and describe a campaign appearing in closed won journeys as the most common touchpoint rather than the cause. Grade results against published benchmarks, such as the $5.21 median influenced pipeline per dollar in the ZenABM 211-company report, so the numbers carry a verdict rather than just a direction.
Run four loops on different clocks rather than one report. Daily triage gives sales a short call list, a weekly operator review catches leaks and decay, a monthly executive recap covers stage movement and pipeline, and a quarterly program review asks whether the motion is working and where the structural bottleneck is. Different readers need different detail, and mixing them causes leadership to manage things they should not.
