To do LinkedIn ad revenue attribution, match the companies that saw each ad (click or no click) to the deals in your CRM. Clicks miss most of the story, because LinkedIn builds awareness and buyers often show up later as "direct" or branded search, which is why you need multi-channel revenue attribution at the company level.
Campaign Manager shows you clicks and a list of companies, but not which company saw which ad before a deal opened. ZenABM shows which companies engaged with each of your LinkedIn ads, using the official LinkedIn Ads API, and matches them to your CRM deals.
LinkedIn ad revenue attribution: quick summary
- Clicks and last touch miss most LinkedIn revenue. Many buyers see your ad, never click, and later arrive as "direct" or branded search. In our own CRM review, 51% of pipeline converted as direct traffic and 30% as "offline sources" under last touch.
- Track companies, not clicks. Count which companies saw or engaged with each ad, whether or not anyone clicked.
- "Influenced" needs a rule with three settings. A deal is influenced when the account had 10 or more ABM impressions in the 180 days before the deal was created. That is the threshold, the window and the trigger event, and you can tune the numbers.
- Test the rule against deal open rate. In ZenABM's study of 7,466 deals, 10 to 49 impressions went with fewer deals (0.6x) and 10+ engagements with 3.3x more, so add an engagement gate. ZenABM's influence coefficient then weights each deal by how strongly its signals correlate with deals on your own data.
- Native and third-party tools fall short. Campaign Manager's Companies tab is not per ad, deanonymisation tools only see site visitors, and HubSpot Ads works at contact level.
- Match companies to deals. A deal counts as influenced only if the account saw your ads before the deal opened.
- Report influenced pipeline, closed revenue and pipeline per dollar. Divide influenced pipeline by ad spend, and closed-won revenue from influenced deals by ad spend for ROAS.
- Be honest about causation. Add self-reported attribution and a strict threshold, because influence is not proof.
- In ZenABM: ZenABM shows which companies engage with each LinkedIn ad and matches them to HubSpot, Salesforce or Attio deals. The deal attribution dashboard then reports influenced pipeline, pipeline per dollar and ROAS per campaign.
- ZenABM price and trial: Plans start at $59/month, and every plan starts with a 37-day free trial.
Here is the whole post on one card:

See which companies your LinkedIn ads reached before the deal opened
Match company-level ad exposure to your CRM deals in minutes, with a 37-day free trial and no credit card.
- No setup fees
- Cancel anytime
- Full support included

Why LinkedIn ad revenue attribution breaks on clicks
LinkedIn ads are awareness-based. When someone searches Google, they are actively looking for you, but on LinkedIn your buyer might just be doom-scrolling. They see your ad and never click, then weeks later they search your brand on Google, so your CRM credits SEO or "direct".
Cristina Maliţa gives a clear example: a prospect saw 1,000+ LinkedIn impressions from January, downloaded an e-book in March, searched the brand in April and showed up as Direct Traffic. LinkedIn got zero credit.
Here is where that credit ends up in a typical CRM:

The deeper problem is contact-level reporting. CRMs are built for MQL-level attribution, so account-based reporting shows 10x more revenue than contact-level reporting, and at least 60% of ABM revenue goes unreported when reporting stops at the MQL.
Here is a real case. A six-figure deal was not attributed to LinkedIn Ads in HubSpot, yet the company had 563 impressions, 20 engagements and 18 clicks on Thought Leader Ads before the deal opened. Even HubSpot's contact-level attribution only works if the cookie was accepted, there was no ad blocker or VPN, and the conversion happened in the same session.
Here is the kind of view that shows influenced revenue and pipeline your CRM never reports:

How do you track LinkedIn ad revenue?
To track LinkedIn ad revenue, match the companies that saw your ads, click or no click, to deals in your CRM. Count a deal as influenced when the account crossed a threshold before the deal was created. Here is the sequence:
- Define "influenced" as a rule. Write down the threshold, the window and the trigger event, for example 10+ impressions in the 180 days before deal creation.
- Test the rule against deal open rate. Check that accounts above the threshold open deals more often than the rest, and add an engagement gate if they do not.
- Connect LinkedIn and your CRM at company level. Use a tool that reads company-level engagement from the LinkedIn Ads API, not contact-level form fills.
- Match companies to deals created after exposure. Only deals opened after the account crossed the threshold count.
- Read the deal timeline. Look at the touches before the deal opened and before it closed, not just the create date.
- Add the multi-channel view. Bring Google Ads, Reddit Ads, organic and AI referrals onto the same account journey.
- Report it. Lead with influenced pipeline and closed revenue per campaign.
Set the influence rule
Influenced deal = account with N+ impressions in the W days before the deal was created.
Pick N from how many people you target per company and how often you want each of them to see the ads. If you target 5 people per company and want each to see 10 ads, the threshold is 5 x 10 = 50 impressions. A 90-day window is conservative, because beyond three months few buyers remember seeing ads. ZenABM's default is 10 impressions over 180 days, and you can change both.
Sales cycles matter too. In a CRM review, the median was 188.5 days from first impression to closed-won, which is why a 180-day window exists.
Here are rules practitioners actually use:
Rule | Threshold | Window | Source |
|---|---|---|---|
ZenABM default | 10+ impressions | 180 days before deal creation | ZenABM |
Our worked example | 50+ impressions (5 people x 10 ads) | 90 days before deal creation | ZenABM |
Engagement gate from our deal study | 200+ impressions plus 3+ clicks or 10+ engagements | 180 days before deal creation | ZenABM's study of 7,466 deals |
Tim Davidson | 3+ paid clicks | 90 days before the demo | |
Miles Beard, low tier | 10+ impressions and 3+ clicks or engagements | 180 days of BDR qualification | |
Miles Beard, medium tier | 100+ impressions and 3+ clicks or engagements | 180 days of BDR qualification | same post |
Miles Beard, high tier | 500+ impressions and 10+ engagements | 180 days of BDR qualification | same post |
We count a deal as "ABM influenced" when the company was in the programme and had 10 or more ABM ad impressions before the deal was created.
Test the rule against deal open rate
A rule you picked is easy to attack, so test it. The question is simple: do accounts that cross the threshold open deals more often than accounts that do not? I checked this across 7,466 first deals from 118 ZenABM customers, looking at each company's LinkedIn activity in the 180 days before the deal. The method and every table are in LinkedIn ad signals that correlate with deal open rate.
Here is what each level of activity did to the deal open rate:
LinkedIn activity before the deal | Deal open rate vs other accounts |
|---|---|
1 to 9 impressions | 0.4x |
10 to 49 impressions | 0.6x |
200 to 999 impressions | 1.8x |
1,000+ impressions | 4.4x |
10+ engagements | 3.3x |
10+ clicks | 3.7x |
Reached the Interested ABM stage | 3.3x |
The default of 10 impressions did not hold up: light reach went with fewer deals, not more. Engagement is what separates deal accounts. So keep the impression threshold for counting reach, and add an engagement gate before you call a deal influenced, for example 200+ impressions plus 3+ clicks or 10+ engagements. Influenced deals are also bigger: the median was $20.3k, against $7.0k for the rest.
ZenABM's Influence thresholds management tab runs this test on your own data, suggests a threshold and compares it with the one you use today:

Correlation-based influence: the influence coefficient
ZenABM's revenue attribution dashboards now go one step further (the new Deals dashboard is rolling out to beta teams first). Every Friday ZenABM tests your LinkedIn ad signals against your own first deals and keeps only the ones that are statistically significant at your number of target accounts. Each signal gets a DOLR weight (deal open lift rate), which is phi × log2(lift): phi is the strength of the link, and lift is the size of the effect.
Each company then gets an influence coefficient from 0 to 100, and each deal counts at its company's coefficient. A $50,000 deal at a company with a coefficient of 44 adds $22,000 of influenced pipeline. You get two numbers side by side: influenced pipeline from the threshold, and influenced pipeline from the coefficient.
Here is the Influenced deals tab with both numbers:

It is still correlation, not proof of causation. Influenced pipeline: should you use it for LinkedIn Ads revenue attribution? covers how to set the threshold and the window, and how to run a holdout test.
Read the deal timeline
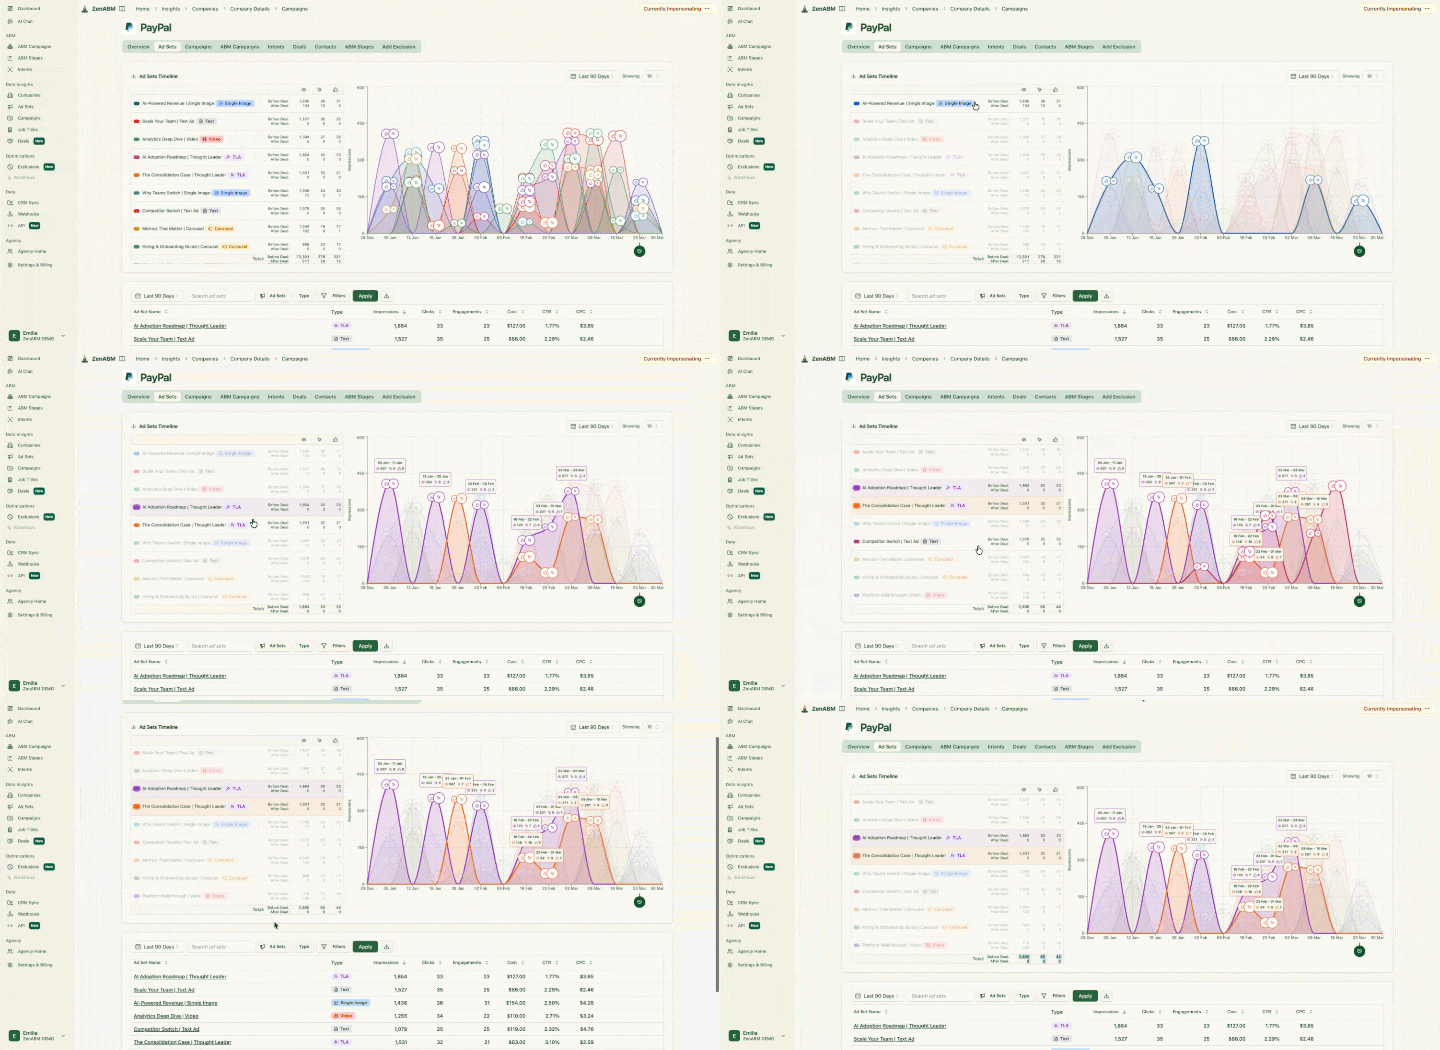
Open a deal and look at what the account saw before it opened and before it closed. Here is what that looks like in ZenABM, with each campaign touch shown on one account timeline:
The influence rule from this section fits on one card:

What doesn't work: LinkedIn ads attribution with the usual tools
None of the usual tools gives you company-level impressions for each ad, so none of them answers "which ads did this account see before the deal?". Here is how the four common options compare:
Tool | What it shows | What it misses | Company per ad? |
|---|---|---|---|
LinkedIn Campaign Manager | Companies tab with engagement across the ad account | Which company engaged with which ad; companies with few engagements | No |
Website deanonymisation tools | Companies that visited your site | Everyone who saw an ad but never visited | No |
Display ad networks | Cookie-based audience matches | Accurate company identity | No |
HubSpot Ads tool | Contact-level ad attribution | Which companies saw which ads | No |
LinkedIn Campaign Manager
LinkedIn Campaign Manager now has a Companies tab, which started as the Company Engagement Report. Here is what it shows:

That is not enough for attribution, because it aggregates data across the ad account, so you can't see which company engaged with exactly which ad. The export also only includes companies with enough ad engagements, so lower-volume engagement stays invisible.
ZenABM's Company engagements view shows the companies engaging with your ads, with their engagement score, ABM stage and CRM data on one row, which Campaign Manager doesn't expose. Compared with ZenABM, Campaign Manager gives you the account total, not the per-ad, per-company picture you need for deals.
Website deanonymisation tools
Website deanonymisation tools only help when someone visits your site. They can't reveal the companies that saw your ad and never clicked, which is extremely common on LinkedIn. Tools such as RB2B, Warmly and Demandbase work on reverse IP lookup, where an IP address is matched to an organisation through databases of known IP addresses. If the visitor uses a VPN or a shared network, say a Starbucks, the lookup won't match the right company.
Accuracy is a problem too. Syft's study of site deanonymisation accuracy found company identification rates low across services, with Clearbit the most accurate.
Many companies also don't register their IPs, as Kyle Ackerman points out:

RB2B shows the typical output of this category. Here is its dashboard of identified site visitors:

Userpilot used Clearbit, one of the most accurate in that study, to deanonymise companies that visited their site from LinkedIn ads and ended up with one reveal: themselves 😬

Pro tip: the LinkedIn Insight Tag shows visitor companies only in aggregate website demographics, not per ad or per visitor.
Display ad networks and behavioural data matching
A display ad network like AdRoll or Criteo uses third-party cookies and device fingerprinting to track users across websites. It then matches their behaviour to existing profiles to guess their company, industry and sometimes job title. That breaks in three places:
- Third-party cookies are being restricted in browsers.
- Profiles based on historical behaviour go stale, for example when someone changes jobs.
- Display networks carry bots that mimic human behaviour.
HubSpot Ads tool
HubSpot's ads tool lets you connect your LinkedIn Ads account, manage campaigns and sync form submissions. It attributes ads at the contact level, which is a different question from which companies saw which ads. Here is its campaign performance view:

It won't tell you which companies saw which of your ads, which ones clicked but didn't convert, which accounts show intent over time, or how campaigns influence deals in your CRM. Its contact-level attribution has limits too:
- You won't know the company if the person doesn't give it in the form.
- If someone clicks the ad and fills the form in different sessions, attribution depends on cookies and often misses.
- It ignores the people who never clicked, such as the colleague who clicked while a different person filled the form, or the company where nobody ever clicked.
On the plan side, deal create and deal revenue attribution reports are only available on Marketing Hub Enterprise, and HubSpot reports on only the most recent year of LinkedIn Ads data.
No company-level engagement data means no ABM and no ad revenue attribution insights.
LinkedIn ads attribution models compared: last touch, multi-touch and influence
The model you pick decides whether LinkedIn looks like it works. Here are the main options:
Model | How it gives credit | Why it fails or works for LinkedIn |
|---|---|---|
Last touch | All credit to the final click before conversion | Gives LinkedIn near zero, because the click usually happens on another channel |
Multi-touch | Splits credit across tracked touches | Redistributes credit inside an incomplete dataset, because untracked impressions never enter it |
Account-level influence | Credits the account's exposure before the deal opened | Fits long B2B cycles and counts people who never clicked |
Correlation-based influence (influence coefficient) | Weights each deal by how strongly the account's signals correlate with deal open rate on your own data | Answers the "you picked the threshold" objection, because the rule is tested, not chosen |
Liam Collins argues that multi-touch models only redistribute credit inside a dataset that is already incomplete. We also think most multi-touch findings in B2B SaaS are not statistically significant, because showing causality needs far more data than B2B SaaS usually has.

How do you report LinkedIn ads revenue?
To report LinkedIn ads revenue attribution, lead with influenced pipeline and closed revenue per campaign, then divide by ad spend for pipeline per dollar and ROAS. A report view in ZenABM looks like this:

Use these formulas:
Influenced pipeline = sum of open deal value from accounts that crossed the threshold before the deal was created
Pipeline per dollar = influenced pipeline ÷ ad spend
ROAS = closed-won revenue from influenced deals ÷ ad spend
Report the influence coefficient view next to it. There, each deal counts at its company's coefficient and not in full. In the worked example in our signals post, the threshold view gives $2,402,500 of influenced pipeline and the coefficient view $1,422,960. The second number is the conservative one.
Take a hypothetical campaign: $75,000 of influenced pipeline on $15,000 of ad spend gives $75,000 ÷ $15,000 = 5.0 pipeline per dollar. For comparison, the 2026 ABM Benchmarks Report puts the median pipeline per $1 at 5.21 across all companies, so 5.0 is a typical result, not an outlier.
Add one more diagnostic if your CFO still trusts only last touch. Filip Saračević counts the share of new pipeline that had any LinkedIn ad touch before converting. He uses one CRM export and one Campaign Manager export, and it takes about an hour.
Share of new pipeline with any LinkedIn touch = new pipeline with a LinkedIn ad touch ÷ all new pipeline
A high share with low last touch means the channel works and your CRM is failing to report it. A low share means a targeting problem.
Three habits make the report hold up:
- Report per ABM campaign, not one blended average, so each motion earns its own pipeline per dollar.
- Report demos before pipeline. Philip Ilic compares CRM lifecycle stage against impressions, clicks and engagement before conversion, because demos move earlier than pipeline.
- Point to named companies and their timelines, not an aggregate score.
Don't judge this month's spend this month. We see about 45 to 50 days for accounts targeted with ABM ads to move into pipeline.
How ZenABM helps with LinkedIn ad revenue attribution
When I was VP of Marketing at Userpilot, I struggled to run ABM on LinkedIn. My husband watched it up close and built ZenABM to fix it. I might be a bit biased as a co-founder, but I also know first-hand what it is like to struggle to find the right tool. Here is which ZenABM capability does which step:
- Track every company, click or no click. ZenABM's Company engagements view shows impressions, clicks and engagements for every company at ad, ad set and campaign level. It also gives a 1 to 5 engagement score, calculated from clicks (counted twice) and engagements divided by impressions. It pulls this from LinkedIn's official API every Monday, with no cookies, no reverse IP and no form fills.
- Get past LinkedIn's 3-interaction threshold. LinkedIn hides company data when there are fewer than 3 interactions in a period, so ZenABM also aggregates at the campaign-group level.
- Write it into your CRM. ZenABM's CRM sync writes engagement onto company records in HubSpot, Salesforce or Attio. That covers 7, 14, 30 and 90-day windows plus cumulative, scores, ABM stages and intent. It creates the properties for you. HubSpot analytics write back weekly and deals refresh daily.
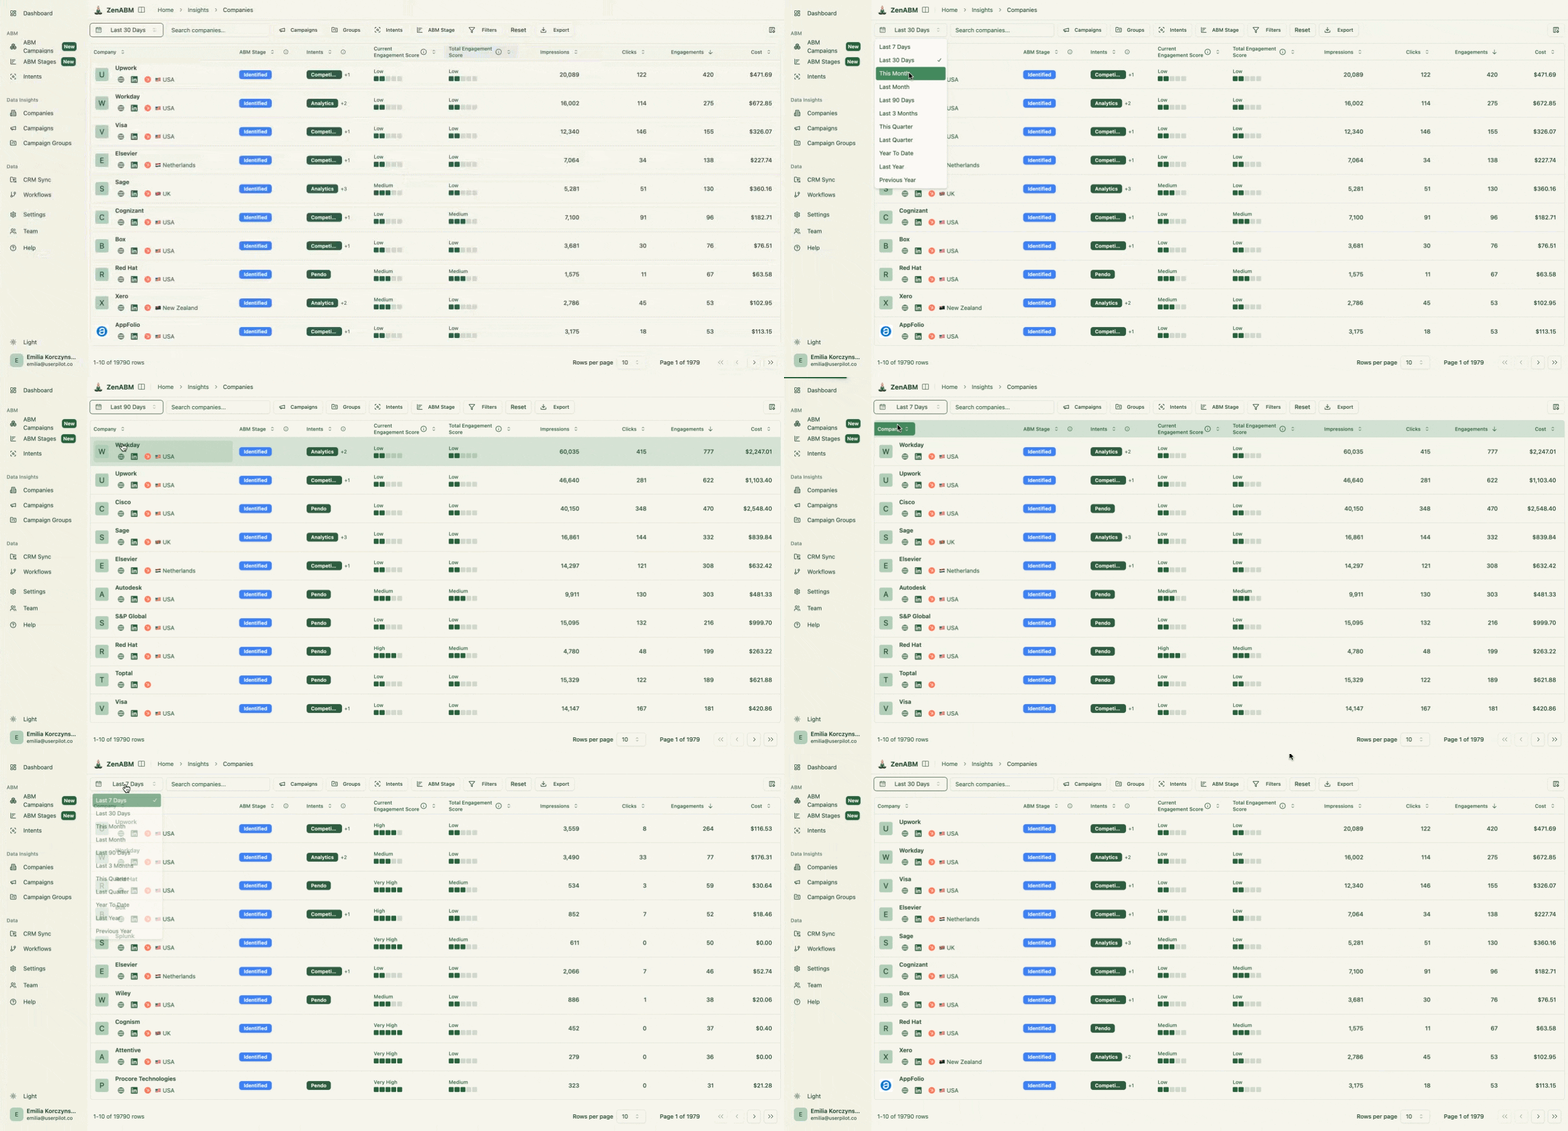
Here is the Companies view with impressions, clicks, engagement and spend per account:
LinkedIn's own docs state the 3-event minimum:

Here are the synced LinkedIn ad properties in HubSpot:

The cumulative totals are stored as company properties too:

- Define influence and stages. You set the threshold and window in your CRM settings (default 10 impressions over 180 days). ABM stages are rules over ad engagement and CRM data, so define Customer and Lost early or revenue attribution can't work.
- See the deal timeline. The deal attribution dashboard shows impressions, clicks, engagements and spend before each deal opened and before it closed, by ad set and campaign. With HubSpot connected it adds Google Ads, Reddit Ads, organic and AI referrals to the same journey.
- Report per motion. ABM campaign dashboards give each motion its own spend, pipeline per dollar, ROAS and influenced pipeline.
- Ask in plain English. Zena, ZenABM's AI agent, answers attribution questions from your live data. The
/revenue-attributionskill runs the full analysis from one command in Claude, ChatGPT or Cursor through the MCP server (MCP and API come with the Growth plan). When I asked Zena which ad formats the accounts I opened deals with had engaged with most, the overwhelming majority of engagements came from Thought Leader Ads, which helped me defend the spend. ZenABM also sends automated weekly, monthly and quarterly AI reports. - See which signals line up with deals. Every Friday ZenABM tests which ad engagement signals show up more often in accounts that open deals, as explained in our post on deal influence signals.
- Stay on official ground. ZenABM uses LinkedIn's official API, unlike scraping and automation tools that LinkedIn keeps cracking down on.
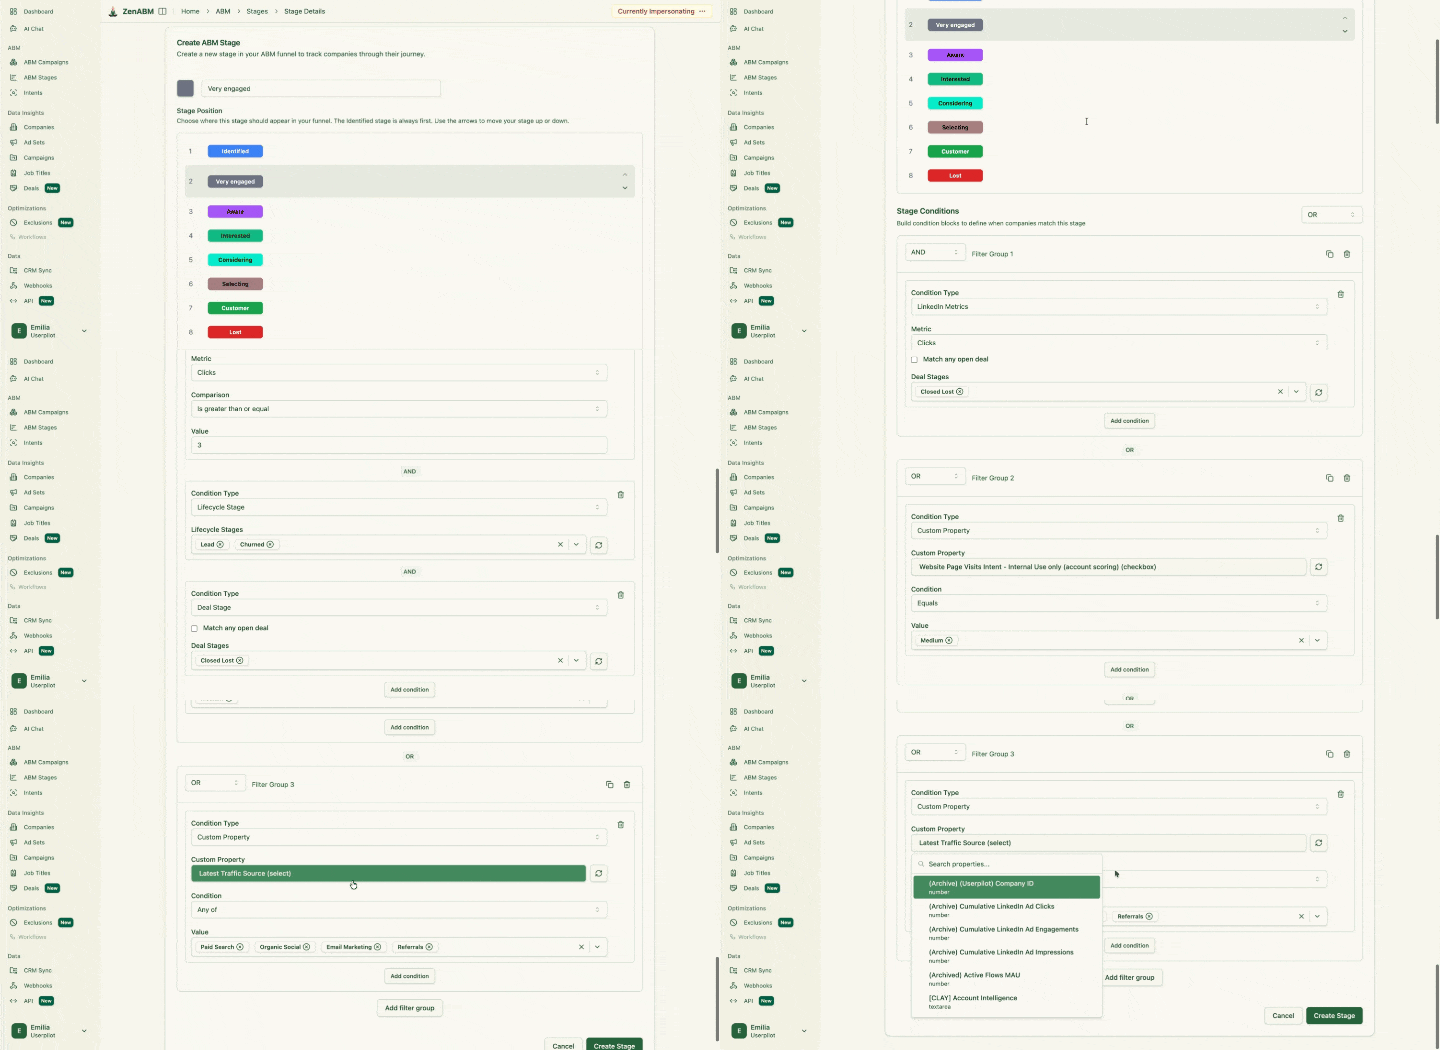
Here is the stage editor, with a custom stage added to the funnel:
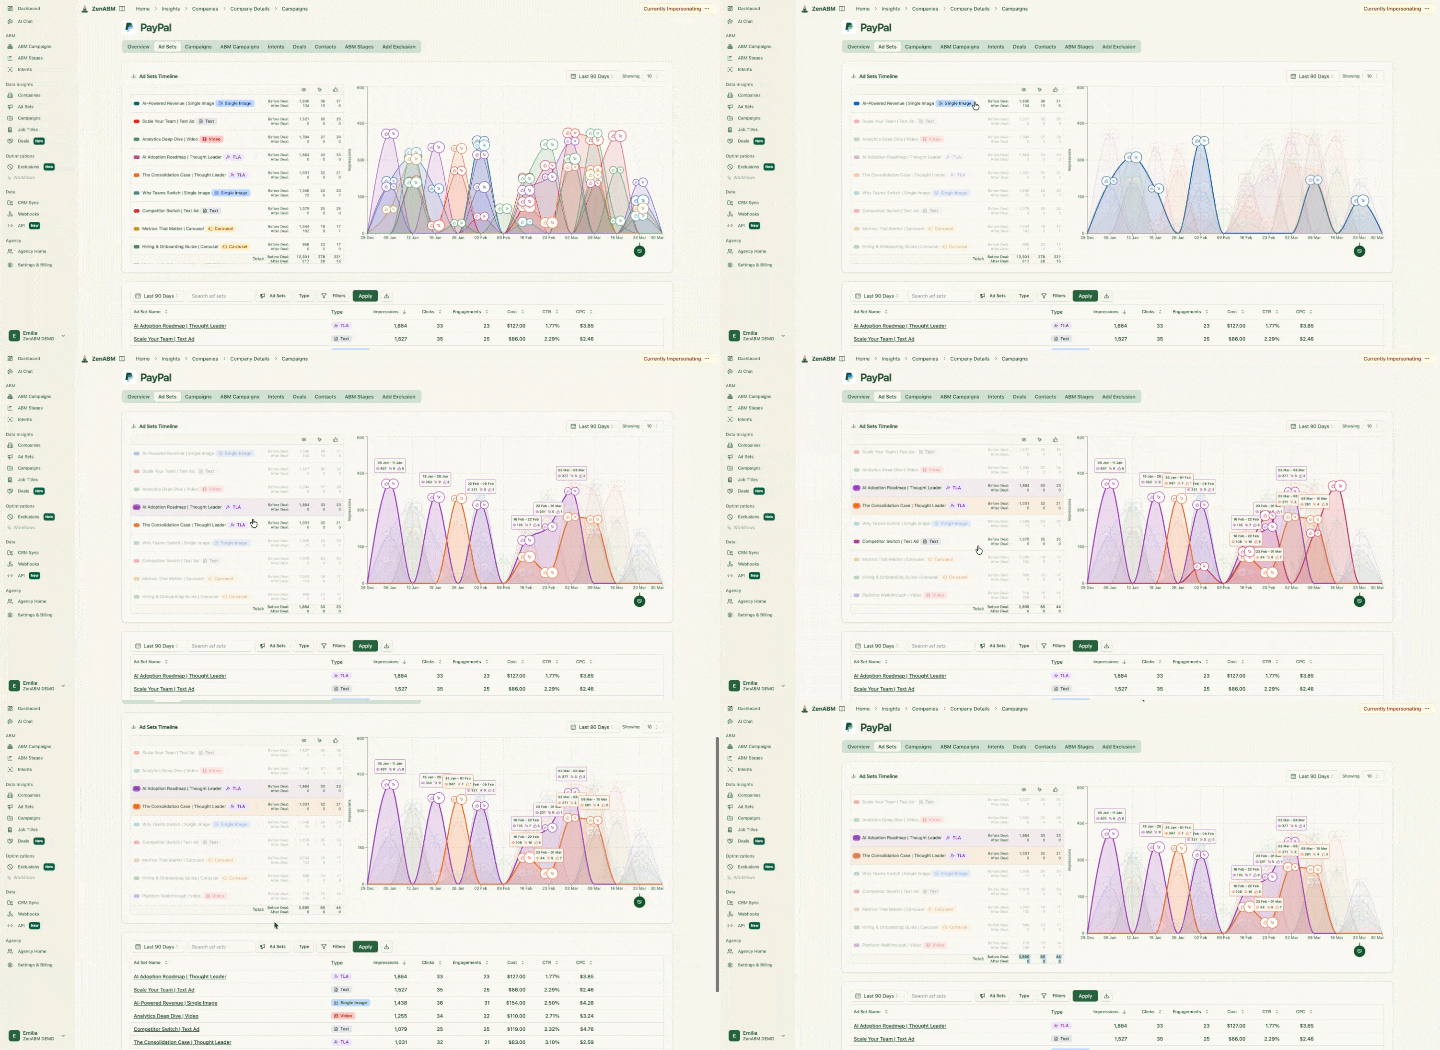
Here is the deal-by-campaign view, which shows which campaigns touched each deal over time:
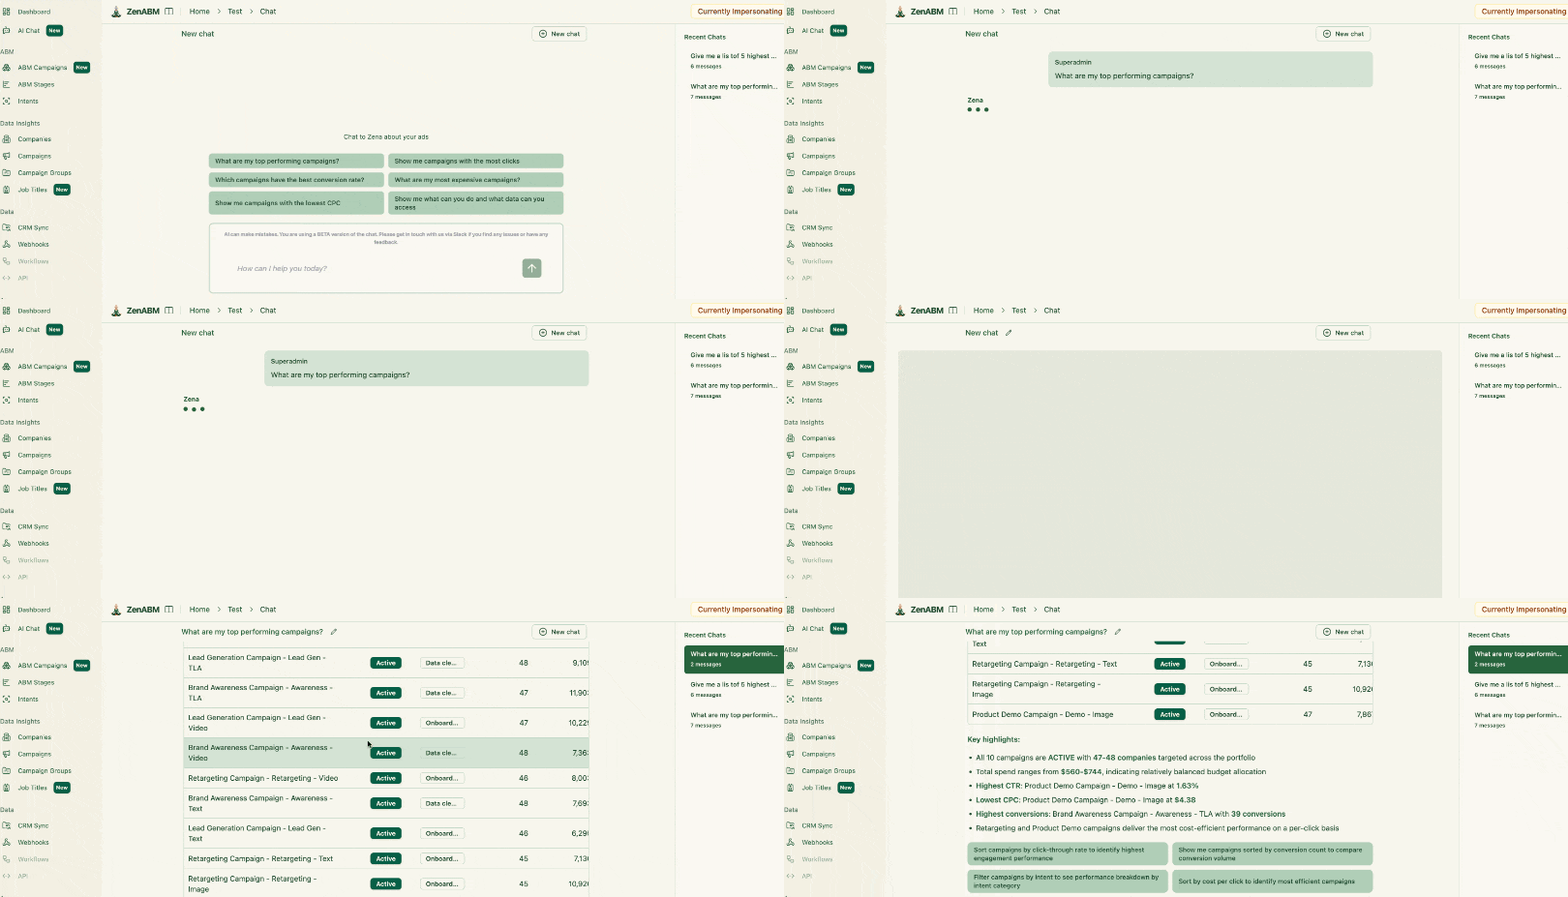
And here is Zena answering questions about your LinkedIn ads:
LinkedIn keeps cracking down on scraping tools, as Joe Apfelbaum posted:

A G2 reviewer, a Head of Revenue, wrote: "What I like best about ZenABM is that they understand ABM beyond theory." ZenABM has a 5.0/5 rating from 6 reviews. A mild point reviewers raise is that ABM takes time to compound, so results are not immediate, and the team keeps shipping new features based on customer feedback. ZenABM is built for LinkedIn, so it does not buy display ads or sell third-party intent data. Plans run from Starter at $59/month to Agency at $479/month on annual billing, with a 37-day free trial and no credit card. Agencies can reach every client workspace through the Agency MCP server.
For the 2026 benchmark figures behind the reporting section, grab the ABM Benchmarks Report, and to run attribution from your AI client, see the expert skills.
Match your LinkedIn ads to the deals they influenced
Book a demo and see the deal attribution dashboard on your own LinkedIn and CRM data.
- No setup fees
- Cancel anytime
- Full support included

Making the number believable: self-reported attribution and a strict threshold
Influence is not proof, so make your number believable before someone challenges it. Add a "How did you hear about us?" field to your demo or lead form, and have sales ask it in discovery. Then weight it against engagement: a lead with 350 impressions, 20 engagements and a LinkedIn self-report is high confidence, while 5 impressions, no engagement and paid search last touch is low confidence.

Self-reported data also exposes how much dashboards miss. Gabriel Ehrlich audited 481 inbound leads and found the real LinkedIn number was roughly 40 to 50 percent higher than the dashboard showed.
Be strict and honest on the other side. Ali Yildirim warns that treating every faint impression as influence builds a prettier vanity metric, so admit that some pipeline would have closed anyway. Include open deals with no ad exposure in the report too, because those will be harder to close, and consider running ads to them with customer testimonials and social proof.
If a sceptical CFO accepts no modelling answer, run an incrementality test. Liam Collins suggests a geo holdout with two statistically paired regions, only one with spend, a pre-registered win condition and about 12 weeks. That settles whether the deal would have happened anyway, which no attribution model can.
Does LinkedIn drive revenue? Judged by clicks, almost never. Judged by which accounts saw your ads before the deal opened, a lot more often than your CRM admits. What threshold are you using?
Frequently asked questions
How do I attribute revenue to LinkedIn ads?
Track which companies saw each ad, click or no click, then match them to the deals in your CRM. Count a deal as influenced when the account crossed your threshold in the window before the deal was created, for example 10+ impressions in 180 days, and add an engagement gate such as 3+ clicks or 10+ engagements. ZenABM does this matching, tests the threshold against your deal open rate and reports influenced pipeline and closed revenue per campaign.
How do I track LinkedIn ad revenue?
Connect LinkedIn and your CRM at company level, set an influence rule (threshold, window and trigger), and match accounts to deals created after exposure. ZenABM pulls company-level engagement from LinkedIn's official API, and its deal attribution dashboard shows the touches behind each deal.
How do I measure ROI with LinkedIn ads?
Divide influenced pipeline by ad spend for pipeline per dollar, and closed-won revenue from influenced deals by ad spend for ROAS. For example, $75,000 of influenced pipeline on $15,000 of spend is 5.0 per dollar. ZenABM's dashboards show both per campaign out of the box.
Why can't I attribute LinkedIn ads revenue by clicks?
LinkedIn ads build awareness, so many buyers see your ad and never click. They later search Google or visit directly, and your CRM credits that channel instead. Click attribution misses all of them, which is why company-level impressions per ad are the better basis.
Can Campaign Manager show which companies saw each ad?
Not per ad. The Companies tab aggregates engagement across the ad account, and its export leaves out companies with few engagements. ZenABM shows every engaging company per campaign, ad set and ad, with its engagement score, ABM stage and CRM data on one row.
What is the best LinkedIn ads attribution model?
For long B2B cycles, account-level influence works best, because it credits companies that saw your ads before a deal opened, click or not. Make it correlation-based: test the threshold against deal open rate, so the rule is measured and not picked. Pair it with self-reported attribution, because last touch undercounts LinkedIn. ZenABM runs this model and shows the full deal timeline for each account.
About the author