



The first time I tried to automate LinkedIn ads reporting with AI, I automated the wrong half of the job: a scheduled dashboard export that landed in my inbox every Monday.
It looked professional, but changed nothing about how we ran the ABM campaign.
The numbers arrived, but the decisions still had to be dug out.
What actually fixed reporting for us was automating the analysis and the recommendation, not just the delivery.
That means an AI agent that can query live company-level ad data, write the report, flag what is decaying, and propose the fix, with you approving the changes.
This guide is the full setup: wire Claude Code or ChatGPT to the ZenABM MCP server, build a saved library of report prompts, package the recurring ones as free Claude skills, and let Zena, ZenABM’s AI agent, run the proactive layer.
The guide also includes how to read each report and what to change because of it.
The short version, if you only have a minute:
/linkedin-abm-report and /linkedin-abm-audit skills by ZenABM produce the exec report and the operator audit as branded HTML and PDF, on real ZenABM data. You can access them on the repository here.Automating LinkedIn ads reporting with AI is more than just dashboard software where you connect LinkedIn Ads, pick a template, and schedule a PDF.
I have run that kind of setup, and I feel that it automates report delivery while leaving report work untouched.
Someone still has to stare at the export, figure out what changed, decide what to do, and go do it.
So I think about reporting automation as three layers, and I evaluate any tool by which layers it actually covers:
| Layer | What it does | What automates it |
|---|---|---|
| Data | Pulls metrics from LinkedIn and joins them to accounts, stages, and CRM deals | The ZenABM MCP server (or the REST API), reading the official LinkedIn Ads API and your CRM |
| Analysis | Turns the metrics into a written report: what changed, what is decaying, what is heating up | Saved report prompts in Claude Code or ChatGPT, or the free /linkedin-abm-report and /linkedin-abm-audit skills |
| Decision | Recommends the move (pause, scale, refresh, exclude, hand to sales) and executes it after you confirm | Zena’s flags and recommendations, and the MCP server’s write tools, each behind an explicit confirmation |
The reason the data layer has to be company-level and CRM-joined, rather than a raw Campaign Manager export, is that the two metrics every useful report leans on do not exist in Campaign Manager.
CTR and CPC count social engagement you are not buying for pipeline; eCTR and eCPC count the clicks you are. ZenABM computes both by joining company-level ad engagement to your landing page and CRM data, which is what makes every report below possible.


Everything in this guide builds those three layers in order.
Data first.
There is no native LinkedIn Ads integration for Claude Code or ChatGPT, so the connection runs through an MCP server that reads the LinkedIn Ads API for you.
The ZenABM MCP server is the one I use because it exposes the CRM join, not just the ad metrics, and the whole point of automated reporting is answering pipeline questions, not impression questions.
Alex Fine, co-founder at Understory, put the concept in one line I have not improved on:
“MCPs are basically secure bridges between Claude and your business tools.” Alex Fine, Co-Founder, Understory, on LinkedIn
Here is the setup, start to finish.
It took me hardly five minutes the first time:


One command:
claude mcp add zenabm --transport http https://zenabm.com/mcpOr, if you prefer the config file route with a token:
{
  "mcpServers": {
    "zenabm": {
      "url": "https://zenabm.com/mcp",
      "headers": { "Authorization": "Bearer YOUR_ZENABM_TOKEN" }
    }
  }
}
Run /mcp inside Claude Code to confirm the connection, and you are done.
ChatGPT connects through its connectors settings: add a custom connector, paste the same https://zenabm.com/mcp URL, and authorize over OAuth.
From there, every report prompt in this guide runs in a ChatGPT conversation the same way it runs in the terminal.

The server ships 60+ tools across five groups: list and search (campaigns, ad sets, creatives, companies, contacts), company intelligence (overviews, timelines, activity logs, deals), LinkedIn ads performance (metrics, creative performance, spend, job titles), ABM and revenue (stages, stage history, campaign overviews, intent signals), and a small set of write actions such as updating an ad’s status.
The split between reads and writes is the part I want you to actually internalize, because it is what makes automation safe enough to run weekly.
Read questions never alter anything in your account.
Write actions (pausing an ad, activating a campaign) are flagged, so the agent proposes the change and waits for your explicit confirmation before touching your ad serving state.

With the data layer wired, reporting automation is mostly a prompt library you build once.
We run six reports on a fixed weekly cadence, in the same order every Monday, because a number next to last week’s number actually helps in making decisions.
Each report below comes with the exact prompt (copy it as is) and the read: what to look at in the output and what to do about it.
Run this first, every time, because it sets the agenda for everything after it:
I want my weekly LinkedIn ads review for the last 7 days vs the previous 7 days. Start with a one-paragraph headline: did the program get healthier or worse this week, and why. Then list the 3 things that changed most. Use eCTR and eCPC, not just CTR and CPC. Keep it tight. I will ask for each deep dive after.

How to read it: the headline paragraph is the only thing your boss will read, so judge it the way they would. If the agent leads with vanity engagement instead of landing-page clicks or pipeline, push back and tell it to lead with eCTR, eCPC, and pipeline movement. The three biggest movers become your agenda for the rest of the session.
Format choice is the single biggest efficiency lever on LinkedIn, and it is the one most teams get wrong by trusting CTR alone (CTR counts likes and comments; eCTR counts the click you paid for):
Rank my LinkedIn ad formats for the last 30 days by eCTR. For each format show impressions, spend, clicks, CTR, landing-page clicks, eCTR, and eCPC side by side. Then tell me which format is the most efficient way to buy a landing-page click right now, and which format I am overspending on.

How to read it: ignore the CTR column for ranking and read eCTR and eCPC. The spread between formats is real money: in the ZenABM 2026 benchmarks report (211 B2B companies, 161,256 ads, $5.5M in spend across 29 countries), Thought Leader Ads run a 2.68% median CTR at a $2.29 median CPC while single image ads run 0.42% at $13.23. A format eating spend with a high eCPC and a thin landing-page click count is your first pause-or-cut candidate of the week.

Because the agent lives in a terminal, it can also draw the gap instead of describing it:
Write a quick Python script that charts my formats as a scatter: eCPC on the x axis, eCTR on the y axis, bubble size by spend. Save it as format_efficiency.png so I can paste it into Slack. The top-left quadrant is my winners, label them.


Format efficiency tells you which formats to spend on; stage movement tells you whether the expenditure is moving accounts.
This is the report that separates a demand gen operator from someone who reports ad metrics:
Show me ABM funnel movement for the last 30 days. Who moved from aware to interested, interested to considering. Who stalled and is now past the average time in stage. What is the average time in each stage, and which campaigns drove the most stage movement. Flag any account stuck in interested for more than 6 weeks past the average.
How to read it: movement is the good news, and stalls are the action. An account that progressed needs nothing from you, whereas one sitting in interested for six weeks past your average is the prompt to change the creative, add a touch, or hand it to sales before it goes cold.
Pay equal attention to the campaign-level read at the bottom, because the campaign driving the most stage movement is the message that is working, and that is where the next budget and creative variations go.
This is the report your sales team cares about most, and the one that makes marketing look like it generates pipeline rather than just reporting on it:
Build me an account cohort for this week. Which companies are surging in engagement with my LinkedIn ads compared to the prior two weeks, which are engaging for the first time, and which show the strongest buying intent right now. For each, show the intent topics and the ABM stage. Sort by how fast engagement is accelerating, and tell me the 5 accounts a rep should call this week.

How to read it: read the acceleration, not the absolute volume. A small account that went from zero to several engagements in a week is a stronger intent signal than a large account holding steady.
The intent topics next to each company come from ZenABM’s first-party buyer intent layer (campaigns tagged by theme, accounts labelled by what they engaged with), and they are what the rep opens with, so the outreach references the thing the account is actually researching.

Then turn the shortlist into a file a rep can open, instead of a Slack paste:
Take those 5 accounts and write a handoff file called hot_accounts_this_week.md. For each one include the company name, ABM stage, top intent topics, the ads they engaged with, and a one-line suggested opener for the rep. Date it at the top.
How to read it: open the file and check that each opener references something real about the account. If the opener reads like a template line, the intent topics did not make it in, so ask the agent to rewrite using the specific topics.

Comparisons answer the only question leadership actually asks, which is whether things got better or worse since last time and why:
Compare this month vs last month across my LinkedIn ABM program. Show ad spend, attributed revenue, blended ROAS, active campaigns, eCTR, and eCPC for both periods with the percent change. Then write a short narrative: what drove the biggest changes, what is a real trend vs noise, and the top 3 risks and opportunities right now.
How to read it: scan the percent-change column first and let the biggest movers set your attention, but also read the absolute numbers before you celebrate, because a revenue jump from a low base looks dramatic in percentage terms.
The narrative is where the agent earns its keep: a good one separates a structural change (a mid-month campaign consolidation) from week-to-week noise. Treat the risks list as hypotheses, and verify the one that would cost you the most if it were true.
Creative fatigue on LinkedIn is gradual, so an ad can slide for weeks before anyone notices in a dashboard.
A weekly creative-level read catches it early enough to refresh before it wastes another month of spend:
Give me a decaying-ads report. Which of my LinkedIn ads have a declining CTR or eCTR for 2 or more consecutive weeks while above 1,000 impressions, and should be paused or refreshed. For each, show the eCTR trend by week and the eCPC, and rank by how much spend is behind the decline. Then list my top 5 ads by eCTR that I should scale or clone.
I ran a similar prompt for our program at ZenABM a while ago:

How to read it: the decaying list is your pause-and-refresh queue, sorted so the ads burning the most money sit on top. A two-week eCTR slide above the impression floor is a real intent signal from the audience, not noise, so trust it. The winners list at the bottom is the other half of the decision: the budget you free from a fatigued ad flows to a creative still pulling landing-page clicks, and when you find a winner, clone it with a fresh variation before it fatigues too.
The first Claude-Code-specific power worth using: drop your standards into a CLAUDE.md so every analysis inherits them, and save the review as a slash command so you never retype it.
Create a CLAUDE.md in this folder with my LinkedIn ads analysis defaults: always compare last 7 days vs the previous 7 days, always report eCTR and eCPC alongside CTR and CPC, treat any ad above 1,000 impressions with a 2-week eCTR decline as decaying, and end every analysis with a recommended action. Then save my weekly review prompt as a slash command called weekly-li-review.
How to read it: open the CLAUDE.md the agent writes and sanity-check the thresholds, because the 1,000-impression floor and the two-week window are defaults that shift with your spend level. Once these live in a file, a teammate who opens the same folder gets the same standards for free, which is how reporting stays consistent when it stops being one person’s expertise.
Once each report works on its own, the real payoff is running them as one chain that writes a single file.
This is the concrete difference between an agent and a chat window: the terminal pulls from five tool groups, assembles the results, and hands you a finished document your leadership can read, from one instruction.
Run my full weekly LinkedIn ads review now: format efficiency, funnel movement, account cohort, this-week-vs-last-week deltas, and the decaying-ads report. Combine everything into one file called weekly_report.md with an executive summary at the top, then a section per analysis, then a single prioritized action list at the end. Use eCTR and eCPC throughout.
How to read it: the prioritized action list is the whole point, and it should read as a short set of named moves: pause these two ads, scale this format, exclude this account, hand these five companies to sales. If the action list is vague, the analyses underneath were vague, so push the agent to make each line a specific decision. Saved as a slash command, the entire weekly review becomes one line you type on Monday morning; the whole routine takes about ten minutes once the prompts exist.
Then give the reports a memory, because a dated file history is something dashboards cannot do:
Save this comparison to a file named li_review_2026_06.md. Next month, when I ask, read the previous month’s file from this folder and tell me what is genuinely trending across both reports, not just what changed this month.
How to read it: the value is the second-order read. A single delta only tells you this month moved, while a diff across three monthly files reveals the slow eCPC climb you have been ignoring, which is exactly the drift a one-week view hides.
One more chain worth saving, from our wasted-spend routine, because it produces the number leadership responds to fastest:
Add up the total monthly spend across everything we just flagged: overspending ad sets, impression-hog accounts, non-ICP job titles, and decaying ads. Give me one number for reclaimable monthly spend and a short list of the specific changes that produce it.
The full wasted-spend audit that feeds this roll-up (eCPC outliers, impression hogs, non-ICP titles, decay) has its own walkthrough in the LinkedIn ads automation with AI guide, with every prompt included.

Prompts are great until you are pasting the same five paragraphs every Monday.
The packaged version of this entire reporting motion exists as free, open-source Claude skills, built out of the same LinkedIn ABM program this blog documents.
The repo is github.com/ZENABM/linkedin-abm-skills, and the install in Claude Code is two lines:
/plugin marketplace add ZENABM/linkedin-abm-skills
/plugin install linkedin-abm-skills@zenabm
On Claude Desktop or web, you download the zips from the releases page and upload them under Customize, then Skills, or into a Project. The skills run on sample data out of the box; pointed at a ZenABM account, they pull your real numbers through the MCP server you wired in step 1.
Two of the four own the reporting job, and the split between them matters:
The ABM Monthly Report skill produces the exec-facing recap: spend, pipeline and deals influenced, best campaigns, formats, and ads, top engaged companies, ad sets graded against format benchmarks, month-over-month change, and recommendations.
It is the weekly_report.md chain from step 3, formalized into a branded document you can forward without editing. This is the report for the person who funds the program.

The ABM Audit skill runs the 30-day diagnostic on the same data and math, but for the person who runs the program: a scorecard, an ad-count model checked against your live account, format grading versus benchmarks, decaying ads, impression hogs, and a prioritized red-and-green-flag fix list, output as branded HTML and PDF.
Audit and report are deliberately split because the audiences differ: the audit is an operator to-do list you run weekly, while the report is an exec recap you send monthly. Same data, different reader.
The ad-count model inside the audit deserves a line here because it is the single check that catches the most accounts: monthly budget / 30 / cost per landing-page click / roughly 4 clicks per ad per day = the most ads you can support at once.
Running more than that means underfunding every campaign, losing auctions, and never learning whether a message landed.
We made exactly this mistake early in our program (too many ads across too many underfunded ad sets), and the audit exists partly because cleaning that up by hand once was enough.
The other two skills in the repo close the loop the reports open: /abm-strategy-planning stress-tests your revenue goal against budget and real ad metrics when a monthly report shows the goal and the spend do not add up, and /abm-campaign-execution turns the fix into launch-ready ad briefs and mockups when the decay report says a creative needs replacing.
The toolset around this workflow is bigger than one vendor, and I use several free skills by other builders alongside ours.
These all appeared in my earlier testing for the AI ABM tools roundup:
| Skill or plugin | Job in the reporting loop | What it does |
|---|---|---|
| LinkedIn ABM Reporter (emikor) | Recurring reports | Connects to the ZenABM API and, on the /abm-report command, generates period-over-period reports with deal attribution, top engaged accounts, ABM stage moves, and auto-detected red and green flags, exported as PDF. Repo here. |
| Claude Ads (Agrici Daniel) | Settings-level audit | Runs 250+ checks (tracking, bid strategy, Audience Network) across seven ad platforms locally, produces a health score out of 100, and hands you a prioritized action plan. Run it when a report flags a problem the metrics cannot explain. |
| LinkedIn Ad Designer (Advanced Client) | Creative refresh | 23 pre-built, on-brand ad patterns (stat highlights, testimonials, comparisons). When the decay report says refresh, this is the fastest route to the replacement variant. |
| AgentSource | List building | Filters accounts by ICP criteria and enriches them through the Apollo and Crustdata APIs, cutting account research from 15 to 25 minutes down to about 2 per account. Feeds the account list your cohort report measures against. |
| ZenABM outbound agent | The handoff | Reads which accounts are engaging, finds ICP contacts via Apollo, writes emails referencing the exact topics each account engaged with, and pushes them to Smartlead on a weekly schedule. The cohort report’s call list, turned into sent outreach. |
Read related: How to analyze LinkedIn ads with Claude Code: a practical guide for demand gen marketers

Not everyone on your team is going to open a terminal, and they should not have to.
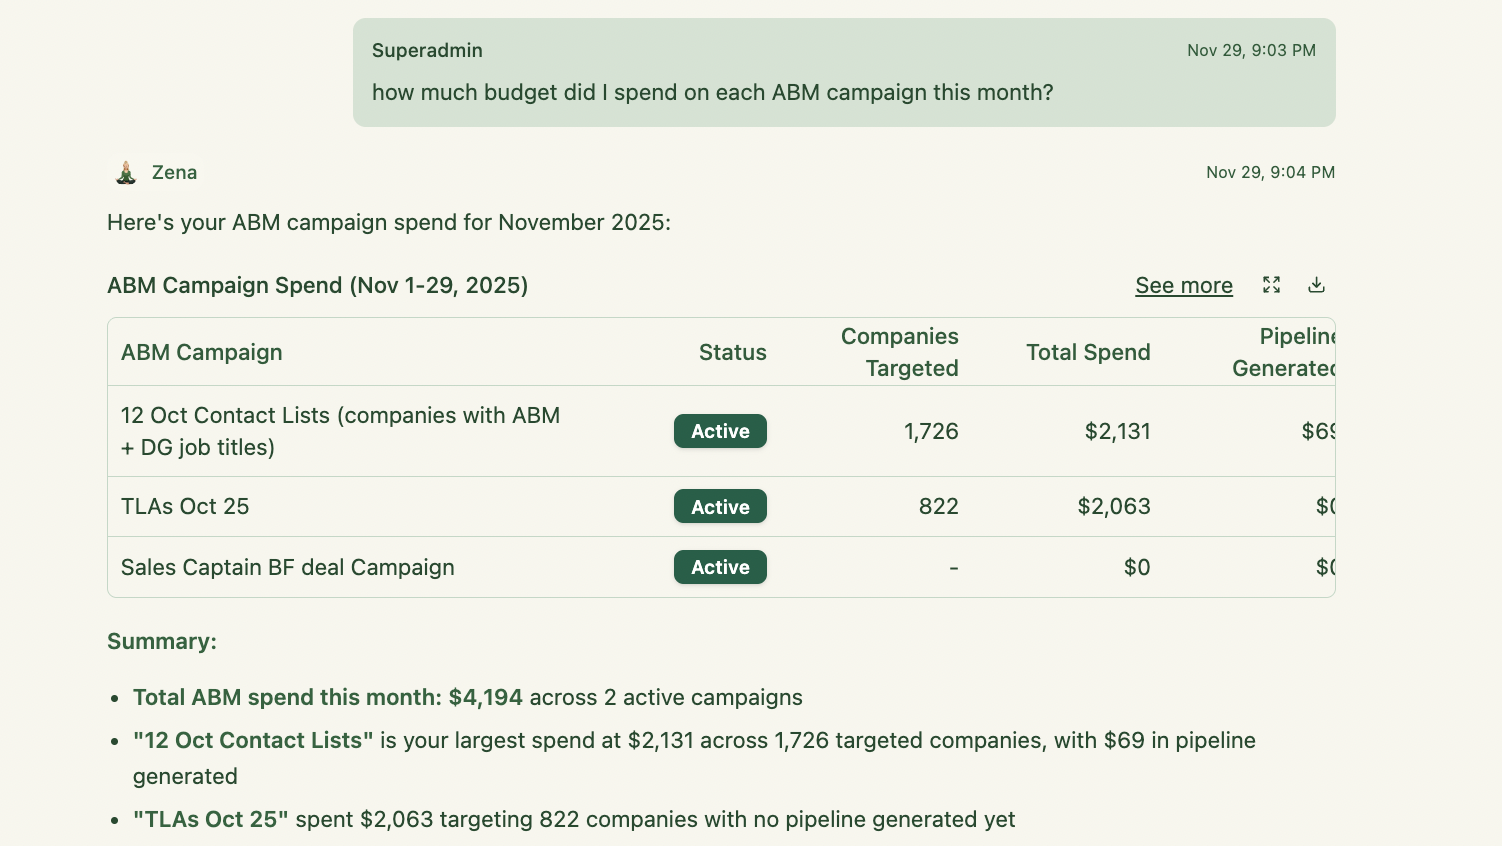
Zena is the same reporting engine running inside the ZenABM app: it sits on the same company-level ad, stage, intent, and CRM data, and answers the same questions in plain English.
Every prompt in step 2 works pasted into Zena’s chat box, and the outputs come back as shareable markdown reports your team can forward.
Four things make Zena more than a chat wrapper for the reporting job:
Zena is loaded with the ZenABM benchmark dataset and with expertise distilled from working LinkedIn ads practitioners, so when it reports your eCTR, it can tell you whether that number is good for your format, not just what it is.
A report that says “0.38% eCTR, below the format median” hands you a decision, while a bare “0.38%” hands you homework.
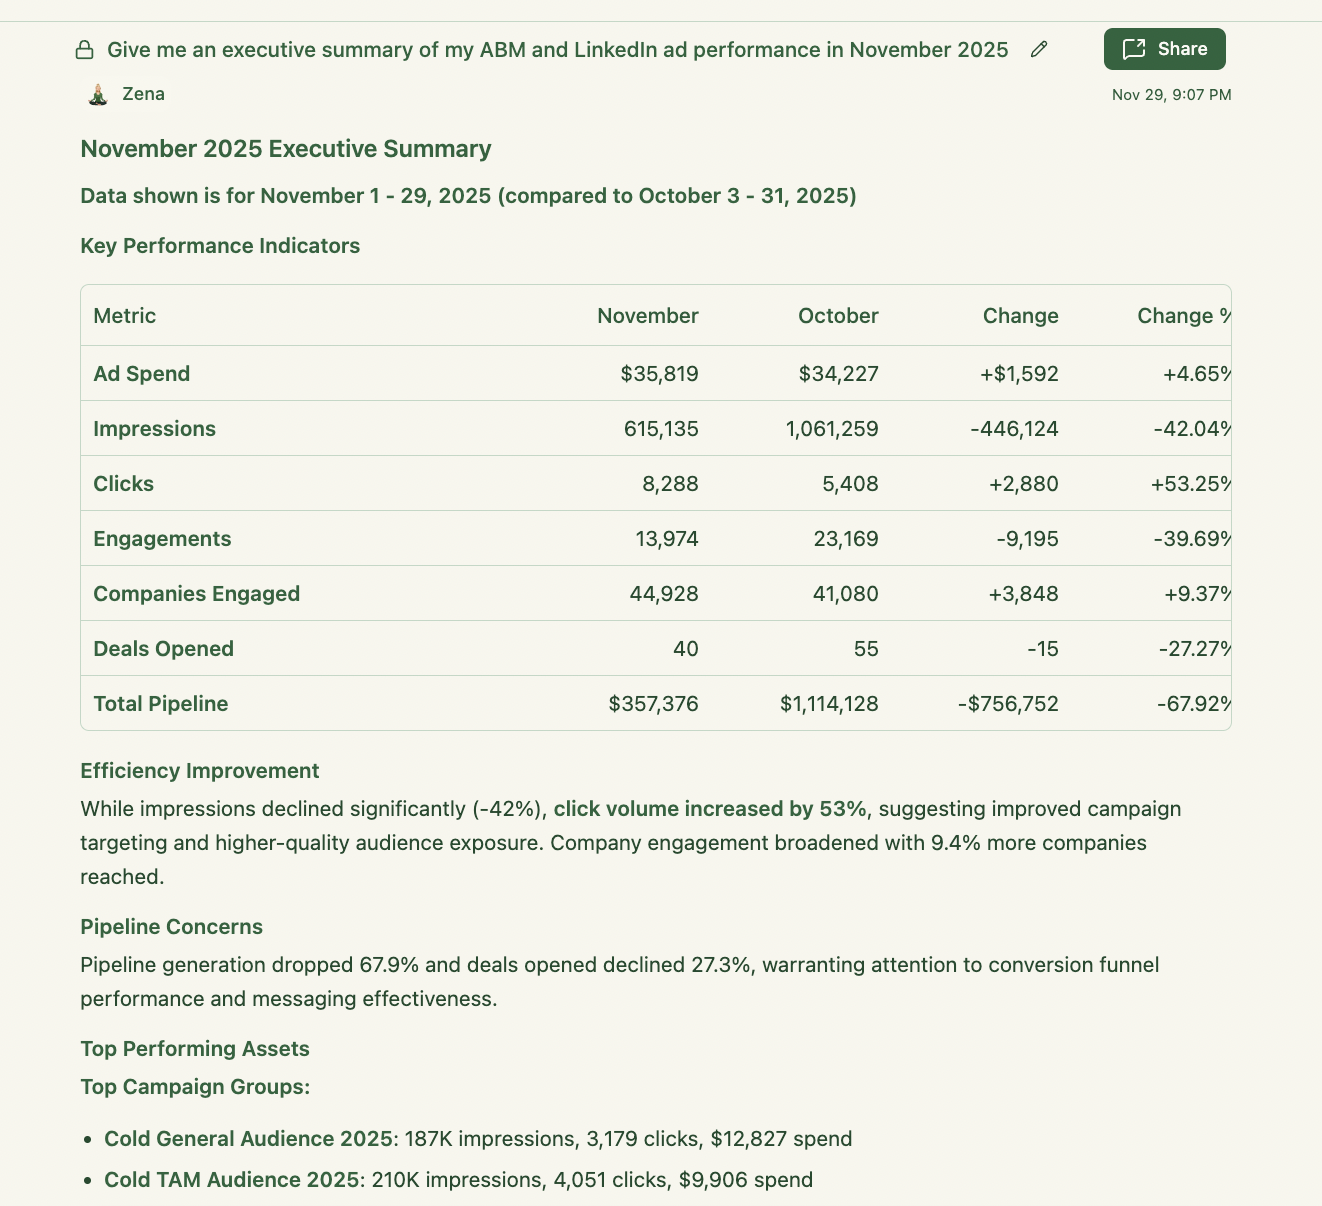
This is the part of the Monday routine Zena takes off your calendar entirely.
Every Monday, Zena has your weekly report ready and waiting when you open the dashboard; on the first day of the month it announces your monthly LinkedIn ABM report, and on the first day of the quarter, the quarterly one.
The report opens in a drawer over the dashboard, so the readout and the data it describes sit on the same screen.
Each summary answers the questions an exec review actually runs on: what happened in the ABM program this period, whether you are trending up or down on pipeline, deals created, closed-won, and pipeline per dollar spent compared to the last period, which LinkedIn campaigns contributed most to deal creation and to closed-won (measured as the most common touchpoint among those companies), which campaigns are becoming more or less effective on eCTR, and the top three risks and top three opportunities right now.
That is the same delta-plus-narrative structure as Report 5 in the prompt library, except nobody has to remember to run it.
Beyond the scheduled summaries, Zena continuously separates what is working from what is leaking, and it frames both as flags with the data behind each call.
The green flags are your scale list: which ads are driving the biggest eCTR increases, which ad formats are winning right now on eCTR, and which five accounts are surging in engagement or moving into the Interested and Considering stages.
The red flags are your fix list: which ads are decaying (Zena’s bar here is an eCTR decline four weeks in a row, deliberately stricter than the two-week early-warning check in Report 6, because a proactive alert should fire on certainty rather than suspicion), which campaigns have rising or stable spend but falling engagement, and which five accounts are hogging impressions and cost without engaging.
Each flag carries its action on the same surface: a decaying ad comes with the pause button, and an impression-hog account comes with the exclusion, so the distance between diagnosis and fix is one click.
On top of the flags sits a recommendation queue that answers the operator questions directly: which ads to pause, which campaigns should receive more budget, which companies to exclude, which campaigns need fresh creatives (based on how many decaying ads they contain), which accounts sales should prioritize immediately (the most clicks plus movement into Interested or Considering), and which accounts are receiving impressions despite not being on your target account list.

Zena’s proactive questions also change with the page you are looking at.
The short version of the map:
| Where you are | What Zena proactively surfaces there |
|---|---|
| Dashboard | The scheduled executive summaries, top formats and ads by eCTR and eCPC, the decay report, and the cost-efficiency ranking. |
| ABM campaigns | Which campaigns generated the most pipeline, deals, and pipeline per dollar spent, which are trending upward or losing momentum, and which are the most common touchpoint among open and closed-won deals. |
| ABM stages | Funnel movement (Aware to Interested, Interested to Considering), stalled accounts, average time in each stage, and which campaigns drive stage transitions. |
| Intents | Which companies showed the strongest buying intent and on which topics, which intent topics are trending, and which intent signals correlate with deal creation and closed-won. |
| Companies | Most engaged companies, first-time engagers, stage movers, spend and impression hogs, and which accounts need outbound now versus exclusion. |
| Ad sets and campaigns | Overspenders (most spend, least eCTR), decaying ad sets, account penetration, deal touchpoints, and which should be paused versus given more budget. |
| Job titles | Which personas engage most, which non-ICP personas are eating spend, and which ICP personas are underpenetrated. |
| Deals | Which campaigns and ad sets were the most common touchpoints before deals opened and closed, per deal and across the period. |
The safety model carries over: Zena proposes, you approve.
Nothing pauses, excludes, or changes serving state without your click.
That is the property that let me hand this to teammates who would never touch Campaign Manager settings, because the worst they can do is decline a good suggestion.
You can try Zena free without a full account setup, which is the fastest way to feel the difference between chatting with your data and reading a dashboard about it.

All three run on the same MCP data layer, so the question is never which has the data; it is what you want the output to be.
Here is how we split it:
| Surface | Best for | The trade-off |
|---|---|---|
| Claude Code | The full automated routine: chained reports written to dated files, charts generated by script, CLAUDE.md defaults, slash commands, and the four ABM skills | Terminal comfort required; the person running it needs a working folder and five minutes of setup |
| ChatGPT | Ad-hoc report questions in a chat window for teams already living in ChatGPT; same prompts, same data, over a custom connector | No file system, no slash commands, no skills, so the routine stays manual paste-and-run |
| Zena | In-app reporting for non-technical teammates: scheduled weekly, monthly, and quarterly exec summaries, benchmark-aware answers, green and red flags, and one-click pause and exclude recommendations | Lives inside ZenABM rather than your terminal, so it does not write files into your repo or chain with your other MCP servers |
My recommendation: run the weekly routine in Claude Code because the file history and the skills compound, give sales and leadership Zena because nobody has to teach them anything, and treat ChatGPT as the compatibility option for teams standardized on it.
If you want the deeper setup detail for the terminal route, the LinkedIn Ads Claude Code integration guide walks through it.
Automated reporting fails at the last step more than any other: the report arrives, everyone nods, nothing changes.
So this section is the discipline we attach to every output.
| What the report shows | Threshold we use | The move |
|---|---|---|
| Ad past 1,000 impressions with weak clicks | eCTR under 0.4% | Pause it. This is the kill threshold from our program, and it comes off without debate. |
| Two-week eCTR decline above the impression floor | 2+ consecutive weeks | Refresh: clone the message with new creative before pausing the original, so learning carries over. |
| Format with top eCTR and low eCPC | Best in the ranking with headroom | Scale: the freed budget from pauses goes here, not back into the average. |
| Company eating impressions without engaging | Over 5% of impressions, eCTR below program median | Exclude or cap it. This is the quietest budget leak in most accounts. |
| Account surging in engagement with clear intent topics | Acceleration over 2 weeks | Hand to sales this week, with the intent topics in the opener. |
Two disciplines sit on top of the table.
The last read is against the market, not yourself.
Deltas (changes) measure you against your own past, and benchmarks measure you against everyone else, which is the harsher and more useful grade.
The reference points we grade against: $5.21 median influenced pipeline per dollar spent (top performers reach $15.20) and 1.62x median ROAS, from the same 211-company dataset cited above.
If your program sits below the median pipeline per dollar for two consecutive months, the problem is usually structural (format mix or audience size), not creative, and that is when the audit skill earns its slot in the routine.

The real win in automating LinkedIn ads reporting is not the report arriving on schedule; it is the analysis and the recommended move arriving with it, so Monday starts with decisions instead of digging.
If you want to test that difference on your own numbers, ZenABM’s 37-day free trial covers the MCP server, the report skills, and Zena end to end.
You can also book a demo with us to know more!
AI can automate the data pull, the analysis, and the report writing end to end; the one step worth keeping human is approving changes. With an MCP server exposing your LinkedIn ads and CRM data, an agent like Claude Code chains the weekly analyses into one report file from a single saved prompt, and Zena delivers scheduled weekly, monthly, and quarterly executive summaries plus proactive flags in-app. Write actions such as pausing an ad stay behind an explicit confirmation, which is the design I recommend keeping.
It depends on whether you want delivered dashboards or automated analysis. Dashboard tools schedule PDF exports but leave the interpretation to you. For analysis-level automation on ABM programs, the deciding factor is company-level engagement data joined to your CRM, which is the layer ZenABM provides through its MCP server, the Zena agent, and the free /linkedin-abm-report skill, starting at $59 a month per current pricing.
Yes, through a custom connector pointed at an MCP server such as the ZenABM one at https://zenabm.com/mcp. Once connected over OAuth, ChatGPT answers the same report prompts as Claude Code: format rankings by eCTR, decaying ads, account cohorts, and period deltas. The difference is workflow: ChatGPT has no file output or slash commands, so recurring routines stay manual, while Claude Code saves them as reusable commands and skills.
No, not in the setup this guide describes. Read queries never alter your account state. The write tools that do change things (updating an ad or campaign status) are flagged as destructive, so the agent proposes the change and waits for your explicit approval before executing. Zena follows the same model in-app: it recommends pauses and exclusions, and nothing happens until you click to confirm.
Lead with eCTR (effective click-through rate to your landing page) and eCPC (effective cost per landing-page click), because they measure the click you are actually buying and Campaign Manager shows neither. Around them: spend, landing-page clicks, influenced pipeline, pipeline per dollar, ROAS, ABM stage movement, and the account-level reads (top engaged companies, first-time engagers, intent topics). Grade the numbers against published benchmarks, like the $5.21 median pipeline per dollar from ZenABM’s 211-company report, so every figure carries a verdict.
The stack in this guide is free to assemble end to end: the skills are open source, the prompts are above, and ZenABM with its MCP server and Zena is fully functional for 37 days without a card. Wire the server, save the six prompts, and run your first Monday routine this week; the report you get will already point at two or three moves worth making, and that is the entire test of whether reporting automation is working.
Start your free trial now or book a demo with us to know more!
