©2026 ZenABM - All Rights Reserved.

If you are running LinkedIn ads for account-based marketing (ABM), your LinkedIn Campaign Manager dashboard is not enough.
Campaign Manager can tell you impressions, clicks, CPC, CPM and spend, but your CRM can tell you deals, pipeline and revenue, and neither one shows the full account journey from LinkedIn ad impression to engagement to ABM stage movement to pipeline to closed revenue.
This post is a walkthrough of how I think about a LinkedIn ads dashboard for ABM:
Also, you can read the detailed articles on how we think about LinkedIn ABM in the ultimate guide to running ABM on LinkedIn (based on a real campaign) and the LinkedIn ABM benchmarks report.
Short on time?
Here’s a quick overview:
![]()


Campaign Manager is useful for ad operations but weak for ABM reporting.
The default dashboard covers delivery mechanics well enough, showing things like impressions and reach, clicks and CTR, CPC and CPM, spend and conversions, and high-level demographic breakdowns by job title, industry and seniority.
That is good for media buyers, but it does not come close to answering the questions an ABM lead actually cares about.
Tim Davidson (founder at B2B Rizz) called out this exact gap when LinkedIn started slipping new columns into the Companies tab.
“Ooohlala, LinkedIn sneaking in a couple two tree new columns to the companies tab. Paid conversions and paid qualified leads. Which is pretty awesome as it gives us more insights, especially the paid conversions, love that. If we were able to drill down into them. Right now, it looks like it’s all conversions and both click and view, which isn’t too helpful unless you have one conversion action. But love the first step here.”
– Tim Davidson, B2B Rizz, on LinkedIn.

That captures the state of the Companies tab in 2026 well: it is moving in the right direction, but still does not give you account stages, intent themes, view-through pipeline or campaign-level ROAS. For that, you need a layer above Campaign Manager.
My strong opinion here is that Campaign Manager tells you how ads performed (even that is incomplete), not whether your ABM program is working.

CRMs are built around contacts, companies, deals, lifecycle stages and sales activity, which means they are not designed to ingest and interpret LinkedIn ad engagement at the account level.
When teams try to build a LinkedIn ads dashboard inside HubSpot or Salesforce, they hit the same gaps every time: no native company-level LinkedIn impressions, no clean view-through attribution, no ad engagement broken down by campaign theme, no automatic ABM stage movement based on ad data, no account-level ad journey timeline, no easy way to calculate pipeline per dollar by LinkedIn ABM campaign, and no simple way to report which companies are warming up before they fill in a form.
The native integration can pull LinkedIn ad metrics into HubSpot, but it does not solve company-level ABM reporting, so you still cannot easily answer the question “which accounts saw this campaign theme three or more times this month and how many of them opened pipeline.”
HubSpot or Salesforce can store ABM data, but they should not be expected to create LinkedIn ABM intelligence on their own.
If I am designing a LinkedIn ads dashboard for ABM from scratch, I want six blocks of information on the same page, because each block answers a fundamentally different question about your program.
The ad metrics block answers “Are we delivering?” covering impressions, clicks, engagements and ad spend.
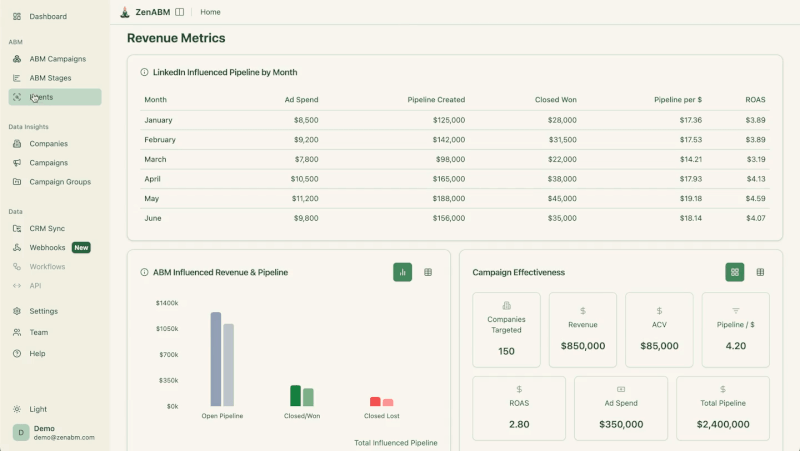
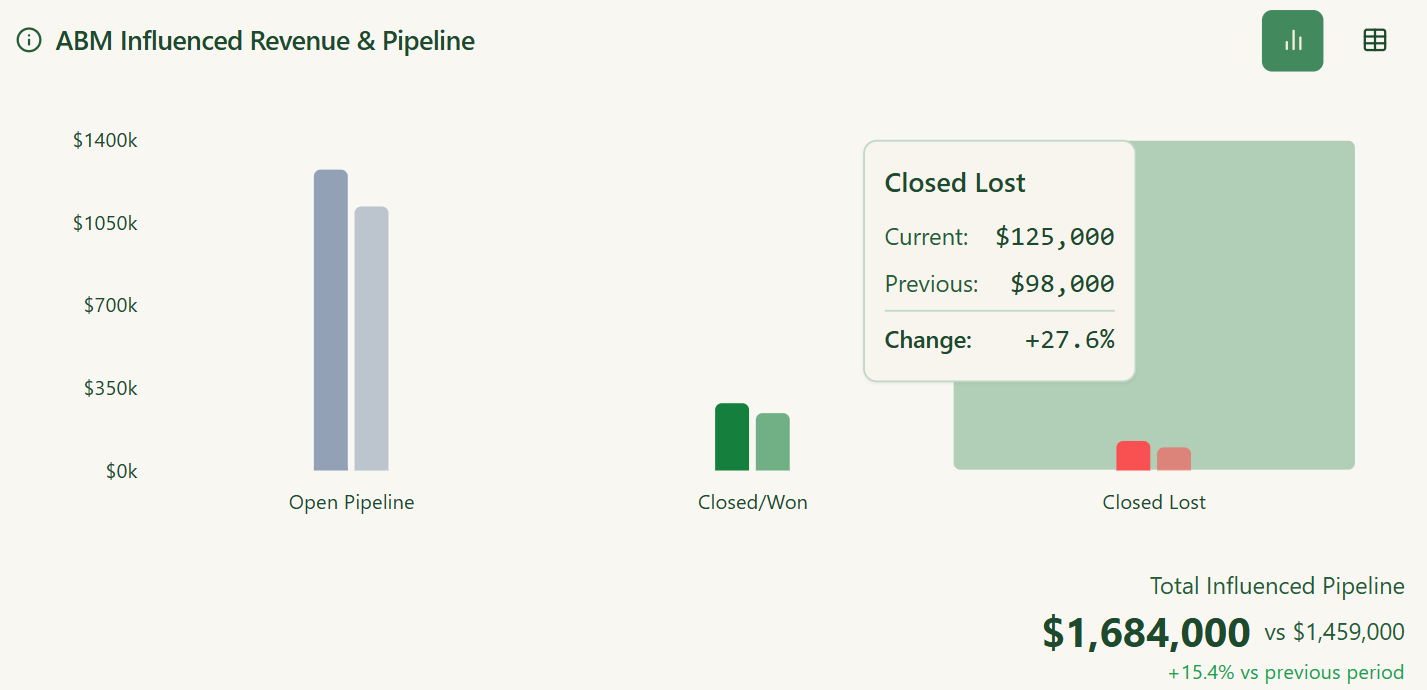
The revenue block answers “Is it working?” covering the LinkedIn-influenced pipeline by month, pipeline created, closed-won revenue, closed-lost pipeline, ROAS and pipeline per dollar.
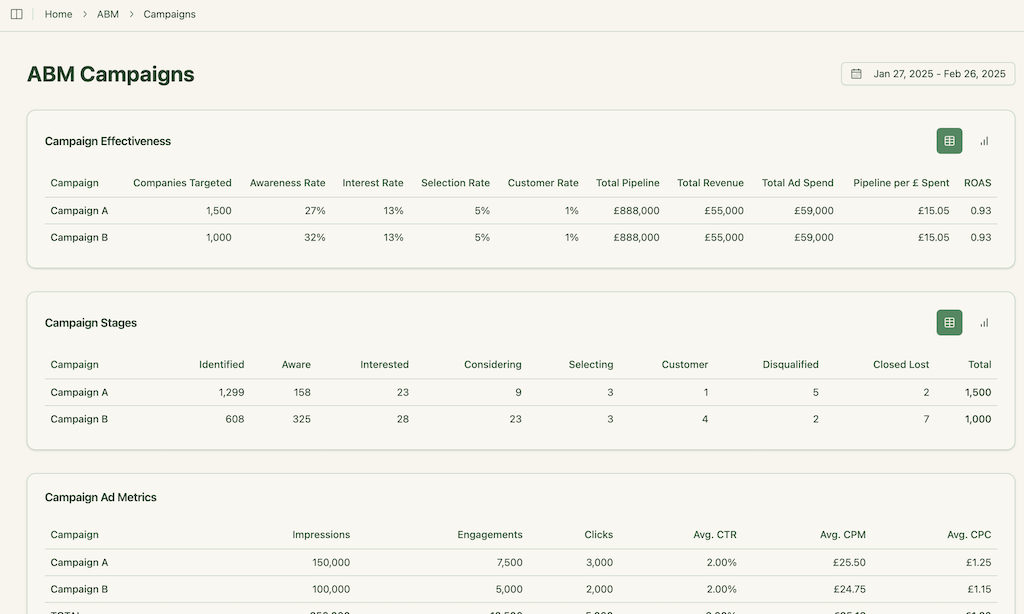
The campaign effectiveness block answers “Which campaigns drive outcomes?” covering companies targeted, revenue, ACV, total influenced pipeline and pipeline per dollar by campaign.
The ABM stage block answers “Are accounts moving?” covering companies in each stage, stage movement this period, stage conversion rates and accounts stuck in a stage.
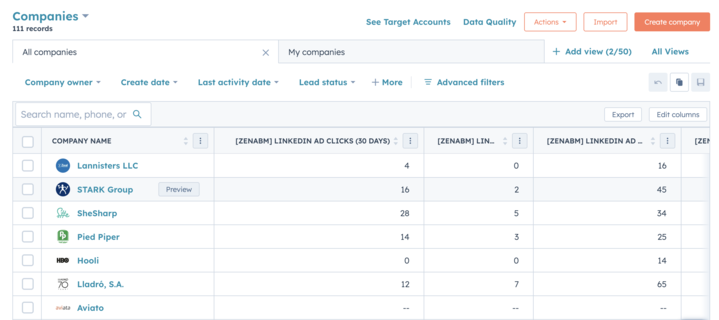
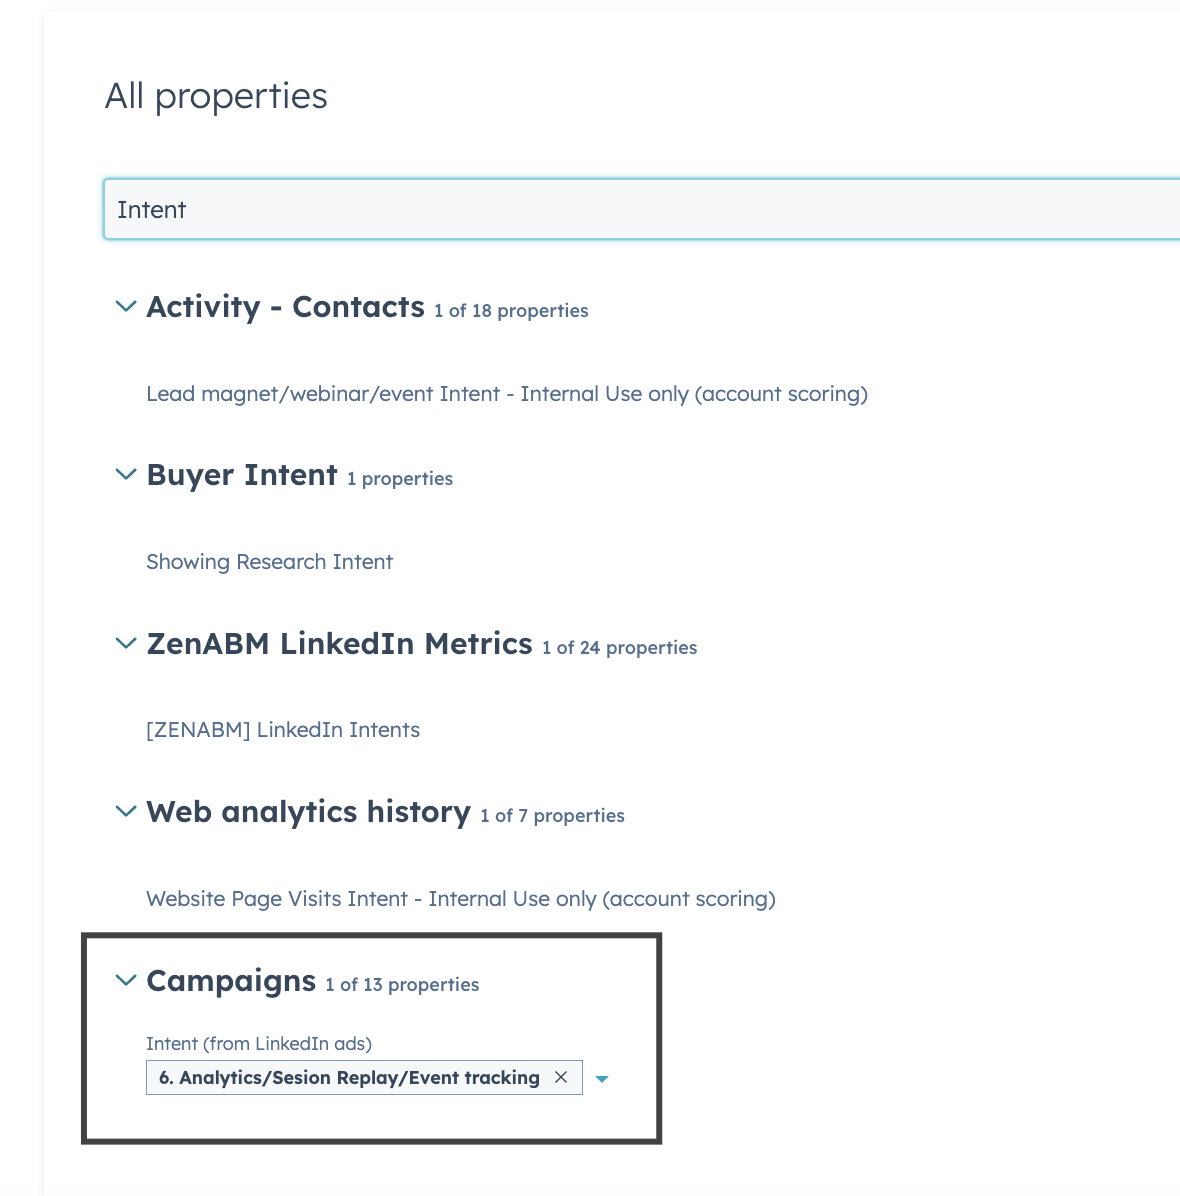
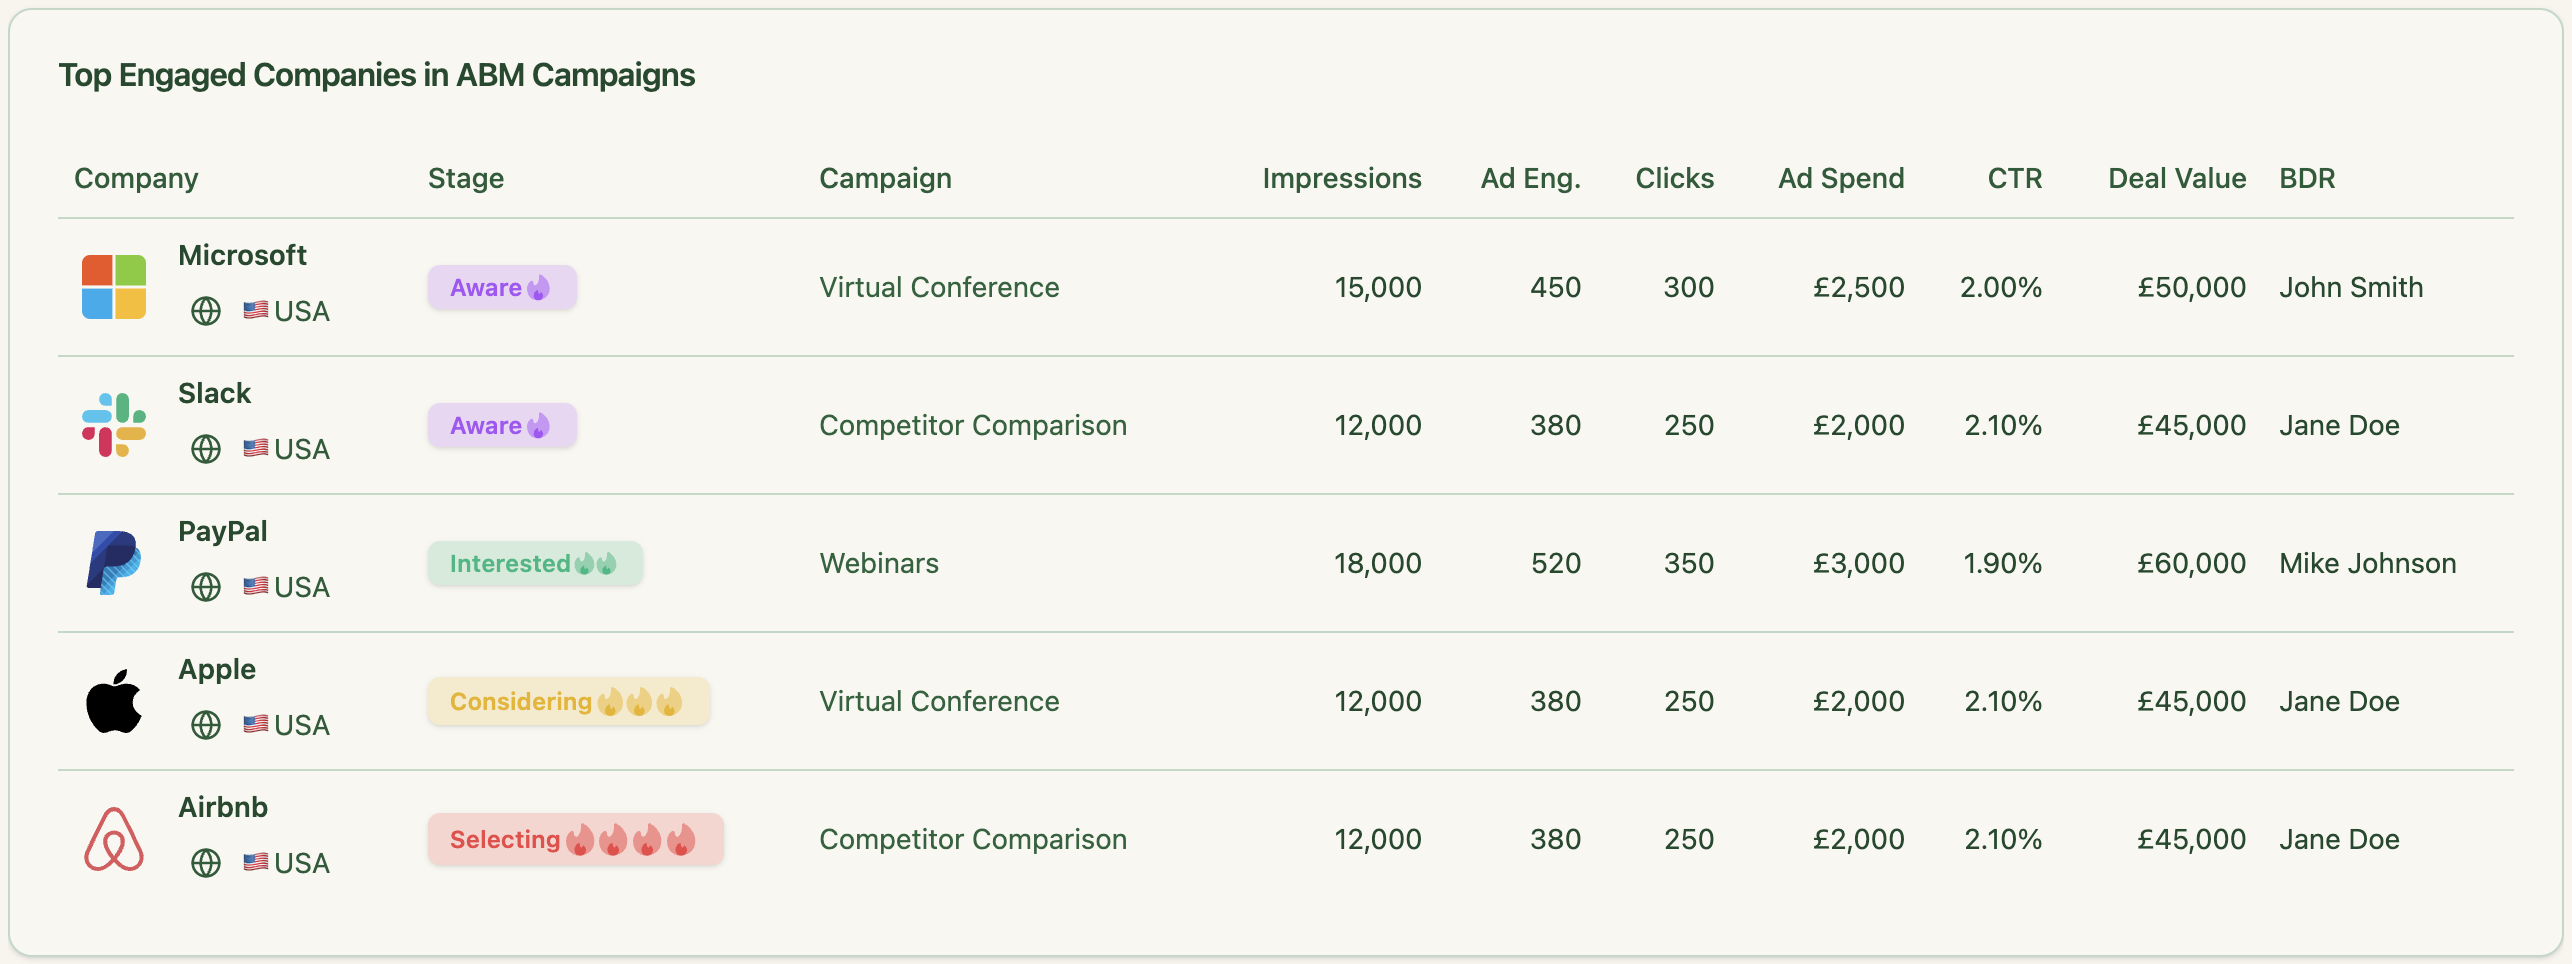
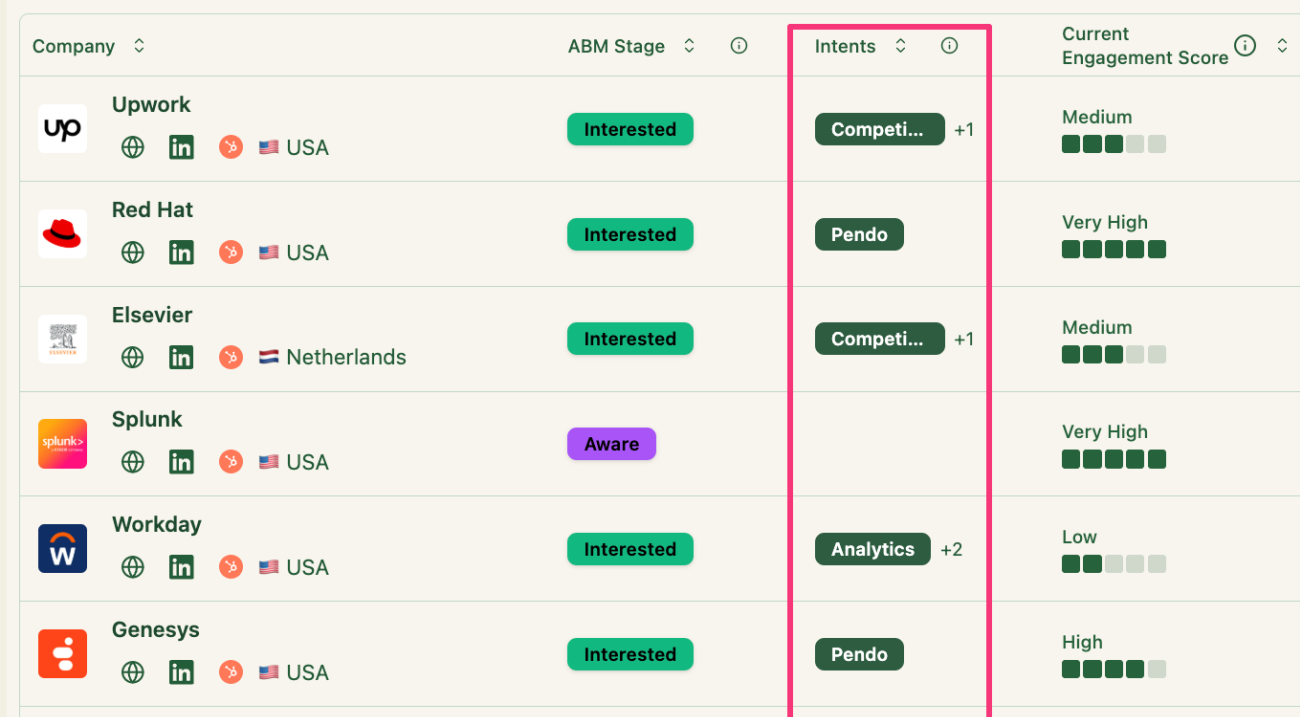
The top engaged companies block answers “Which accounts should sales call this week?” covering company name, current ABM stage, intent, ABM campaign, lifetime engagement score, impressions, engagements and clicks.
The AI insights block answers “What should we do next?” covering best and worst campaigns, expensive or fatigued campaigns, top engaged accounts, benchmark comparisons and optimization recommendations.
Most teams have one or two of these blocks scattered across Campaign Manager, a CRM dashboard and a Looker Studio file.
The job of a LinkedIn ABM dashboard is to put all six in one view, which is what makes it possible to answer pipeline questions without assembling data from three different tools.
Here is the structure I use for the dashboard inside my own program with the help of ZenABM, because the block order reflects the sequence of questions you actually need to answer, from delivery to revenue to account movement to individual account priority.


Top filter bar:
LinkedIn ad metrics block:
Zena AI assistant:
Revenue metrics:
Campaign effectiveness:
ABM campaign performance:
Top engaged companies:
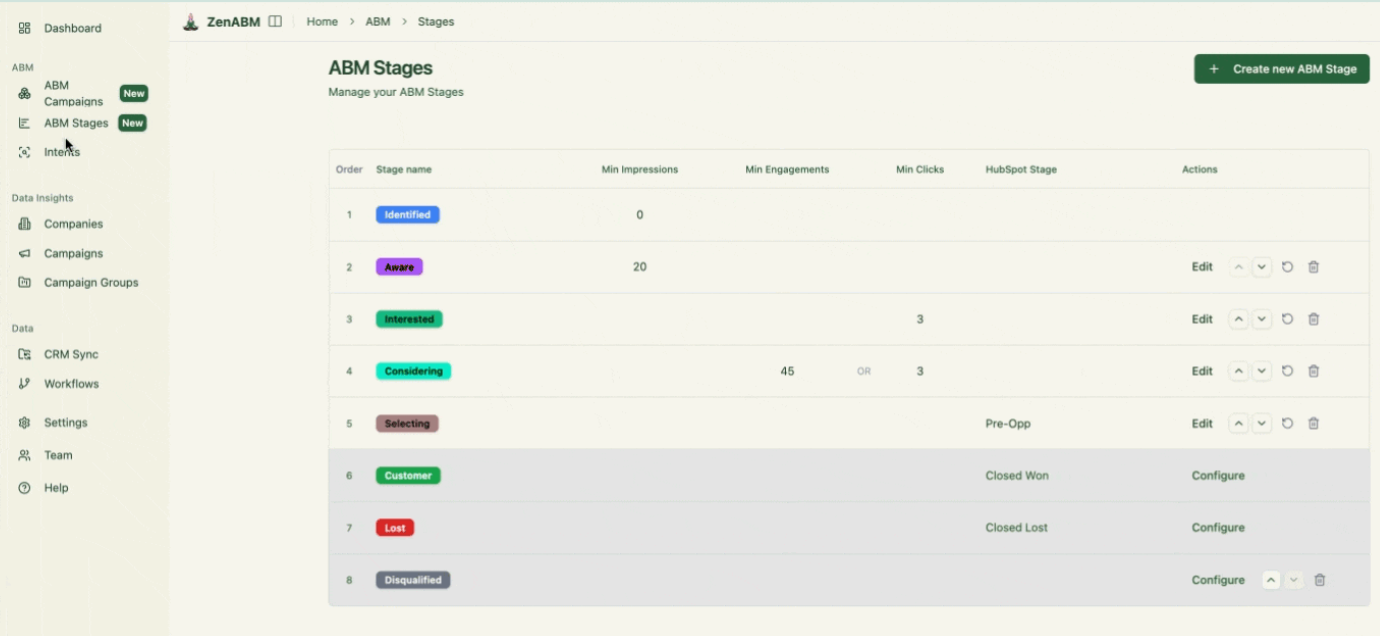
If your dashboard does not show account stages, it is a LinkedIn Ads dashboard rather than a LinkedIn ABM dashboard, because stages are how you turn raw ad metrics into a story about pipeline movement.
The model I use inside ZenABM looks like this:


The dashboard should show how many accounts sit in each stage right now, how many moved stages this period and in which direction, which accounts are stuck, which campaigns move accounts forward, and which stages convert into pipeline.

This is also the layer that lets you bring marketing and sales into the same conversation, because sales can see exactly which accounts are warming up before a rep ever reaches out.
The point of the dashboard is to make the movement visible, not just the totals.
![]()

Static dashboards are useful on day one and ignored by week three, because nobody has time to scroll through 30 widgets looking for the insight that matters.
That is why ZenABM built Zena AI on top of the LinkedIn ABM dashboard inside ZenABM, so the team types questions and Zena answers from live data rather than exporting a CSV and building a pivot table.
Things like:
Ali Yildirim went through the same shift on his agency side.
After his team wired LinkedIn data into a custom MCP, the way they reported on accounts changed completely.
“Instead of exporting data and manually building dashboards, I can ask Claude a question and get the answer instantly. The tool connects directly to LinkedIn’s API and pulls campaign data in real time. I can see exactly which company sizes, industries, and seniorities are seeing our ads, then spot optimization opportunities on the spot. Now I can see that pattern in seconds instead of digging through reports for hours.”
– Ali Yildirim, Understory, on LinkedIn.
Ali’s post points to the same shift: dashboards show what happened, while AI explains what changed, why it matters and what to do next.
The future of LinkedIn ads dashboards is not just prettier charts but AI-powered analysis layered on top of clean ABM data.
I went deeper on this in my piece on how to analyze your LinkedIn ads performance with AI (using ZenABM’s analytics agent, Zena AI).
Campaign Manager and CRMs each cover half the picture, and the missing half is consistent across every program I have audited.
Campaign Manager can say an ad got 500 clicks, but a LinkedIn ABM dashboard should say which target companies clicked, what stage they are in, what intent they showed and whether they later opened a pipeline.
The complete list of what Campaign Manager is missing:
Maximilian Herczeg (ex-LinkedIn) made this point about the underused list-based view inside Campaign Manager in his post.
“My client and I spent a considerable time ironing out the target audience for their LinkedIn ads. We used Sales Navigator to create a company list, pulled it and then uploaded it to the campaign manager. It shows how engaged each business is with you, being a mix of organic and ad engagement, how many impressions each company received and which ones you haven’t reached yet. This is a golden add on if you don’t have sophisticated tracking software, plus for sales. It’s a dynamic list you can share with your sales people and they can reach out to highly engaged companies.”
That list view is a good start, but it is also painful to maintain across multiple campaigns and accounts, and it does not push anything into your CRM.
The CRM has the opposite problem: it knows about deals and contacts but has very little to say about ads. CRM dashboards become useful for ABM only when something pushes good ad data into them, because the raw ingredients are not there by default.
The pieces typically missing include raw LinkedIn impressions by company, LinkedIn ad clicks and engagements by company, campaign theme engagement, LinkedIn-driven account stage changes, clean view-through attribution, ad spend tied to an ABM campaign object, and easy comparison of ad engagement against pipeline.
That is the gap ZenABM closes. It pushes impressions, clicks, engagements, campaign names, ABM stage, account score, intent and influenced pipeline into the CRM, so the CRM can act as the system of action while ZenABM serves as the LinkedIn ABM intelligence layer that feeds it.

Here is what happens behind the scenes when I open the LinkedIn ads dashboard inside my own ZenABM account, because understanding the data pipeline makes it easier to trust the numbers on the screen.
Native LinkedIn/HubSpot integration is fine for basic ad management.
ZenABM is for teams that need ABM reporting, account scoring, intent and revenue attribution in a single dashboard, with an AI layer that lets the team query it all without opening a spreadsheet.
Here is the full list of metrics I would expect on a serious LinkedIn ABM dashboard, grouped the way I think about them.
You do not need every metric on the home screen, but knowing which ones exist means that when sales asks “which accounts engaged with the security campaign and opened pipeline,” you have an answer that does not start with “let me export a CSV.”
| Block | Metrics |
|---|---|
| Ad delivery | impressions, clicks, engagements, CTR, CPC, CPM, spend |
| ABM engagement | target accounts reached, companies engaged, companies clicked, current engagement score, lifetime engagement score, persona and job-title engagement |
| ABM stages | accounts in Identified, Aware, Interested, Considering, Selecting, Customer, Lost; stage movement; stage conversion |
| Revenue | influenced pipeline, pipeline created, closed-won, closed-lost, ROAS, pipeline per dollar, ACV |
| Optimization | best and worst campaigns, expensive campaigns, high-frequency ads, fatigued ads, account movement by campaign, pipeline by intent theme |
Almost every LinkedIn ABM dashboard I have audited makes at least three of these mistakes, and most of them come down to treating LinkedIn like a paid social channel rather than an ABM pipeline channel:
A LinkedIn ads dashboard is useful.
A LinkedIn ABM dashboard is much more powerful because it shows not just how ads performed but which accounts engaged, what stage they are in, what intent they showed and whether they became pipeline.
CRMs and Campaign Manager both miss important parts of that journey; native integrations close some of the gap and stop short of the rest; and ZenABM brings the data together at the company and campaign levels so the team can stop reporting on LinkedIn ads like paid social and start managing them like an ABM pipeline channel.
Some common questions about LinkedIn ads dashboards and their answers:
It is a single view that combines LinkedIn ad delivery metrics, account-level engagement, ABM stages, intent and CRM pipeline. A pure LinkedIn ads dashboard inside Campaign Manager only covers delivery, while an ABM version adds the account journey and revenue layer on top so you can see which companies are moving through your funnel and whether ad spend is generating pipeline.
Partly. CRMs are great at storing deal and contact data but do not natively ingest LinkedIn impressions and engagement at company level. The native LinkedIn integration brings in some ad metrics, but you still need a layer like ZenABM to push company-level engagement, ABM stages and intent into the CRM. I covered this in the LinkedIn ad performance into HubSpot guide.
Five blocks: ad delivery (impressions, clicks, CTR, CPC, CPM, spend), ABM engagement (companies reached, engaged, clicked, engagement score), ABM stages (accounts per stage, stage movement, conversion), revenue (influenced pipeline, ROAS, pipeline per dollar, ACV), and optimization (best and worst campaigns, fatigued ads, pipeline by intent theme).
Campaign Manager is built for ad delivery and does not show ABM stage movement, view-through influenced pipeline, intent by campaign theme or pipeline per dollar at the campaign level. The Companies tab is a step in the right direction, but it does not push data into a CRM or replace a real ABM reporting layer, so it remains a supplementary view rather than a complete ABM dashboard.
Campaign Manager is for ad ops. ZenABM is the ABM dashboard built on top of it, ingesting company-level LinkedIn data, assigning ABM stages, calculating pipeline per dollar and ROAS, syncing everything to HubSpot or Salesforce, and letting the team query the data with Zena AI. See the deeper view in the ultimate guide to running ABM on LinkedIn.