

©2026 ZenABM - All Rights Reserved.

Most LinkedIn accounts are not broken.
They are leaking.
A handful of ad sets quietly overspend, two or three accounts absorb impressions without ever clicking, and a couple of creatives that worked in April are still running in June at half the click-through rate.
A LinkedIn ad performance audit with Claude Code surfaces that leak in about 30 minutes, without exporting a single CSV or clicking through the Campaign Manager tab by tab.
This is not the full account audit, though.
It does not cover tracking, account structure, bid strategy, Audience Expansion, or attribution.
This post is laser-focused on the two things that move the number fastest: finding wasted spend and finding weak creatives, then reallocating the budget reclaimed from losers into the winners already running.

Short on time?
Here’s a quick summary:
A LinkedIn ad performance audit is a diagnostic, not a report.
The job is to answer one question: where is money going that should not be, and where should it go instead.
Running that in a dashboard means opening Campaign Manager, sorting by spend, cross-referencing the demographics tab, exporting to a sheet, building a pivot, and then repeating the whole sequence next week.
By the time that process completes, the data has already moved.
Running it in Claude Code collapses that into a conversation.
Connect the ZenABM MCP server once (a five-minute OAuth step covered on the MCP setup page), and from that point Claude Code can read companies, campaigns, ad sets, creatives, job titles, deals, and intent signals on demand.
It selects the right tools from 60+ available options, pulls live data, and returns a structured answer.
Read questions change nothing in the account, and any write action, such as pausing an ad requires explicit confirmation before anything executes.


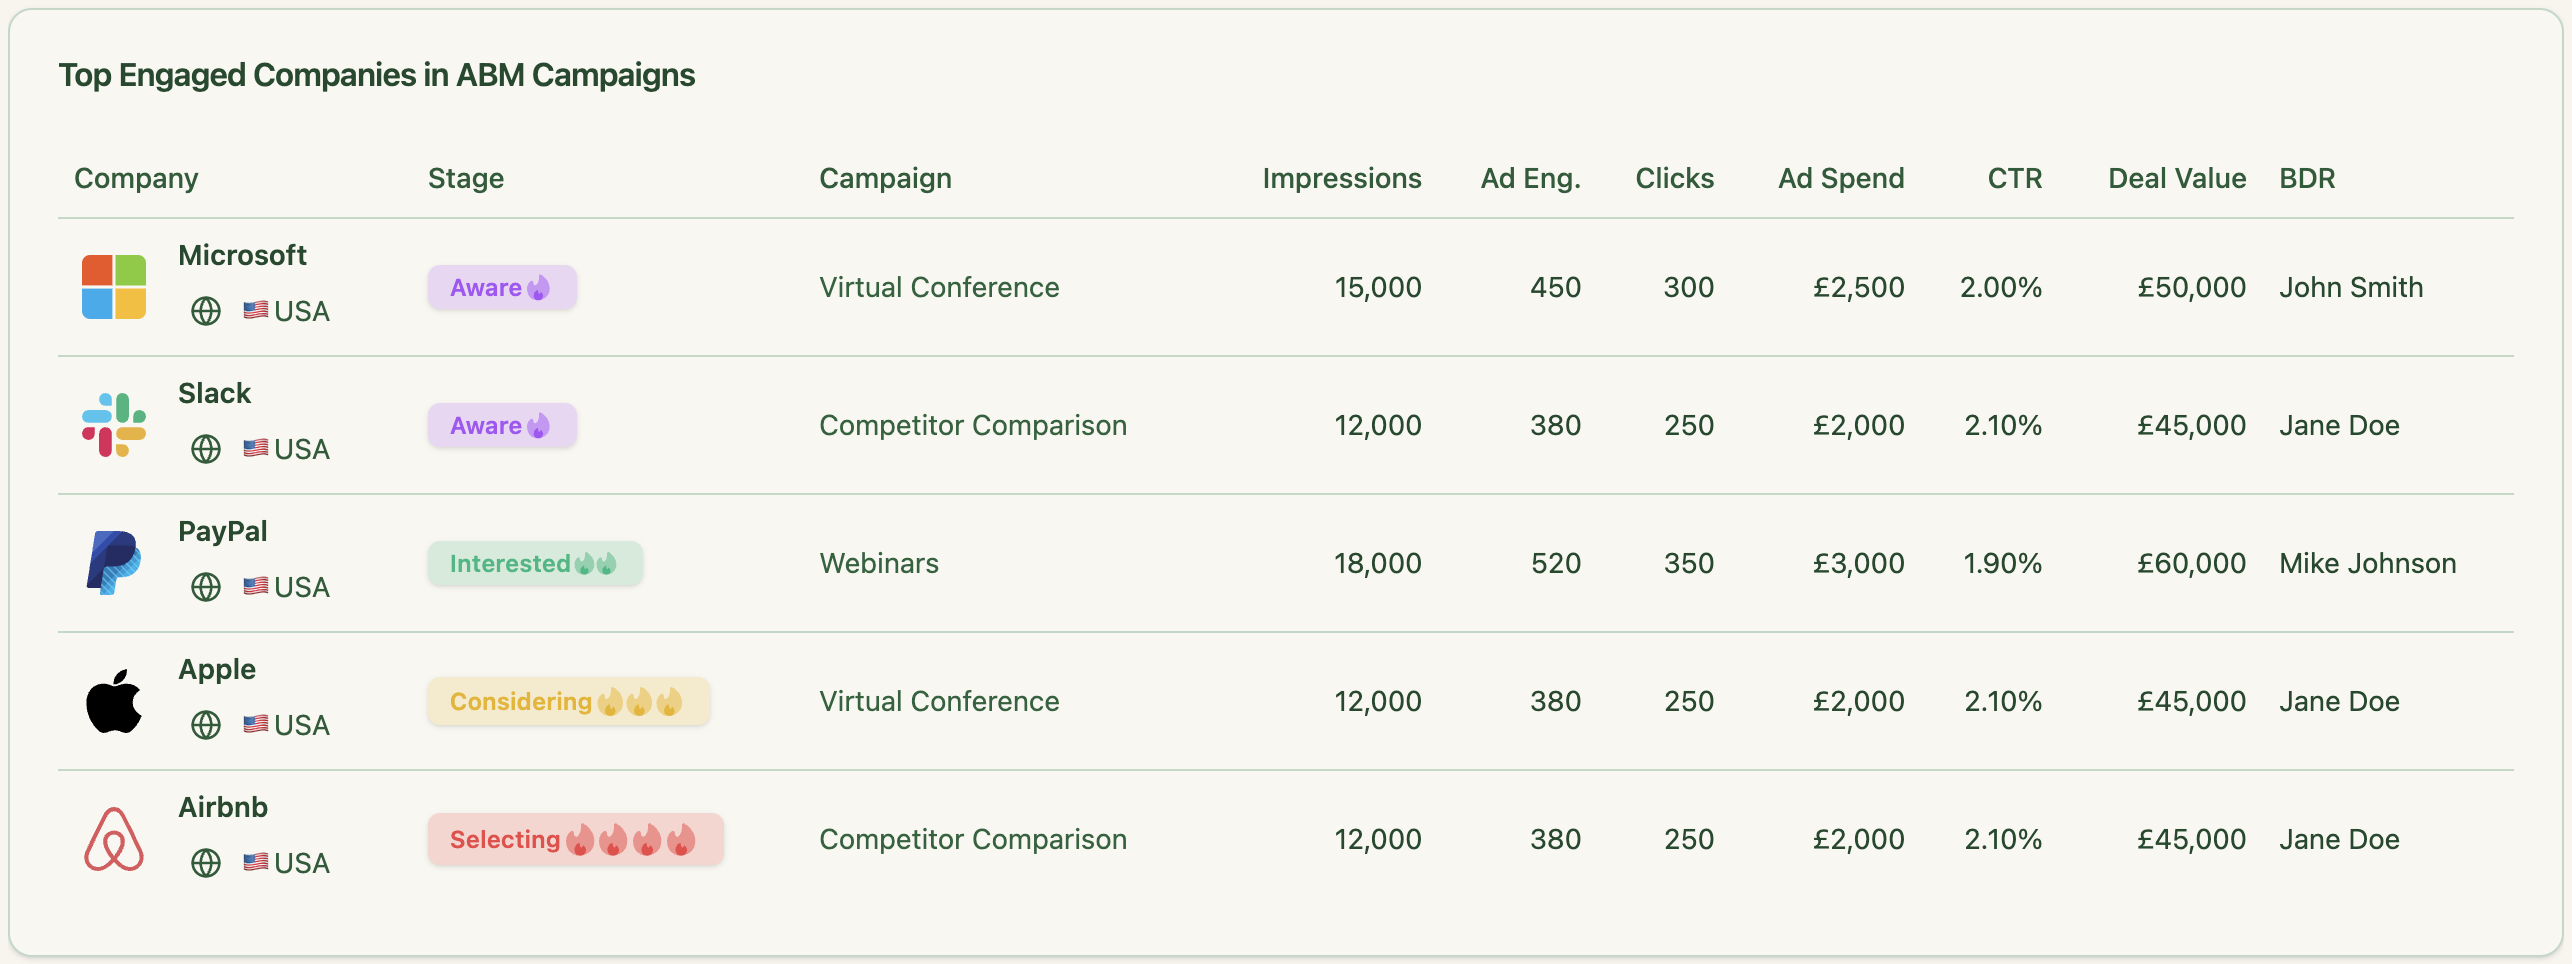
ZenABM, by the way, is able to provide these capabilities via its MCP server because it connects to the official LinkedIn Ads API to pull company-level ad-engagement data for each ad creative, campaign, and broader ABM campaign. Also, it connects to your CRM to match ad-engaged companies with the deals in your CRM to provide closed revenue attribution, essential for any meaningful performance audit.

The reason this matters for a performance audit specifically is that the waste is rarely in one obvious place.
It is spread thin across a dozen ad sets, a few impression-hog accounts, and three tired creatives.
Surfacing it requires asking a sequence of pointed questions and following the thread, which is what a conversational interface handles well and a dashboard does not.
One note on scope before going further. If a tracking gap, a broken conversion, or an Audience Network setting bleeding spend turns up during this audit, that is a signal to run the broad audit, not to fix it here.
This 30-minute pass is about spending and creatives.
Keeping it narrow is what makes it possible to actually finish.
Starting with spend is the fastest win.
There are five places budget leaks on LinkedIn, and each has a prompt.
Run them in order.
The numbers drive the decisions, not the prose.

The first leak is ad sets that spend a lot and return little.
Sorting by spend alone hides this, because a high-spend ad set can still be efficient.
The fix is to cross-reference spend with eCPC, so the expensive-and-inefficient ones float to the top.
Audit my LinkedIn ad sets for wasted spend over the last 30 days. List every ad set with: spend, impressions, clicks, CTR, landing-page clicks, eCTR, and eCPC. Sort by eCPC descending. Flag any ad set whose eCPC is more than 2x the account median eCPC AND whose spend is in the top third of the account. Those are my overspending, inefficient ad sets. Show me the account median eCPC for reference.
How to read it: the flagged rows are the first reallocation candidates. An ad set paying 2x the median for each landing-page click is donating money. Before pausing, check landing-page clicks: if it is expensive but still driving real clicks at volume, it may be a brand or awareness play worth keeping. If it is expensive and barely clicking, it goes on the pause list.

This is the leak almost nobody checks, and it is often the biggest.
On account-list and ABM campaigns, a tiny number of large companies can absorb most impressions while the rest of the list sees almost none, so the program pays to show ads to accounts that never engage, while the majority of the target list gets scraps.
The prompt to use:
Find my impression-hog accounts over the last 30 days. List companies by total impressions served, descending. For each: impressions, clicks, landing-page clicks, eCTR, and estimated spend. Flag any company that received more than 5% of total program impressions but has an eCTR below the program median. Those are eating budget without engaging – candidates to exclude or impression-cap.
How to read it: a company at the top of the impression list with a near-zero eCTR is a pure leak. Excluding it or capping its impressions lets the budget redistribute to accounts that actually click.
This is the single change that most often pays for itself, because the spend freed up was producing nothing.
Even with the right account list, it is easy to pay to reach the wrong people inside those accounts. LinkedIn targeting bleeds into adjacent titles, and spend piles up on personas who will never buy. The fix is to audit spend by job title against conversions.
Adam Robinson, founder of RB2B, published a persona-level breakdown in his LinkedIn post that shows the problem precisely.
“Persona breakdown: Sales Persona – $819 spent, 0 conversions. Founder Persona – $822 spent, 12 conversions at $68.56. Marketing Persona – $600 spent, 3 conversions at $200.30. Outbound Agency Persona – $797 spent, 7 conversions at $113.98.”
That $819 on the Sales persona at zero conversions is exactly the kind of line a dashboard buries.
Here is the prompt to surface it for any account:
Break down my LinkedIn ad spend by job title / persona over the last 60 days. For each persona: spend, landing-page clicks, eCPC, and any influenced deals or conversions. Flag personas that are NOT in my ICP, and any ICP persona spending real budget with zero or near-zero conversions. Tell me which titles to exclude and roughly how much budget that frees up.
How to read it: any non-ICP persona with meaningful spend is an exclusion candidate. Any ICP persona with spend and no conversions deserves a second look at the creative or offer before cutting it, because the persona may be right even when the result is not.
The slowest leak is the most expensive over time.
An ad that launched strongly can slide for weeks before anyone notices, because the decline is gradual and the dashboard only shows a snapshot.
Every week it runs at a falling eCTR, the algorithm charges more per click and another slice of the budget is wasted.
Run a decaying-ads report. Identify every ad whose CTR or eCTR has declined for 2 or more consecutive weeks while serving more than 1,000 impressions per week. For each: the weekly eCTR trend, current eCPC vs. the eCPC when it launched, and total spend during the decline. Rank by wasted spend (spend during the declining period). Recommend pause or refresh for each
How to read it: the “spend during the declining period” column is the wasted-spend number. An ad that has cost $600 over three declining weeks is the textbook case for a pause-or-refresh. At typical B2B spend levels, a single fatigued creative can quietly waste $500 to $800 a week, and the CPC inflation compounds the longer it runs.

Once the four prompts above have run, ask Claude Code to total the findings with this prompt:
Add up the total monthly spend across everything we just flagged: overspending ad sets, impression-hog accounts, non-ICP job titles, and decaying ads. Give me one number for “reclaimable monthly spend” and a short list of the specific changes that produce it.
That single number is what makes this audit worth running.
It turns a vague sense that something is off into a concrete figure that can be reallocated this week.

Spend leaks are usually structural.
Weak creatives are the other half of the LinkedIn ad performance audit, and they need a different lens.
A creative is not “bad” in a vacuum: it is bad relative to what else is running and relative to how that format usually performs. Here is how to pull the weak ones out.

Fatigue is the decay covered in the spend section, viewed from the creative side.
The decaying-ads report finds ads that are sliding; this prompt surfaces the reason, so the decision between refresh and retire can be made with data.
In small B2B audiences, fatigue can set in within about three weeks of launch, so the trend line matters more than any single week’s number.
For my top 15 ads by spend, show the weekly eCTR trend over the last 6 weeks. Identify which ones peaked early then declined (classic fatigue) vs. which never performed (weak from launch). For the fatigued ones, tell me how many weeks past peak they are. For the never-performed ones, flag them as kill candidates.
How to read it: separate fatigue from weakness. A fatigued ad earned its keep and needs a fresh variant of the same idea. An ad that never performed is a different problem and should be cut rather than refreshed. Rotating creative roughly every three to four weeks is the cadence that keeps fatigue from compounding on LinkedIn’s smaller audiences.
The most common mistake here is comparing a video’s 0.24% CTR to a Thought Leader Ad’s 2.68% and concluding the video is weak.
These are different formats with different jobs and wildly different baselines. Each format should be benchmarked against its own norm, not against others.
For reference, the ZenABM median benchmarks by format are:
| Format | Median CTR | Median CPC |
|---|---|---|
| Thought Leader Ads | 2.68% | $2.29 |
| Single image | 0.42% | $13.23 |
| Carousel | 0.32% | $13.30 |
| Video | 0.24% | $15.61 |

The prompt to use:
Group my ads by format (single image, video, carousel, Thought Leader Ads, document). Within each format, rank ads by eCTR and eCPC. Flag any ad performing in the bottom 25% OF ITS OWN FORMAT. Compare each format’s median to these benchmarks: TLAs 2.68% CTR / $2.29 CPC, single image 0.42% / $13.23, carousel 0.32% / $13.30, video 0.24% / $15.61. Tell me which formats are underperforming their benchmark and which individual ads drag each format down.
How to read it: two outputs matter here. The format-level read shows whether a whole format is below its benchmark, which points to a creative or targeting problem for that format. The ad-level read identifies which specific creatives drag their format down, and those are the individual refresh candidates.
Video lives or dies on the opening. If the first three seconds do not stop the scroll, the rest of the production is wasted, and the $15.61 median CPC applies to every impression regardless. The video audit is therefore really a hook audit.
The prompt to use:
For all my video ads over the last 60 days, show: video views, average percent watched / view-through rate, landing-page clicks, eCTR, and eCPC. Rank by view-through rate. Flag videos with a sharp drop-off in the first portion of the view (weak hook) vs. videos people watch but don’t click (weak CTA). Tell me which is a hook problem and which is a CTA problem.
How to read it: low view-through with high spend means the hook fails and the opening needs to be re-cut. High view-through but low eCTR means the hook works, but the CTA or offer fails, which is a different fix. Refreshing the whole video when only the first three seconds are broken wastes the production that already works.
TLAs are the most efficient format by a wide margin (77% cheaper per landing-page click than single image in ZenABM data), but only when the right person fronts them.
The same copy from a different author can swing performance significantly, because TLAs trade on the face and voice.
That makes the audit an author audit, not just an ad audit.
The prompt:
For my Thought Leader Ads, break performance down by author. For each author: number of TLAs, total spend, eCTR, eCPC, and landing-page clicks. Compare each author against the TLA benchmark of 2.68% CTR and $2.29 CPC. Tell me which authors over- and under-perform, and whether I should shift TLA budget toward the strongest author.
How to read it: if one author consistently beats the benchmark and another sits below it, the reallocation is straightforward: put more TLA budget and more posts behind the author who converts. This is a creative-and-distribution decision a generic dashboard cannot make because it does not know who the authors are.
The last creative cut is copy.
Across enough ads, patterns emerge: demo-CTA-only copy with no education tends to underperform copy that leads with a proof point or a problem.
Tim Davidson, founder at B2B Rizz, put the priority order plainly in his LinkedIn post.
“When it comes to advertising, I’d debate that the messaging, the creative and the copy is the variable of success. And a lot of B2B companies skimp on that part. But that’s only if your targeting is dialed in.”
The prompt to use:
Look at my ad copy across all active ads. Group ads by copy pattern (e.g. demo-CTA-only, proof-point-led, problem-led, question hook, stat hook). For each pattern: average eCTR, average eCPC, and landing-page clicks. Tell me which copy patterns consistently underperform and which over-perform, so I know what to write more of and what to retire.
How to read it: this turns copywriting from guesswork into a pattern the account itself has already proved. Write more of what wins, retire the patterns that lose. It pairs well with the 2026 LinkedIn ABM benchmarks to show whether the whole account is above or below market.
An audit that ends with a list of problems is half a job.
The point of finding wasted spend and weak creatives is to move that money into what already works, and this is the step most programs skip, even though it is where the actual return comes from.
Start by confirming where the winners are.
Budget was reclaimed in parts one and two; now, find the destination with this prompt:
Show me my best-performing ad sets and ads by eCTR and eCPC over the last 30 days, with landing-page clicks and any influenced pipeline or deals. These are my winners. For each, tell me whether it has headroom to take more budget (audience not saturated, frequency still healthy) or whether it’s already maxed out.
How to read it: headroom is the keyword. Pouring budget into a winner whose audience is already saturated just drives up frequency and starts the fatigue clock. The target is winners with room to scale, not winners already approaching saturation.
Then connect the two sides by asking Claude Code to draft the actual reallocation.
Build me a reallocation plan. On one side, the reclaimable spend from the wasted-spend audit (overspending ad sets, impression hogs, non-ICP titles, decaying ads). On the other, my winning ad sets and ads with headroom. Propose specifically: which ads to pause, which accounts to exclude or cap, which titles to exclude, and where to move the freed budget. Draft the status changes but do not apply anything until I confirm.
This is where the safety model earns its keep.
Claude Code drafts every pause and reallocation, but it does not touch the account until each change is approved.
Review the plan, confirm the changes that make sense, and only then does anything go live. Nothing changes ad serving state quietly.
One final note on measuring the result.
Because ZenABM joins ad engagement data to CRM records, the reallocation can be graded against the pipeline a few weeks later rather than just against CTR.
That closes the loop on whether the budget actually moved and produced deals, which is the difference between optimizing for clicks and optimizing for revenue.


Put together, the LinkedIn ad performance audit with Claude Code is a fixed sequence that can run on a schedule.
Here is the order from start to finish.
The reason this fits in 30 minutes is that nothing is being built.
The workflow is asking questions and reading answers: the ZenABM MCP server handles the data work, the operator handles the judgment, and account changes only execute with explicit sign-off.
Run it weekly, and the leaks never get a month to compound.
You can start with the ZenABM MCP server now for free for 37 days, or book a demo with us to know more!
It is a narrow, performance-only review run by asking Claude Code questions in plain English, with the ZenABM MCP server pulling live LinkedIn Ads and CRM data. It focuses on two outcomes, finding wasted spend and finding weak creatives, then reallocating the reclaimed budget. It is not the full account audit, which also covers tracking, structure, targeting, settings, and attribution.
The full LinkedIn Ads audit is a six-area review covering tracking, account structure, targeting, settings like bid strategy and Audience Expansion, the LinkedIn Audience Network, and attribution. This performance audit deliberately skips all of that to go deep on spend efficiency and creative quality only. Run this one weekly; run the full one quarterly.
eCPC is the effective cost per landing-page click: what was actually paid for each visitor who reached the page, rather than just liked or commented. Campaign Manager does not surface this for engagement objectives, so spend can look fine on CTR while the real cost per click is terrible. Sorting ad sets by eCPC against the account median is the fastest way to surface inefficient spend.
Ask for the weekly eCTR trend across the top ads by spend over the last six weeks. An ad that peaks early and then declined for two or more consecutive weeks is fatiguing and needs a fresh variant. An ad that never performed is weak from launch and should be cut. In small B2B audiences, fatigue can appear within about three weeks, so the trend line matters more than any single snapshot.
It can draft the changes, but nothing executes without confirmation. Read questions never alter the account. Write actions like pausing an ad or excluding an account are flagged as requiring approval, so Claude Code proposes the change and waits for explicit confirmation before touching the LinkedIn ad serving state. Every reallocation stays under operator control.
