

©2026 ZenABM - All Rights Reserved.
Emilia Korczynska is Head of Marketing and co-founder at ZenABM. Before that she was VP of Marketing at Userpilot for nearly 7 years, where she ran a large ABM program primarily on LinkedIn ads.

B2B marketing attribution works when you give the credit for a deal to the account, not to the one contact who happened to fill in a form. If we had judged our ABM on contact-level (MQL) reporting, we would have stopped it long ago. In a LinkedIn post from June 2025 I wrote that at least 60% of ABM revenue goes unreported at contact level, and account-level reporting showed 10x more revenue.
By the end of this guide you can pick a model that fits a long sales cycle, write an influence rule, and show where LinkedIn impressions fit when nobody clicks. That is what multi-channel revenue attribution across your ads and CRM is for. If you are still choosing the stack around it, our guide to the best ABM tools is the place to start.
Here is the guide on one page, from the definition and the influence rule to setup and measurement:

Marketing attribution traces which channels and ads influenced the accounts that turned into revenue, instead of only crediting the one that delivered the final click. People also call it marketing influence, deal influence, influenced pipeline or revenue attribution. It is the right tool when you need to defend budget against a last-touch report, or prove that a demand generation channel did the early work.
The unit it counts is deals and revenue tied back to accounts. Clicks, MQLs, demos and form fills are signals along the way, and two things often get confused with it:
So why does B2B go wrong so often? Cycles run for months and buying committees are large, which means the person who sees your ad is rarely the person who books the demo. The inquiry could come from anybody inside that company, and a CRM that tracks one contact's last click will never connect the two.
Cristina Maliţa puts the consequence bluntly: "Don't run LinkedIn ads if you're going to judge their success on last-click attribution only. Seriously, don't do it." Her example shows why. A prospect saw 1,000+ LinkedIn impressions from January and engaged, downloaded an e-book in March, then searched the brand on Google in April and appeared in the CRM as Direct Traffic. LinkedIn got zero credit.
Philip Ilic describes why this matters for your budget: VPs and CMOs have moved from reporting "100 leads" to talking about pipeline and revenue. His warning: "Most people fail with LinkedIn Ads because they can't track influenced pipeline. If you're spending budget on content + distribution with LinkedIn ads, and can't prove it's influencing pipeline or revenue… your boss (or client) will shift budget to Google Ads."
Justin Rowe adds the internal politics in one of his posts on attribution. Even if a client is seeing more deals, whoever manages organic SEO or paid search will take credit for them if your work is not tied to those deals. A Salesforce dashboard built on direct first-touch attribution makes it worse, because it only credits direct, organic and paid search as first touch, so LinkedIn Ads can look negligible.
The cost of getting this wrong is slow and hard to trace. LinkedIn always looks expensive on last click, someone eventually cuts it, and the pipeline dents a quarter later in a way nobody connects back to that decision.
My stance follows from that: attribute at account level, count the ads an account saw before the deal opened, and report pipeline instead of clicks.
Here is the same deal seen at contact level and at account level, and why the second view credits LinkedIn:

See the ad touchpoints behind your own deals
ZenABM shows the impressions, clicks and engagements each account had before a deal opened, at account level.

For a long B2B sales cycle, the model matters less than the unit it counts: account-level influence beats any click-based model, whether that model is linear or U-shaped. This table compares how each model family splits credit and where it breaks:
Model | How credit is split | Best for | Main limit | When not to use it |
|---|---|---|---|---|
First touch | All credit to the first interaction | Seeing which channels start demand | Ignores everything that moved the buyer afterwards | When deals need months of nurturing |
Last touch | All credit to the final interaction before conversion | Short, direct-response funnels | Ignores everything that created the demand beforehand | When buyers consume content for weeks and then arrive direct |
Linear | Credit shared across the touchpoints | A simple view of multi-step paths | Treats a faint impression like a demo request | When touchpoints vary a lot in weight |
Time decay | More credit to touchpoints closer to the deal | Shorter cycles where recent actions matter | Under-credits the early awareness that started the deal | When the first ad did the heavy lifting |
U-shaped and W-shaped | Extra credit to a few milestone touchpoints, less to the rest | Funnels with clear stage milestones | Still built only from the clicks a platform chose to show | When most touches are views, not clicks |
Data-driven | Credit weights learned from your own conversions | Teams with high conversion volume | Needs volume most B2B teams lack | When you close a modest number of deals |
Account-level influence | Credit to the company when it crossed an impression threshold before the deal opened | Long cycles and demand gen | Generous by design, since other channels touch the same accounts | When you only need lead flow from tracked direct-response campaigns |
Single-touch models give all the credit to one interaction. Last touch is the CRM default, and it credits the final interaction before conversion while ignoring everything that created the demand beforehand.
Here is how first touch and last touch split the credit, with nothing left for the middle:

Valentin Dimitrov explains why last click on LinkedIn almost never fires. People consume content for three months, search the brand, arrive as direct traffic, and the dashboard credits that last touch.
These models redistribute credit across touchpoints, which sounds like a fix. The catch is that they redistribute it inside a dataset that is already incomplete, because they are built from the clicks the platforms chose to show.
They also answer who touched a deal, not whether the deal would have happened anyway. That second question is the one a CFO asks, and a holdout test is what answers it.
Data-driven models learn their weights from your own conversions, so they need conversion volume that most B2B teams do not have. I would not build a B2B attribution plan on one unless you close deals at real volume.
If you need to prove incrementality, a holdout test is the cleaner route. I cover how in the mistakes section.
This is the split that matters. Contact-level (MQL) attribution credits the last thing a contact did: a form fill within 30 minutes of a click, with cookies accepted and no ad blocker. LinkedIn's own attribution is contact-based under the hood too.
Account-level influence credits the ads an account saw before and while a deal formed. It positions LinkedIn as influence in a longer sales cycle instead of a direct-response channel.
Contact-level (MQL) | Account-level (influence) | |
|---|---|---|
Accounts covered | Only the contact who filled in a form or clicked last, so at least 60% of ABM-influenced revenue goes unreported | The company, once it met an impression threshold before the deal opened |
What you need | The CRM and UTMs | Engagement data matched to companies, plus a CRM |
Cost driver | You end up judging a demand-gen channel by CPL and CTR, which say nothing about pipeline | Pipeline per dollar spent |
Role of the channel | Treated as direct response | Treated as demand creation |
Time to first results | Immediate, but ignores most of LinkedIn's impact beyond direct response | Months |
When to choose it | To report lead flow in tightly tracked direct-response campaigns, never to judge whether the ABM channel works | To judge ABM and defend budget |
Tim Davidson says that if a company only looks at original source equals LinkedIn Ads, 93% of LinkedIn Ads accounts will look like total failures. That fits what Liam Collins says: teams "expect a demand creation channel to behave like a demand capture channel."
My view is simpler: last touch attribution for a demand gen channel makes no sense. HubSpot set everyone up to judge LinkedIn ABM like a branded search ad. For the three LinkedIn-specific views (last touch, first touch and view-through), see our post on LinkedIn ads attribution models.
You need a CRM with clean data, company-level ad engagement, a written threshold and window, and patience. Whichever model you use, it runs on this list, so check it before you touch any settings.
You need engagement matched to companies, and Campaign Manager does not give you that. Its Company Engagement Report export only includes companies with four or more ad engagements, so companies with fewer than four never appear and lower-volume engagement is invisible.
ZenABM's Company engagements view shows the companies engaging with your ads, with its engagement score, ABM stage and CRM data on one row, which Campaign Manager doesn't expose.
Here is that view, with each account's engagement score, ABM stage and ad metrics on one row:
If you have no CRM, the matching step is manual. The no-CRM section covers that.
They fit as view-through influence: count an account as influenced when it saw enough of your ads before the deal opened, because most people never click. That is how I attribute deals to LinkedIn ads.
People do not click LinkedIn ads to sign up for a demo. They consume the content in your campaigns, then Google the brand and convert from branded search.
Two things make LinkedIn vanish in the CRM. The attribution window usually closes before the sales cycle even starts, so by the time a buyer talks to sales the click is ancient history. And CRMs report last touch, so LinkedIn gets credited to search or dumped into the catch-all direct bucket. Cristina's prospect above is exactly this pattern, and under last-click logic it leads teams to cut paid social and double down on organic.
When LinkedIn does work, the impact shows across the whole GTM motion: sales outreach gets more replies, branded organic search grows and branded paid search converts more efficiently. Liam Collins sees a strong correlation between rising LinkedIn ad spend and rising direct traffic and branded search, both outside LinkedIn's click window.
Justin Rowe saw the cost of this first-hand with a client. Their CRM showed zero pipeline influence from LinkedIn, yet 11 companies in active pipeline had seen the ads, visited the site and ended up in real deals. The attribution window had closed before the sales cycle began, and the client nearly cut the budget.
A deal is ABM influenced when the account had more than 10 ABM ad impressions before the deal was created.
It is not perfect, because other channels touch the same accounts. It does answer the real question: did cold accounts that saw and engaged with our ads open deals afterwards? The initial traffic source on the demo booking does not matter for ABM, whether it was organic, direct or paid. What matters is that the account reached Aware before it converted.
Here is how the rule decides a deal, from the target account to the 10-impression check over the 180 days before the deal:

Valentin Dimitrov throws out deals counted as influenced off a single impression, unlike most tools, and that is the same reason our rule asks for more than a handful. Tim Davidson says to look at both original source and influenced metrics, such as how many clicks and paid impressions an account had before converting, or you will miss how much impact LinkedIn ads had.
LinkedIn's impact is compound interest, and nobody signs a big contract off one carousel. The average company we opened deals with in July had seen our ads 1,883 times, with a median of 754. Even deals with another clear last-touch channel averaged 832 impressions.
The big deals hide best. One six figure deal had 563 impressions, 20 engagements and 18 clicks on our TLAs before it opened, and HubSpot did not attribute it to LinkedIn at all.
Click costs show why click attribution is thin. In ZenABM's latest data pull (168 LinkedIn ad accounts, 27 April to 25 October 2026, medians per account), Thought Leader Ads cost $2.52 per click against $8.95 for single image ads. Per landing page click the picture flips: $28.73 for Thought Leader Ads and $15.26 for single image ads.
The gap exists because TLA CTR counts every like, comment and "see more" click. So judge traffic on cost per landing page click, not CTR, and expect few clicks to survive to a form fill whatever format you run.
Set it up in eight steps. Each one leaves you with something you can show: a written rule, connected data, grouped campaigns, a deal timeline, a multi-channel view, a self-reported source, tiered deals and a report.
Influenced = more than 10 impressions before deal creation, within 180 days.
That is our default. As a worked example, our deal companies averaged 1,883 impressions, so a threshold of 10 leaves a very wide margin and still screens out faint views.
Set the impression threshold and window in writing. For example, use 50 impressions if five people per company should see ten ads each, and treat 90 days as conservative. Our default is 10 impressions over 180 days, adjustable in settings. If you want to stress-test the number, our post on setting the influenced pipeline threshold walks through it.
Here is where that rule lives in ZenABM's CRM settings, set in this example to 50 impressions over a 180-day lookback:

Output: a written attribution rule.
Connect LinkedIn Ads API data to HubSpot, Salesforce or Attio through a tool that matches engagement to companies, not contacts. CRM-native attribution tracks MQLs and misses account-level revenue. ZenABM's CRM sync is one way to do it.
Here are ZenABM's CRM sync settings, where you pick the fields it writes to each company record:

Output: company-level engagement sitting next to your deals.
Link all the LinkedIn campaigns and assets for each ABM motion, with start and end dates, so attribution rolls up per motion instead of per ad set. Each motion then gets its own spend, pipeline per dollar, ROAS and influenced pipeline.
Output: one reporting group per ABM motion.
Open the deal-reporting view and read the account's timeline before the deal opened, not just the create date. You want impressions, clicks, engagements and spend before the deal opened and before it closed, by ad set and campaign.
ZenABM's deal attribution shows the ad touchpoints behind every deal, before it opened and before it closed, so you can see whether ads accelerated it.
Here is the deal view with the LinkedIn ad campaigns that touched a deal over time, with campaign metrics underneath:
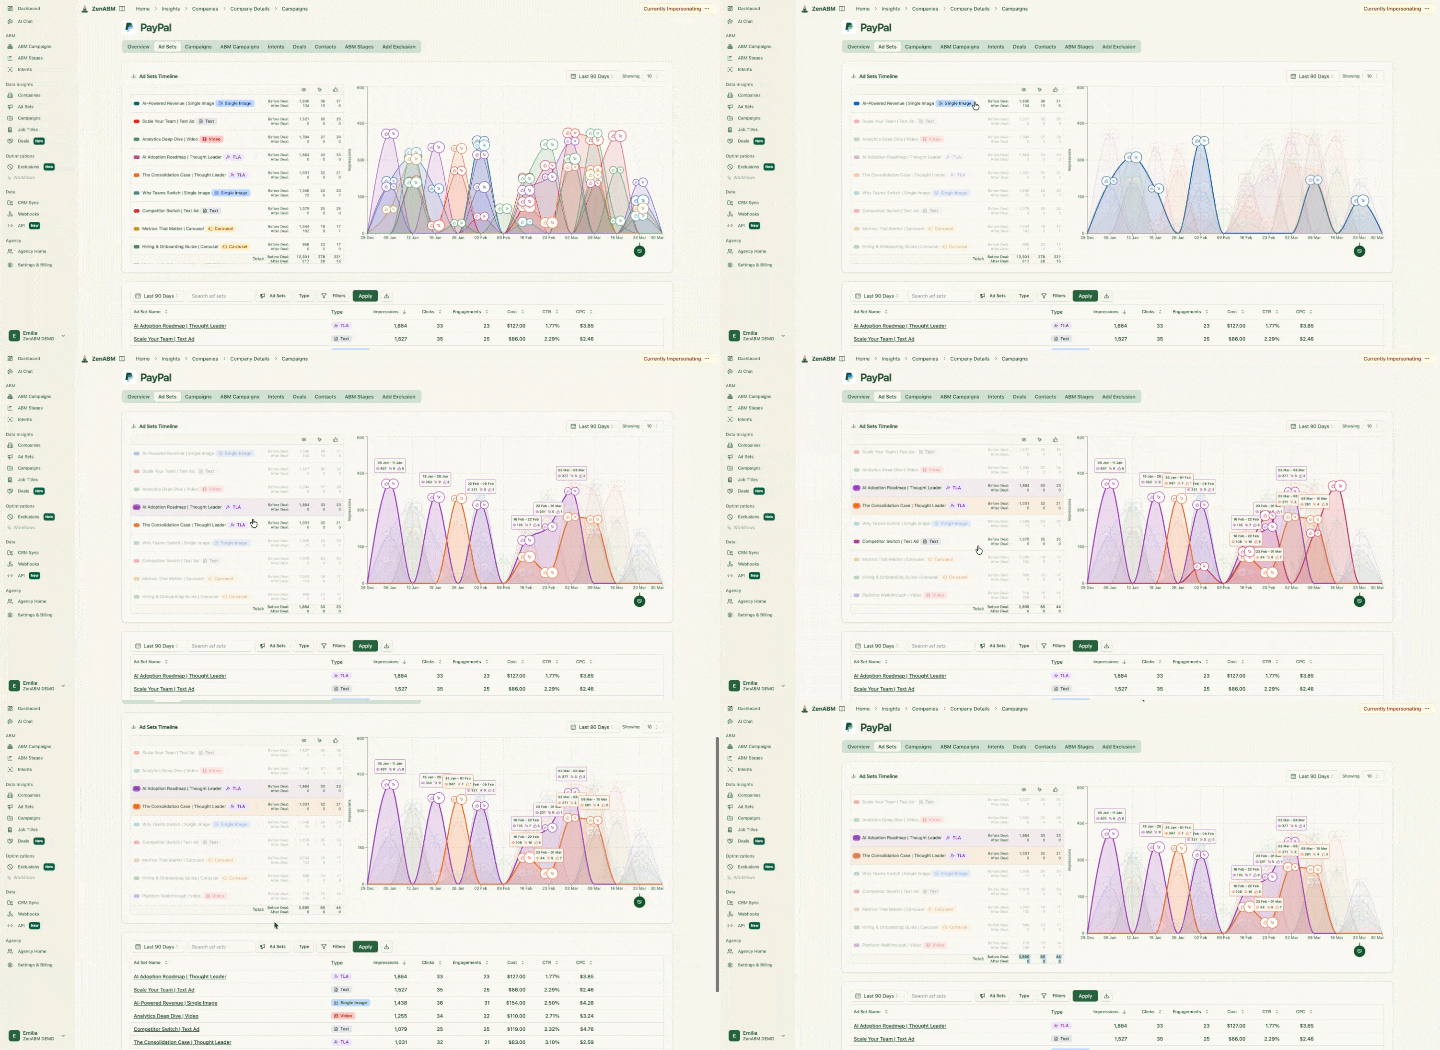
Output: a timeline for every deal you want to defend.
The CRM's historical source property is constantly overwritten, so direct traffic and paid search eat LinkedIn's contribution. Put LinkedIn Ads, Google Ads, Reddit Ads, AI referrals and organic visits on one view per company, so you can see which touchpoints really came first.
Output: a cross-channel history per account.
Add "How did you hear about us?" to demo or lead forms, and have sales ask it in discovery. Sam Dunning's tactic is exactly that: during discovery ask "How did you first hear about us?", write the answers down and track them manually. Then weight the answer against the engagement threshold.
A simple confidence rule helps. A self-report that lines up with 350 impressions, 20 engagements and a LinkedIn answer is high confidence, and five impressions, no engagement and paid search last touch is low confidence.
Output: a self-reported source on every deal.
Check each deal against ad exposure within a 180-day window of BDR qualification, and label it low, medium or high. Leadership trusts the number when you show what did not make the cut.
Miles Beard uses tiers over a 180-day window:
Tier | Impressions | Clicks or engagements |
|---|---|---|
Low | 10+ | 3+ clicks or engagements |
Medium | 100+ | 3+ clicks or engagements |
High | 500+ | 10+ engagements |
Valentin Dimitrov's four-tier scoring system is another way to label deals.
Output: a low, medium or high label per deal.
Do not open reports with clicks or cost per lead. Lead with influenced pipeline per month, and open it to show which deals make up the pipeline.
Output: a report leadership can read in one minute.
Here are the eight steps, from the written rule to the pipeline report:

Two rules of mine sit on top of the steps. Count influence only from deals opened after the account crossed your threshold, inside a set window (we used 180 days after the campaign ended). And check every influence claim against the full journey: every touchpoint, UTM, GCLID and LinkedIn engagement before and after the deal opened. With Claude and MCP servers that now takes minutes.
Set an influence rule your CFO has to take seriously
ZenABM applies your threshold and window to your own deals and shows the ones that did not make the cut.

Yes: match your closed-won companies to ad delivery data by hand, and add self-reported answers on top. Our own posts do not cover the no-CRM method, so this section rests on other practitioners' work.
Sheila Coque had a smaller client with no CRM, only a detailed contract spreadsheet. She compared all 48 closed-won companies against company-level delivery data and found 24 had received paid exposure.
Five contracts were directly attributed to LinkedIn Ads, with $60,000 revenue on $15,500 ad spend, which is about 3.9x ROAS. The sensible reading of the rest is that paid amplified an already-working organic engine instead of causing all 24 contracts.
Here are the four matching steps she used, from spreadsheet to delivery data:

If CRM access is blocked, Philip Ilic exported CRM contacts, fed them into Claude with LinkedIn Ads API data and matched company names to label influenced and accelerated pipeline. It is a manual stopgap that needs a fresh export each time.
His case shows the price of being late. He projected $90K revenue at a 25% conversion rate, from $30K spent and 31 qualified deals. The client churned the next day because the report came too late.
Self-reported attribution catches what click tracking misses. Gabriel Ehrlich audited 481 of his own inbound leads and found the real LinkedIn number was roughly 40 to 50% higher than the dashboard. Without self-reported attribution, he says, you lose a huge amount of measurement, enough to make or break the profitability of LinkedIn Ads as a channel.
So start here, with zero ad spend and before any software: a "How did you hear about us?" field and sales asking in discovery. The catch is that self-reported answers overweight recency, since buyers name the last thing they remember. Weight them against engagement data instead of trusting either one alone.
Lead with influenced pipeline, then pipeline per dollar spent, and wait for revenue. Report them by campaign, weekly and monthly. CTR and CPL measure how fast budget moves, not whether the channel works, so they come last.
Pipeline per dollar = influenced pipeline ÷ ad spend.
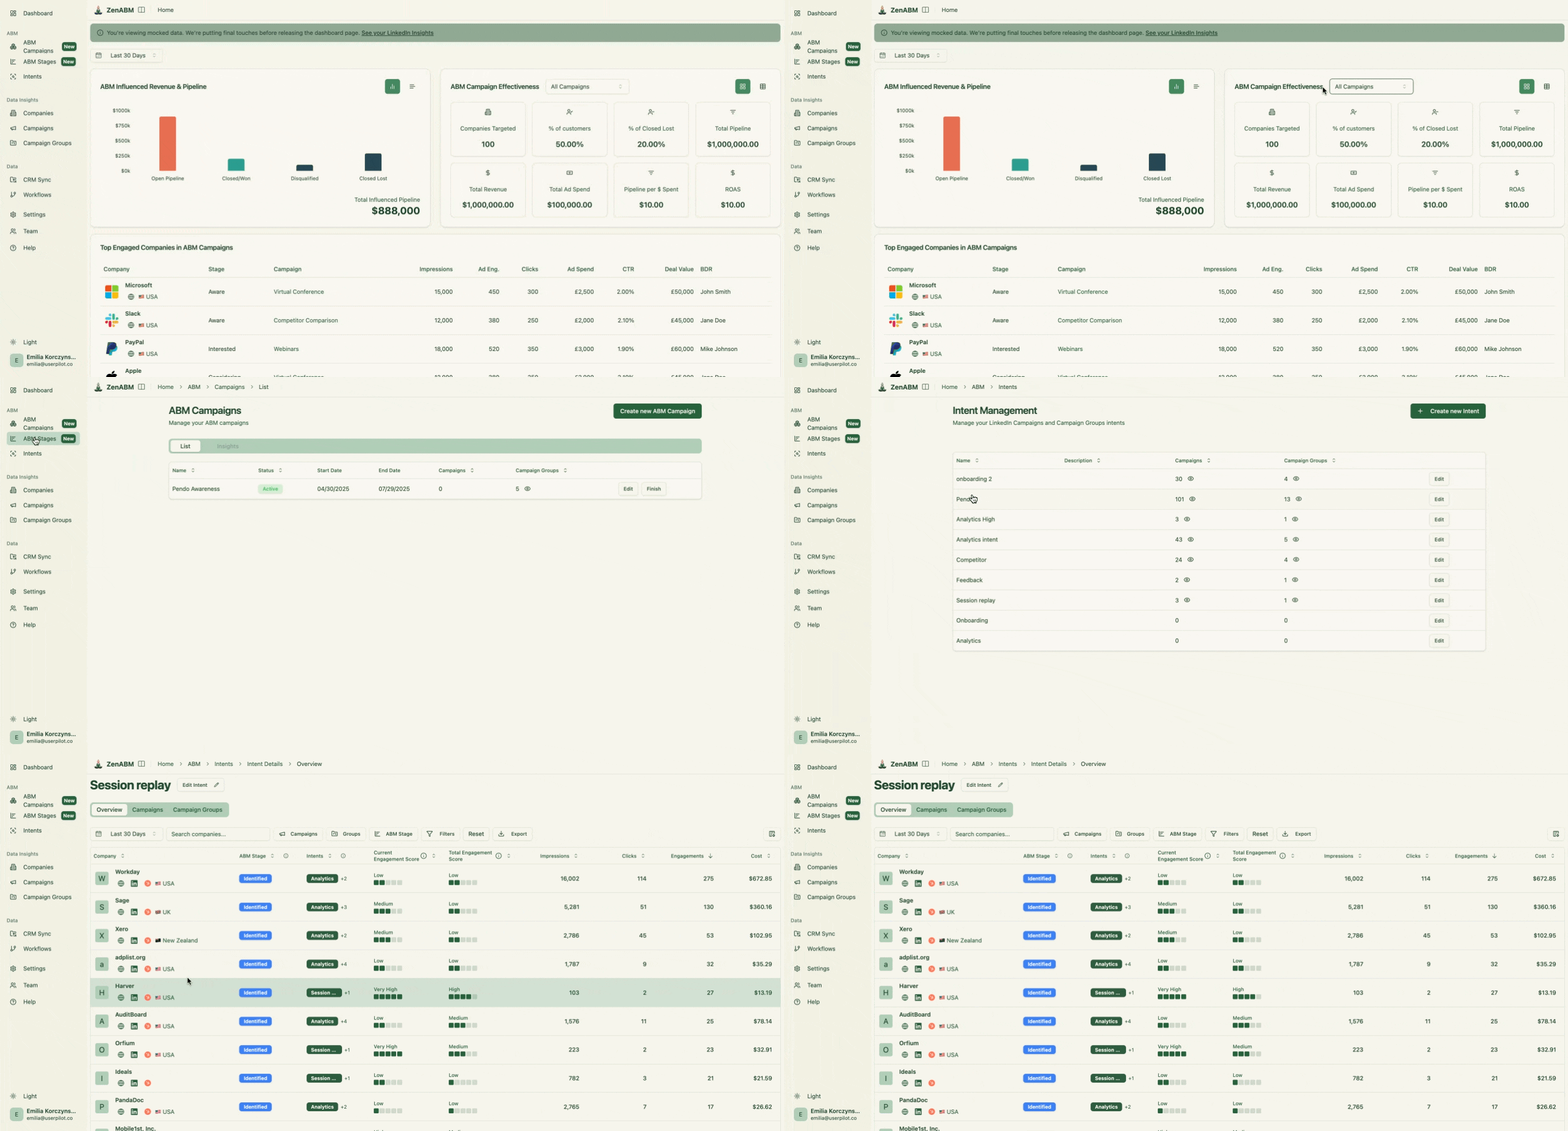
ZenABM's Dashboards show ad spend next to influenced pipeline, ROAS and pipeline per dollar out of the box, so you don't have to join spend exports to CRM deals every month.
The home dashboard shows influenced revenue and pipeline alongside campaign effectiveness figures:
Metric | What it shows | Decision it drives |
|---|---|---|
Influenced pipeline | Open deals whose accounts crossed your threshold | Defend or grow budget |
Pipeline per dollar | Efficiency: influenced pipeline per ad dollar | Move spend between campaigns |
Influenced revenue | Closed-won revenue from influenced deals, which lags pipeline | Prove the channel to finance |
Influenced demos | Demos from accounts that had ad exposure, before pipeline exists | Judge a new campaign early |
Share of pipeline touched | How much new pipeline had any LinkedIn ad touch | Diagnose reporting vs targeting |
CTR and CPL | How fast budget moves | Diagnose only, never the headline |
Influenced revenue shows up months later than the pipeline that fed it, so report it next to the pipeline figure rather than instead of it. In our CRM review, the median time from first impression to closed-won deal was 188.5 days. Rob Muldoon says CAC and ROAS become readable only after 3 to 6 months in most B2B cases. He adds: "Don't default to CTR and CPL as the source of truth, look to other sources of truth such as your web analytics/CRM/attribution tools."
Sheila Coque makes the same point from her client's CRM: judging May performance in May is misleading, because the full impact of today's campaigns will not be known until the end of the year.
Point to named companies rather than an aggregate multi-touch number. Non-marketing leadership sees what happened, while "3.62 influenced opportunities" means nothing to them. Marc Woodland says it best: "Impressions are nice. Pipeline influenced is the number that gets you buy in."
Sheila's Client A shows what influenced deals can look like against the rest:
Client A | Influenced | Not influenced |
|---|---|---|
Close rate | 18% | 6% |
Average deal size | $163K | $84K |
Sales cycle | 47 days | 25 days |
In that client's numbers, 74 of 230 deal companies were influenced, and the case shows $2.1M in closed revenue. Note the longer cycle: influenced deals were bigger and closed more often, but not faster.
To build the report, see our posts on influenced pipeline, the LinkedIn revenue attribution report and ABM ROI. If you want one view per motion, ZenABM's ABM campaign dashboards give each its own spend, pipeline per dollar and ROAS. The free Claude skill /linkedin-abm-report builds the monthly report from your ads data.
You cannot wait 188.5 days to know if a campaign is working. Philip Ilic compares CRM lifecycle stage against impressions, clicks and engagements before conversion, and reports influenced demos before pipeline exists.
Filip Saračević has a quick diagnostic. Count how much new pipeline had any LinkedIn ad touch before converting, matched on companies from one CRM export and one Campaign Manager export. It takes about an hour.
A high share with a low last-touch number means the channel works and the CRM fails to report it. A low share means the deals were never touched by the ads, so the problem is targeting, not creative, bidding or budget. As Filip puts it: "Nobody has to accept a new attribution model to agree with the number, which is the entire reason it works in a meeting."
Verify every influence claim against the full journey: every touchpoint, UTM, GCLID and LinkedIn engagement before and after the deal opened. Without it, your influenced number is one angry sales leader away from being dismissed. The /revenue-attribution skill runs that analysis from one command in Claude, ChatGPT or Cursor.
Five mistakes cost teams the most, and each has a fix. I also end with our own limit, because our method has one.
Business Manager reported an 85:1 return on ad spend for one industrial automation marketer. The marketer dismissed it as LinkedIn "putting two and two together and getting 500." Platform ROAS reflects what a channel claims, not what it caused. Early-stage teams that rely on platform-reported conversions end up with totals above actual revenue, because every channel claims its own. For the wider picture, see our post on marketing channel attribution.
Here is the platform's 85:1 ROAS next to CRM revenue, and why each channel claims its own conversions:

The fix is to check platform numbers against CRM revenue, and to say which one you trust and why.
Multi-touch only redistributes credit inside incomplete data. Patrick Cumming estimates that at most 50% of ad-platform-driven inbound actually gets categorised, because privacy tools and multi-device use block tracking.
He does not blame directors for cutting LinkedIn on last-click data, but measurement tools have come a long way since. The fix is to add account-level influence, not another credit-splitting formula.
A loose threshold builds a prettier vanity metric. Ali Yildirim makes the point: three ad impressions on a closed deal does not mean the ad closed the deal. Three impressions on a deal already deep in sales conversations should not carry the weight of the outbound sequence that started it. Fix it with a strict threshold, and admit that some pipeline would have closed anyway.
Some teams spend hours each week moving CRM credit between channels while believing it means little. I push back on that, and on the opposite habit of overspending on ads just so you can show attribution, at the cost of the campaign working. The fix is to set the rule once, report it consistently and spend the saved hours on the campaigns.
Tim Davidson contrasts the interrogation a $150k marketing-sourced deal close triggers with the instant celebration a $150k sales-sourced close gets. That is the pressure that pushes teams into theatre.
Influence is not proof that ads caused a deal. A growth lead challenged a high influence score on a deal he sourced through a colleague's recommendation, and any single-deal claim can be wrong.
When a CFO accepts no modelling answer, stop debating and test. Liam Collins suggests pre-registering one win condition and using two statistically paired regions where only one has spend. That needs clean geo pairs and a 12-week dark period.
Influence is generous by design. Some influenced deals were also driven by other channels, like cold search ads, and at our scale I couldn't separate them. I would rather say that than let someone else find it in a board meeting.
Buy by role in the stack, not by feature list. For the full comparison of options, see our posts on marketing attribution software and LinkedIn ad attribution tools.
Here are the required and optional tools, grouped by the role each plays in the stack:

ZenABM does the matching and reporting steps above, and its default influence rule is the one I use: 10 impressions within the 180 days before the deal was created, adjustable in settings.
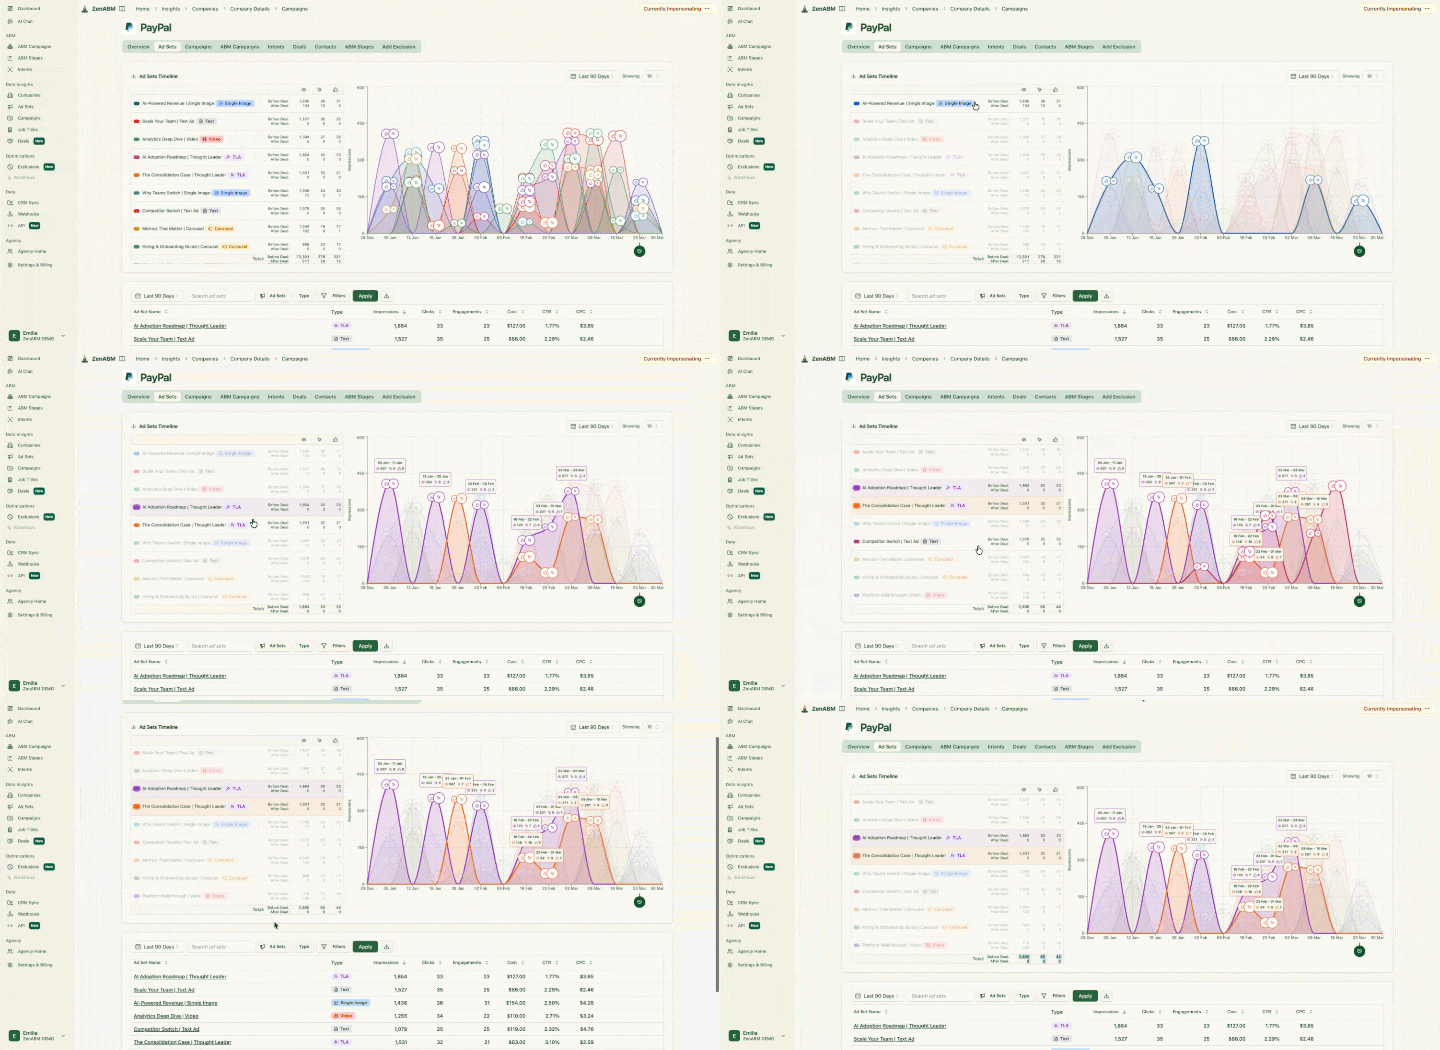
Here is the account timeline behind one deal, with each campaign touch attributed to it:
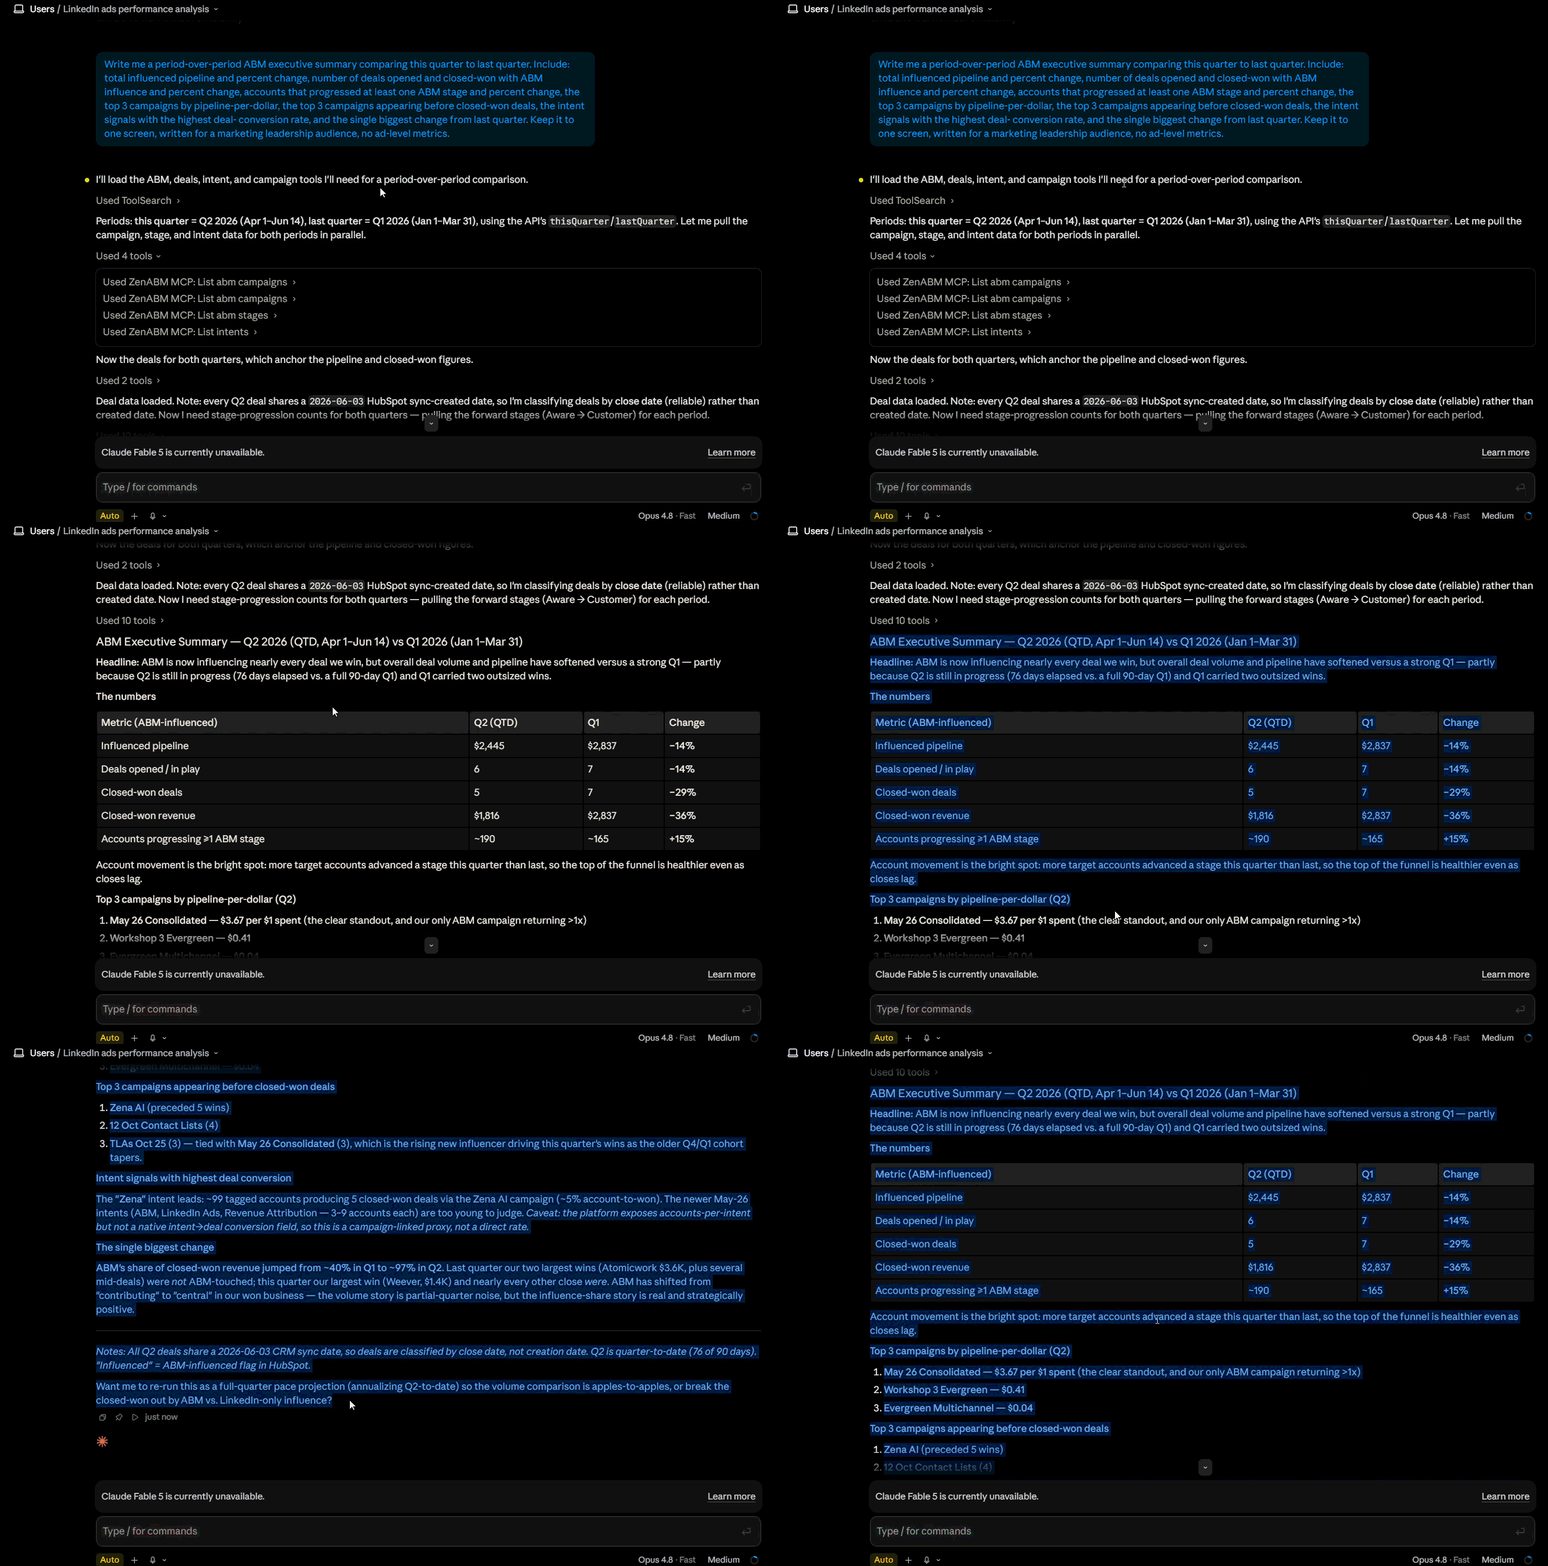
/revenue-attribution skill run the attribution analysis from one command. The MCP server connects the workspace to Claude, ChatGPT or Cursor, with 129 tools and 45 expert skills.This is Claude Code pulling ABM pipeline data from the workspace over the MCP server:
What to know before you choose ZenABM:
The free open-source Claude skills for auditing and reporting on LinkedIn ABM live on the LinkedIn ABM skills for Claude page.
See which companies engaged before your deals opened
Connect LinkedIn and ZenABM matches ad engagement to the companies on your deals, free for 37 days.

Write the influence rule first, in one sentence with a threshold and a window, and report pipeline against it before you buy anything. Add a "How did you hear about us?" field this week, because it costs nothing. And stop judging a demand gen channel by the last click, because nobody signs a big contract off one carousel.
Examples are first touch (all credit to the first interaction), last touch (all credit to the final one), linear, time decay, U-shaped, W-shaped and data-driven models. In B2B I would add account-level influence, where a deal counts as influenced when the company crossed an impression threshold before the deal opened. The models table above shows how each one splits credit.
Connect your CRM (HubSpot, Salesforce or Attio) to company-level ad engagement data, and set an influence threshold and window in writing. Tag every source and add UTMs. Add a "How did you hear about us?" field and have sales ask it in discovery. Then read each deal's touchpoints before it opened and closed, and report influenced pipeline first.
For B2B demand gen, account-level influence beats any click-based model. Count a deal as influenced when the account crossed an impression threshold before the deal opened, within a window such as 180 days. Single-touch and position-based models credit one contact's clicks, which hides most of what LinkedIn ads do.
Match company-level ad impressions, clicks and engagements to the companies on your deals. Set a threshold, for example more than 10 ad impressions before the deal was created, and a window, such as 180 days. Then check the account's full journey, including UTMs, branded search and self-reported source, before claiming influence.
CRMs are built for contact-level, last-touch reporting. A form fill must happen soon after a click, with cookies accepted and no ad blocker. B2B buyers consume content for months, then arrive via branded search or direct traffic, so credit lands on the last touch and LinkedIn looks smaller than it is.
Influenced pipeline appears as deals open once companies cross your threshold. Closed-won revenue takes longer: in our CRM review, the median was 188.5 days from first impression to closed-won deal. Rob Muldoon notes CAC and ROAS become readable only after 3 to 6 months in most B2B cases.
About the author

