

©2026 ZenABM - All Rights Reserved.

A LinkedIn ads full funnel for ABM is easy to draw, but hard to run.
Everyone draws the same triangle.
Cold at the top, warm in the middle, hot at the bottom.
Then they build it, and it falls apart in a specific way.
The stages have no numbers attached, so nobody can say when an account moved.
The budget gets split in too many ways, so nothing gets enough delivery.
And the whole thing lives in Campaign Manager, which cannot tell you which companies are in which stage.
Emilia Korczynska built this properly at Userpilot.
The program, in its first 16 months, spent $490,000, targeted 26,315 accounts, and produced $5,290,737 in pipeline.
This guide is the full structure.
The theory first, because the stages only make sense if you know why account funnels differ from lead funnels.
Then the exact thresholds, the budget split, the formats per layer, and the plumbing that makes an account move on its own.
A quick overview:

/funnel-movement, /account-engagement, /scaling-planner, /intent-report and /sales-handoff.Skip this, and you will build a lead funnel with account labels on it.
That is the most common failure, and it is expensive.
A lead funnel tracks people. A person downloads a guide, becomes an MQL, gets called.
An ABM funnel tracks companies. That one change breaks most of the usual logic.
Gartner puts the average B2B buying committee at 11 people.
So a form filled out by one person tells you very little. Four people from three teams engaging over a month tells you a lot.
Your funnel has to count the account, and it has to count how many people inside it are awake.
Research from Professor John Dawes at the Ehrenberg-Bass Institute found that only about 5 percent of B2B buyers are in market at any moment.
That reframes the top of the funnel completely.
Cold ads are not failing to convert.
They are doing memory work for people who will buy in a year.
If you judge your cold layer on conversions, you will switch off the part that makes the bottom of the funnel possible.
In a lead funnel, the unit of progress is a conversion. In an ABM funnel, it is an account moving stage.
That is why every stage needs a threshold.
Without one, “moved to Interested” is somebody’s opinion, and opinions do not survive contact with a sales team.
You do not need to invent stages. Three published frameworks cover almost every case, and they differ in useful ways.
Kyle Poyar, who writes the Growth Unhinged newsletter, frames ABM stages against an awareness funnel: Identified, Aware, Interested, Evaluating.
Three things make his version worth studying.
First, each stage carries an account score and a threshold. The stage is a number, not a label.
Second, he attaches stage benchmarks: how many accounts you expect to move from one stage to the next. That turns the funnel into a forecast rather than a report.
Third, the content changes as the account descends. In his words, the further down the funnel, the more product-oriented the content becomes.

Emilia Korczynska, then VP of Marketing at Userpilot, ran a five-stage version that adds a distinction Poyar’s four-stage model folds together: Considering (a demo or trial) sits apart from Selecting (an open deal).
That split matters because the plays are different.
A trial user needs product proof.
An open deal needs multi-threading across the committee while procurement grinds.

Sangram Vajre, co-founder of Terminus and author of ABM is B2B, popularised the flipped funnel: identify, expand, engage, advocate.
It is less useful for setting ad thresholds, but it fixes a blind spot the other two share.
Both stop at the deal.
Vajre’s version keeps going into expansion and advocacy, which matters if a large share of your revenue comes from existing customers.

Framework | Stages | Best for | Weakness |
|---|---|---|---|
Kyle Poyar | Identified, Aware, Interested, Evaluating | Teams that want stage benchmarks and forecasting | Folds trial and open deal together |
Userpilot five-stage | Identified, Aware, Interested, Considering, Selecting | LinkedIn-led programs with a CRM connected | More stages to maintain |
Vajre flipped funnel | Identify, expand, engage, advocate | Programs where expansion revenue matters | Hard to attach ad thresholds to |
My advice: start with the five-stage version because it maps cleanly onto LinkedIn engagement data and CRM deal stages.
Borrow Poyar’s stage benchmarks on top.
Add Vajre’s expansion stages only if you sell heavily into your existing base.
Now the practical half.
This is the part you can copy.
Here is the mistake I want you to skip, because it cost us three months.
We had five stages, so we built five campaign groups. One per stage. It felt tidy.
Every campaign was underfunded. Several audiences fell below LinkedIn’s 300 member serving floor and stopped delivering entirely. Accounts stranded in the middle stages got almost no impressions.
The version that worked separates tracking from delivery.
Track five stages. Use them for reporting, routing, and forecasting.
Deliver in two layers.
Selecting stage accounts leave paid nurture and move into sales-led motion, with ads only keeping the wider committee warm.
Two layers mean two audiences big enough to serve and two budgets big enough to matter.
This is the heart of the whole structure.
A stage without a number is decoration.
These are the thresholds we ran, and they are a sound starting point for most B2B programs with a similar deal size.
Stage | Threshold to enter | What runs here | What happens when it fires |
|---|---|---|---|
Identified | On the target account list | Cold reach, point-of-view content | Nothing yet. Just deliver. |
Aware | 50 or more ad impressions | Varied creative, no ask | Keep showing up. Track frequency. |
Interested | 5 or more clicks, or 10 or more engagements | Case studies, comparisons, demo invites | Fire a BDR task. Sync to CRM. |
Considering | Booked a demo or started a trial | Product proof, objection handling | Sales owns it. Ads support. |
Selecting | Open deal in the CRM | Multi-thread across the committee | Keep warm through procurement. |
Do not copy ours blindly. Here is how to derive them.
Once your thresholds are set, record how many accounts move between stages each month.
That gives you conversion rates between stages, and those rates turn your funnel into a forecast.
Transition | What to record | What it tells you |
|---|---|---|
Identified to Aware | Share of list reached | Whether your budget covers the list |
Aware to Interested | Share that engages | Whether the creative and offer work |
Interested to Considering | Share that books | Whether the offer and page convert |
Considering to Selecting | Share that opens a deal | Whether sales follow-up is working |
The slowest transition is your bottleneck, and it is where the next quarter’s work goes.
For a worked example of a program run this way, the FlowFuse case study is worth a read.
The funnel fails if every layer runs the same ad type with the same objective.
Layer | Objective | Format | What you are buying |
|---|---|---|---|
Cold | Brand awareness or engagement | Thought Leader Ads | Cheap, broad impressions across the committee |
Aware | Engagement or video views | Video, document ads | Attention, plus a retargeting pool |
Interested | Website visits | Single image, carousel | The visit and the page-level intent |
Considering | Website conversions | Single image, document | The demo or trial, if volume allows |
Two notes on that table.
Thought Leader Ads belong at the top because they are the cheapest attention on the platform.
In the ZenABM 2026 benchmark of 211 companies, 161,256 ads and $5.5M in spend, they posted a 2.68 percent median CTR at a $2.29 median CPC, against 0.42 percent for single image ads.

And be careful with conversion objectives above the bottom layer.
LinkedIn’s conversion optimization needs roughly 15 to 25 conversions a month to train, which most ABM audiences cannot produce.
Read related: LinkedIn ads conversion campaigns for ABM: when to use them
Work backwards from revenue, not forwards from what you have.
Userpilot set a goal of $3,500,000 in qualified pipeline against a $350,000 annual budget.
That is a 10x pipeline target, derived from close rate, qualification rate and average contract value.
Over the first 90 days, the program returned $12 in pipeline per dollar spent and produced over $650,000 in pipeline.
Over 16 months it settled at $10.79 per dollar across $490,000 of spend, which is worth noticing.
Efficiency dipped slightly as the program scaled, which matches the benchmark finding that higher spend tiers are not more efficient.
Before splitting anything, check how many ads your budget can genuinely fund:
Monthly budget, divided by 30, divided by cost per landing page click, divided by roughly 4 clicks per ad per day, equals the most ads you can support at once.
Every extra layer and every extra campaign multiplies your ad count.
Our LinkedIn ads count calculator runs it, and the ABM budget calculator works the revenue goal backwards.


This is the actual split Userpilot ran inside each persona and intent group, at $14,630 a month:
Format | Monthly budget | Funnel job |
|---|---|---|
Single image ads | $4,800 | Warm layer workhorse |
Thought Leader Ads | $4,800 | Cold reach and trust |
Video ads | $2,880 | Building the retargeting pool |
Carousel ads | $1,900 | Product explanation |
Text ads | $250 | Cheap always-on presence |
This is the structural decision I would most want you to copy.
We tried splitting campaigns by persona and by intent at the same time. The audiences got too small to serve, and the data got unreadable.
The fix was to split by intent theme instead, with multiple personas inside each. Userpilot ended up with 12 campaigns split by problem, things like onboarding, analytics, and switching from a competitor.
That gives you audiences big enough to run, and it tells you what each account cares about, which is exactly what a BDR needs for the first line of an email.
If you also tier accounts by value, the tiered segmentation guide covers how the two layers fit together.
Everything above is a plan.
This part is what turns it into a system.
Campaign Manager cannot do this.
It has no idea which companies engaged with exactly which ad, so it cannot place them in a stage.
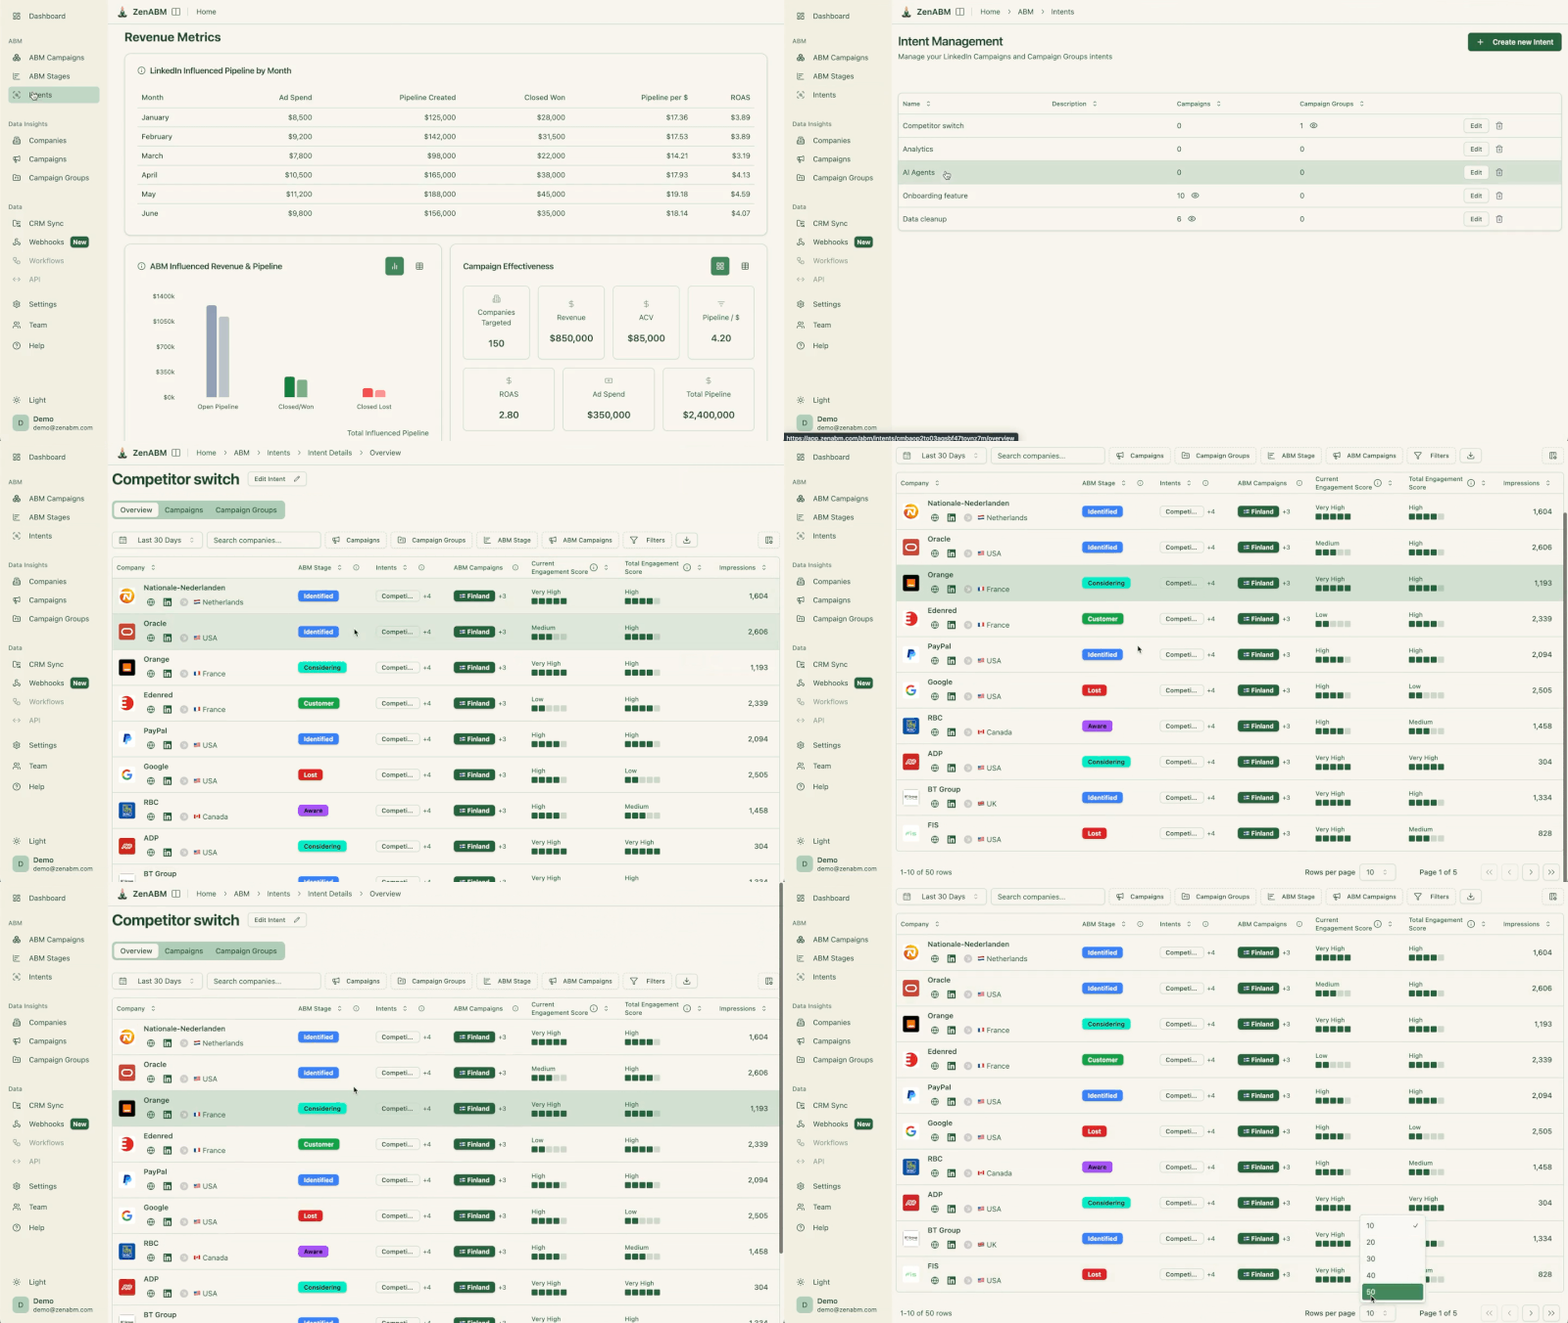
ZenABM can because it pulls company-level engagement straight from the LinkedIn Ads API for each ad and ad campaign and attributes every impression and click to a named company.

Most tools give you a fixed funnel. ZenABM lets you name your own stages and write your own conditions.


A stage can key off ad engagement, a CRM property, a form fill, a webinar signup, or a deal stage. You can combine them.
That flexibility is what lets one stage mean “50 impressions” and the next mean “booked a demo,” even though those live in two different systems.

Stages are coarse.
Inside a stage, the engagement score tells you who to work first.
ZenABM keeps two: a current score, which is engagements over impressions in your window, and a total score covering all time. The gap between them tells you whether an account is heating up or cooling down.

Because ZenABM lets you split campaigns by intent, every account that engages inherits a theme.
So your funnel does not just say an account is Interested. It says the account is Interested in feature X or Y.
Here is a limit to consider.
Practitioners put realistic account penetration on LinkedIn at somewhere between 10 and 40 percent, so more than half your list will not be reached on LinkedIn alone.
That means a LinkedIn-only funnel is incomplete by design.
ZenABM stitches other channels onto the same account record: Google Ads, Reddit Ads, organic traffic, and AI chatbot referrals.


The practical effect is on your thresholds.
If an account hit Aware through Google Ads rather than LinkedIn, your stage rule should still fire.
Build conditions on total engagement, not LinkedIn engagement, once you have more than one channel running.
A funnel that nobody acts on is a chart.
This section is the difference between a stage change being a number and a stage change being a task in somebody’s queue.
ZenABM syncs bi-directionally with HubSpot and Salesforce.
The ABM stage and the intent theme land on the company record as properties.

Once it is a property, your CRM does the rest. A company entering Interested can create a task, assign an owner, or start a sequence.

Not every team runs on HubSpot or Salesforce.
ZenABM sends webhooks to Clay, Attio and Pipedrive, so a stage change can trigger work in whatever tool you actually use.
The Clay path is the one I love the most, because it turns a stage change into enrichment and outreach automatically.


Put the pieces together, and you get a loop that runs without a human in the middle.
An account crosses your Interested threshold.
The stage syncs to the CRM and fires a webhook.
Clay enriches the account and finds the right contacts.
The outreach references the intent theme the account actually engaged with.
The last piece of plumbing is the one that saves you the most time each week.
A full funnel produces a lot of checking.
Which accounts moved.
Which stalled.
Which layer is underfunded.
Which ads are decaying.
Doing that by hand is the work that quietly stops getting done.
MCP is the standard that lets an AI client talk to an outside data source.
The ZenABM MCP server connects your live LinkedIn ads and ABM data to Claude Code, Claude Desktop or ChatGPT.
The endpoint is https://app.zenabm.com/api/mcp, authenticated with a Bearer token or OAuth. In Claude Code, you add it once, then run /init, which writes a CLAUDE.md so the agent keeps standing context about your account.


Two things, and the difference matters.
Data tools for single questions: company intelligence, campaign and ad set performance, ABM stages and stage history, intent themes, job titles, deals, live delivery settings, reach and frequency, and weekly rolling series.
Skills, which are complete workflows exposed as slash commands. There are 15. Four are also installable from the public repo as Claude Code plugins.
The ones that matter for a full funnel:
Skill | Funnel layer | What it does |
|---|---|---|
/abm-strategy-planning | Planning | Stress-tests the revenue goal against budget and real ad metrics |
/funnel-movement | Whole funnel | Who moved, who stalled, and which transition is the bottleneck |
/account-engagement | Cold and warm | Sorts accounts into warm, cold, budget hog and bad fit |
/scaling-planner | Cold | Whether more budget reaches new people or repeats to the same ones |
/ad-decay | All layers | Catches tired creative using real weekly data |
/intent-report | Warm | Which intent themes actually correlate with deals |
/sales-handoff | Interested and below | Today’s call list with a talking point per account |
/revenue-attribution | Bottom | Pipeline per dollar per campaign, deduplicated |


You can also install the four Claude packaged skills by ZenABM:
/plugin marketplace add ZENABM/linkedin-abm-skills
/plugin install linkedin-abm-skills@zenabm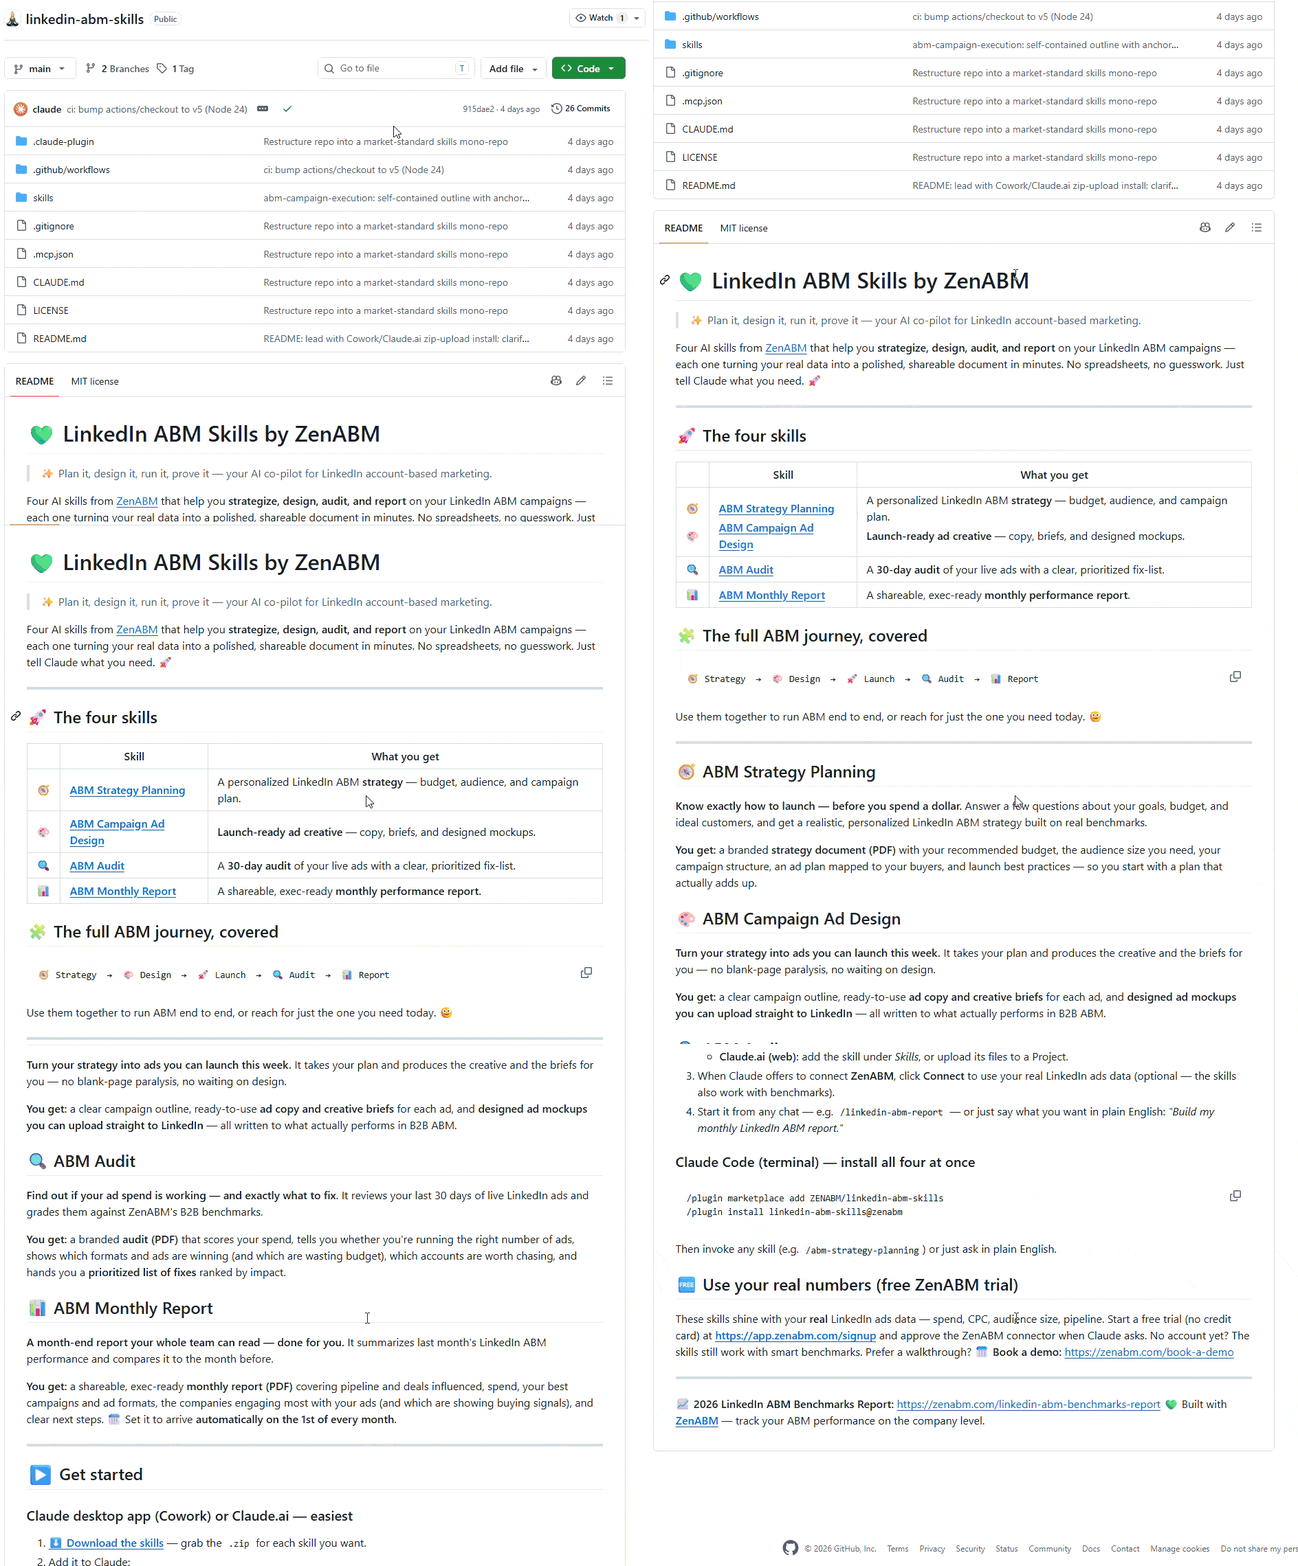
This is the one I run weekly.
It reads the whole structure in one pass:
Review my full ABM funnel for the last 30 days. First show the account count in each stage and how each changed versus the previous 30 days. Then show the conversion rate between each pair of stages and tell me which transition is the slowest. List any account that has been in the Interested stage for more than 6 weeks past our average, with the last thing it engaged with. Then check whether my cold layer is reaching new accounts or repeating, using reach divided by audience size. Finish with one prioritized action per funnel layer, and state the account count behind every percentage.
If you would rather not use a terminal, Zena, the AI agent inside ZenABM, answers the same questions and delivers scheduled weekly, monthly, and quarterly summaries on the dashboard.

This is the last part and is about the ops.
Once the structure works, the pressure is to make it bigger.
That is where most programs undo their own work.
LinkedIn delivers to people, not companies. So one large enterprise on your list can absorb a huge share of budget simply because it has more employees in your target roles.
If 80 percent of your spend reaches 20 percent of your list, adding more accounts changes nothing. They join the ignored majority.
Sort your companies by impressions.
If the top five hold most of your delivery, cap them before you expand, using the build in our impression capping guide.
What you see | What it means | What to do |
|---|---|---|
Low penetration, low frequency | Underfunded for your current list | Go deeper. More budget reaches new people. |
Low penetration, high frequency | Budget concentrated on a few | Fix distribution first. |
High penetration, rising frequency | You are repeating yourself | Go wider. Add accounts. |
High penetration, healthy frequency | Working well | Hold and refresh creative. |
Penetration is reach divided by audience size.
Frequency is impressions divided by reach.

Increase one ad set by 20 to 30 percent, wait two full weeks, then check whether reach grew in line with spend.
If reach stayed flat while impressions climbed, you bought repetition rather than coverage.
Read related: Scaling LinkedIn Ads Across More Target Accounts
A full funnel needs a routine, or it drifts.
Here is the whole thing on one page.
Cadence | What you check | The threshold | The action |
|---|---|---|---|
Daily | New Interested accounts | 5+ clicks or 10+ engagements | BDR calls, with the intent theme |
Weekly | Decaying ads | 2 down weeks above 1,000 impressions | Refresh creative, keep the message |
Weekly | Kill threshold | 1,000 impressions, eCTR under 0.4% | Pause, no debate |
Weekly | Impression hogs | High impressions, near-zero engagement | Cap or exclude the account |
Weekly | Stalled accounts | 6 weeks past average time in stage | Change creative or hand to sales |
Monthly | Stage conversion rates | Versus your own baseline | Fix the slowest transition |
Monthly | Pipeline per dollar | Median is $5.21, top is $15.20 | Rework the layer that lags |
Quarterly | Penetration and persona drift | Penetration 10 to 40% | Go wider, or fix targeting |


A full funnel is not a diagram. It is five thresholds, two delivery layers, and a piece of plumbing that turns a threshold into a task.
Steal a stage framework rather than inventing one. Derive your thresholds from what your winning accounts actually did before they bought. Track five stages but deliver in two, because budget split too many ways stops working entirely. Split campaigns by intent, not persona. Then wire the stage into your CRM so crossing it creates work for a human.
If you build one thing this week, build the Interested threshold. Set it at 5 clicks or 10 engagements from an in-ICP account, sync it to your CRM, and let it fire a task.
That single rule turns a chart into a pipeline machine, and everything else in this guide is an improvement on top of it.
The account-level view underneath all of it is the part LinkedIn will not hand you. If you want it on your own program, ZenABM is free for 37 days with full functionality, and stages, intent themes, webhooks and the MCP connection can all be live before your next planning cycle.
You can also book a demo with us to know more.
It is a campaign structure where target accounts move through defined stages, from unaware to in a deal, with a numeric threshold controlling each move. Typically you track five stages (Identified, Aware, Interested, Considering, Selecting) but deliver in two layers, cold and warm, because splitting budget across five campaigns underfunds all of them. The unit is the account, not the lead.
Five works for most programs: Identified for everyone on the target list, Aware at 50 or more impressions, Interested at 5 or more clicks or 10 or more engagements, Considering when a demo or trial happens, and Selecting when a deal opens. Kyle Poyar uses a four-stage version that merges the last two. Derive your own numbers by looking at what accounts did before they booked demos.
Work backwards from the pipeline goal rather than forwards from what you have. Userpilot targeted $3.5M in qualified pipeline against a $350,000 annual budget, roughly 10x. Then check feasibility with the ad-count model: monthly budget divided by 30, divided by cost per landing page click, divided by about 4 clicks per ad per day gives the most ads you can genuinely fund.
A threshold has to fire automatically, otherwise it becomes somebody’s opinion and sales stops trusting it. In ZenABM you define the stage names and conditions yourself, built from ad engagement, CRM properties, form fills or deal stages, and the stage then syncs to your CRM as a company property so a workflow can create a task.
By intent. Splitting by persona and intent at once makes audiences too small to serve, and LinkedIn needs 300 members minimum. Userpilot ran 12 campaigns split by problem, such as onboarding or switching from a competitor, with multiple personas inside each. That keeps audiences servable and tells you what each engaged account actually cares about.
Measure account movement between stages monthly, then influenced pipeline per dollar, deduplicated so one account with several engaged people counts once, as covered in the ABM KPIs guide. Grade against the benchmark, where median influenced pipeline is $5.21 per dollar at 1.62x ROAS and top performers reach $15.20. Coverage and engagement read in 30 to 60 days, while pipeline needs 60 to 120.
