

©2026 ZenABM - All Rights Reserved.
Emilia Korczynska is Head of Marketing and co-founder at ZenABM. Before that she was VP of Marketing at Userpilot for nearly 7 years, where she ran a large ABM program primarily on LinkedIn ads.

LinkedIn ads deal attribution is a tricky business - everyone I talk to has a different opinion on how it should be done (even if they are not in marketing) 😅 In my opinion, a good attribution dashboard should show the impressions, clicks and engagements an account had before a deal opened or closed, instead of crediting only the last click (this is also influenced attribution, but you put all the weight on the last touchpoint before the conversion - which doesn't make sense for demand gen channels like LinkedIn and complex B2B buying journeys with multiple stakeholders!).
For Linkedin deal attribution tools: Campaign Manager and your CRM track people, so they miss most of that, while ZenABM puts every touchpoint on one company journey so you can see what the account saw before the deal.
I judge LinkedIn ABM by the account, not the contact, using one view-through attribution: a threshold of signals in the 180 days before the deal was created. Below you get the steps, the deal attribution rules to copy, how to check it and what it can't prove.
In this post - I'm going to show you how to do LinkedIn ads deal attribution the right way.
And if you are still choosing software, start with these ABM tools worth comparing.
See the LinkedIn touchpoints behind every deal
ZenABM shows the impressions, clicks and engagements each account had before a deal opened and closed, matched at company level from the official LinkedIn Ads API.

It shows which ads the company behind a deal saw and engaged with before the deal opened and before it closed, which last-touch and contact-level attribution cannot see. So what does that look like next to the attribution you already have, and why can't your CRM see it?
Last-touch credits the final interaction. Contact-level attribution credits one person's form fill. Account-level deal attribution counts everything the whole company did with your ads, and that is the only view that matches how a buying committee behaves.
Here are the three views side by side:

Your CRM sees it differently because CRMs are built for marketing qualified leads (MQLs). HubSpot needed the contact to fill a form within 30 minutes of the click, accept cookies and have no ad blocker. LinkedIn's own attribution is also contact-based under the hood, which means both tools undercount a channel that works months before anyone fills in a form.
There is a second catch in the data you can export. LinkedIn's Company Engagement Report only includes companies with four or more ad engagements, so accounts with a light touch are invisible in the export, even though they may be sitting in an open deal.
That is why I don't care about the traffic source on the demo booking. Organic, direct or paid, the journey is always complex, and what matters is that the account reached Aware before it converted.
Cristina Maliţa from Advanceful describes the typical pattern. A prospect saw 1,000+ LinkedIn impressions from January, downloaded an e-book in March and searched the brand in April. The CRM logged the deal as Direct Traffic, and LinkedIn got zero credit.
The size of the gap is easy to underestimate. The average company we opened deals with in July 2026 had seen our ads 1,883 times (median 754), and even deals with another clear last-touch channel averaged 832 impressions. Nobody signs a big contract off one carousel.
So the question to ask is not which channel the buyer touched last, but whether the account saw and engaged with your ads before the deal opened. To answer it you need a few things in place first.
You need a company-level link between your deals and your LinkedIn ad delivery data, a written rule for what counts as influenced, and CRM data tidy enough to trust. A CRM helps but is not mandatory.
Here is the checklist:
Sheila Coque, who runs a solo LinkedIn Ads business, ran the match without a CRM. She compared a detailed spreadsheet of contracts against Campaign Manager delivery data, found that 24 of 48 closed-won companies had received paid exposure and could attribute 5 contracts directly to LinkedIn Ads.
Philip Ilic from KiiN rebuilt attribution without CRM access. He matched a CRM export against LinkedIn Ads API data and found 31 qualified deals, which projected to $90K in revenue at a 25% conversion rate from $30K spent.
So a spreadsheet is a fine place to start. The catch is that doing it by hand means creating custom CRM properties and importing CSVs every week. ZenABM writes engagement, scores, stages and intent onto your HubSpot, Salesforce or Attio company records and creates the properties for you, so no CSV imports; CRM sync takes about 10 minutes to connect.
This is the kind of company-level table you want to end up with, one row per company:
With the data and the rule in hand, here are the steps.
Five steps give you a deal timeline for each account: define the rule, connect LinkedIn and your CRM, group campaigns into motions, read a deal's timeline and add the other channels.

Write down three fields: the impression threshold, the engagement gate and the lookback window. Mine today is one or more ad engagements in the 180 days before the deal was created, and I got there by testing it against our own deals, not by copying a default. The next two sections explain each part and how to test it.
Expected result: one sentence you can paste into a report and defend to your CFO.
Connect LinkedIn Ads and your CRM to a tool that matches engagement to companies, not contacts. In ZenABM that means the LinkedIn Ads API plus HubSpot, Salesforce or Attio, and pipeline and revenue then sync from the CRM daily.
Expected result: every deal company carries its ad engagement. Without a CRM, you do the same thing with a spreadsheet export instead of a live sync, as in Sheila Coque's example above.
Give each ABM motion a name and a start date, then select the LinkedIn campaigns and ad sets it holds. ZenABM calculates influence from that start date and discards earlier interactions, so the start date matters. The point of grouping is that attribution then rolls up per motion, for example colder and warmer layers, instead of per ad set. ABM campaign dashboards show each motion's spend, ROAS and influenced pipeline.
Expected result: you can compare motions instead of judging one blended average.
Open a deal and read the touchpoints before it opened, not just the create date. You should see impressions, clicks, engagements and spend before the deal opened and before it closed, broken out by ad set and campaign.
Here is what that looks like in ZenABM's deal view, with each campaign touch laid out on an account timeline:
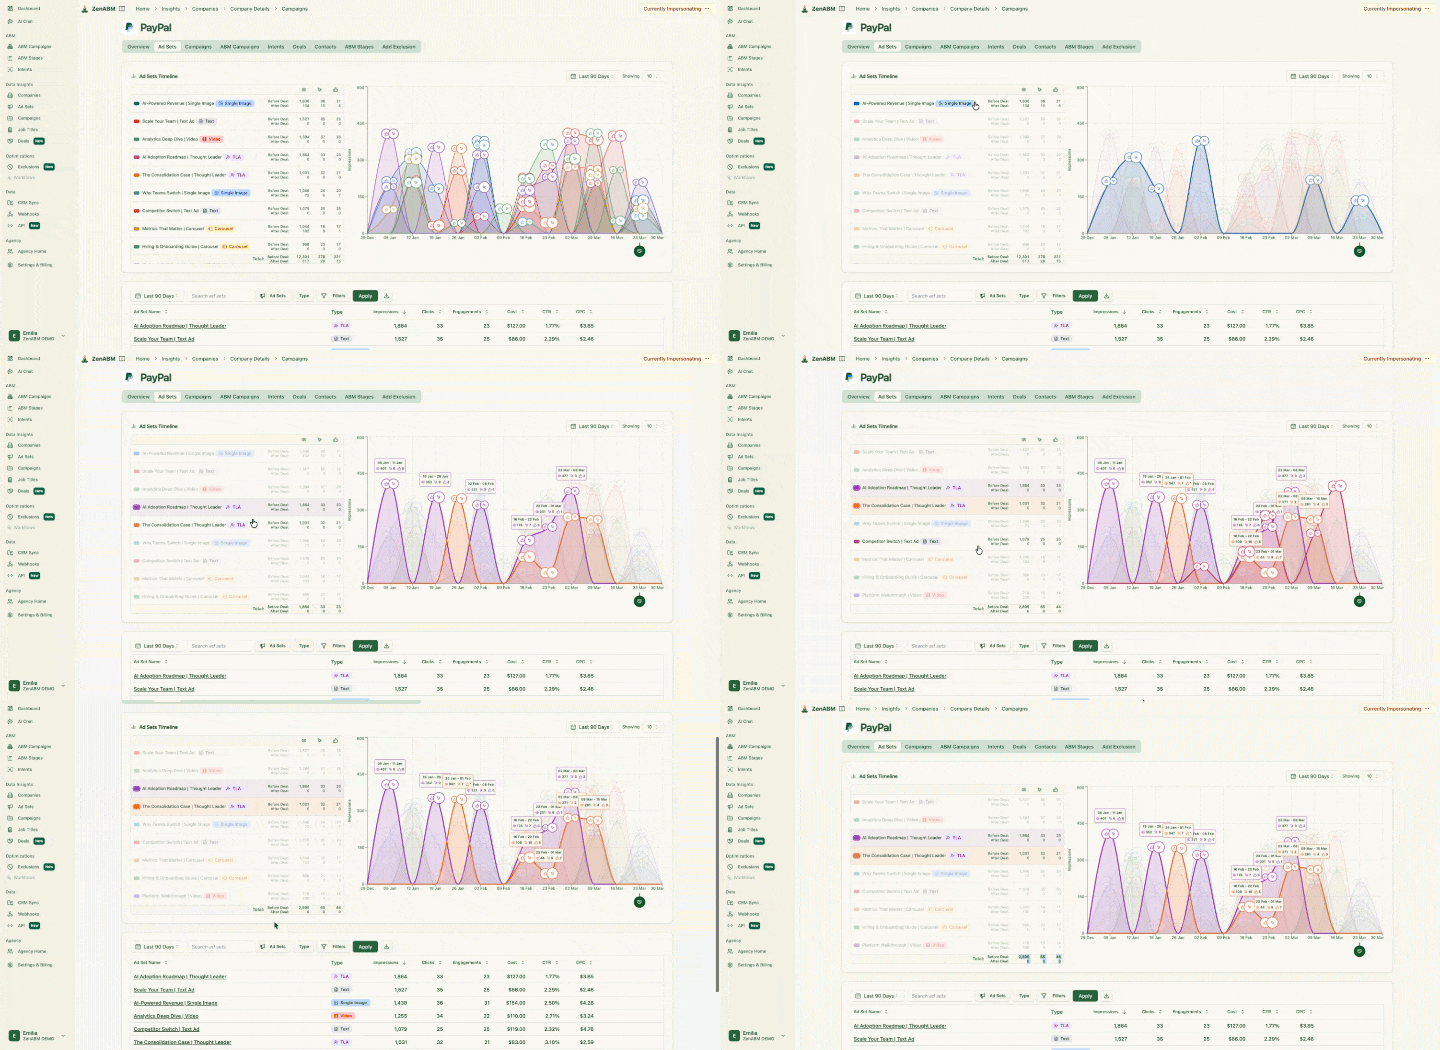
Expected result: for each deal you can say which ad sets the account saw and when.
Put LinkedIn Ads, Google Ads, Reddit Ads, AI referrals and organic visits on one company journey. Your CRM's historical source property is constantly overwritten, so direct traffic and paid search eat LinkedIn's credit. In ZenABM the non-LinkedIn channels rely on the HubSpot integration.
Expected result: a deal logged as Direct now shows the months of LinkedIn exposure behind it.
Step 1 asked for a rule, so here is how I'd build one.
Set three things: an impression threshold sized to your targeting, an engagement gate and a lookback window sized to your sales cycle. Then check the rule against your own deals before you report with it.
Influenced deal = the account crossed your impression threshold and your engagement gate, inside the lookback window, before the deal was created
I didn't start there. For a long time I reported with ZenABM's default, 10+ impressions in 180 days, and I was wrong to treat it as proof of anything. When I finally tested it on our own account, that rule marked about half of our deals as influenced, and those companies opened deals at 1.2x the rate of everyone else, which could be luck 😬
So here is each part, with the reasoning.
Impression threshold = ICP members you target per account x 7 to 15 impressions per member
Ten impressions spread across a 50-person buying committee means most of the committee never saw you. The threshold has to scale with how many people you target in the account:
Who you target | ICP members per account | Impressions per member | Threshold |
|---|---|---|---|
Small accounts (10 to 200 employees) | 3 | 10 | 30 impressions |
Mid-market | 10 | 10 | 100 impressions |
Enterprise buying committee | 50 | 7 to 11 | 350 to 550 impressions |
A few things to tune:
Impressions on their own are a weak signal, and this is the part I had to learn from the data. Across 7,466 first deals from 118 ZenABM customers (about 1.17M target accounts, 180 days before each deal), accounts with 1 to 49 impressions opened deals at 0.4x to 0.6x the average rate. At 50 to 199 impressions there was no real difference (0.9x). Only at 200+ did reach start to show up, at 1.8x.
Engagement moved the numbers much more: 10+ engagements came with 3.3x and 10+ clicks with 3.7x. So a sensible starting rule is:
200+ impressions AND (3+ clicks OR 10+ engagements), inside the window
A gate also makes the number easier to sell internally. Tim Davidson from B2B Rizz picks 3+ paid clicks in the 90 days before someone became a demo, because it is easier to get buy-in than for impression-only rules.
You can also tier deals instead of calling them influenced or not. Miles Beard tiers influence like this:
Tier | Impressions | Clicks or engagements |
|---|---|---|
Low | 10+ | 3+ clicks or engagements |
Medium | 100+ | 3+ clicks or engagements |
High | 500+ | 10+ engagements |

Here is the arithmetic on the six-figure deal from the summary. It had 563 impressions, which clears a 200 threshold almost three times over. With 20 engagements and 18 clicks it also passes the gate and lands in the high tier (500+ impressions, 10+ engagements), yet HubSpot attributed it to LinkedIn not at all.
Lookback window = 2x your sales cycle, counted back from the day the deal was created
A 90-day sales cycle gives a 180-day window. Buyers see ads long before they enter the CRM, so a window the length of the cycle itself cuts off the part LinkedIn is best at.
We use 180 days. In our own CRM review, the gap from first impression to deal creation was about 5 months, and the median from first impression to closed-won was 188.5 days. A 30-day window only works if frequency is persistently high, while 180 days reports more pipeline but with more room for doubt.
Two more guardrails keep the number honest. Count only deals created after the account crossed the threshold (impressions after the deal opened can't have created it), and report new business separately, because renewals inflate impression counts from existing customers.
I go through the threshold math and the guardrails in more detail in our guide to influenced pipeline for LinkedIn Ads. And once you report it per campaign, an influenced pipeline attribution report is the format that holds up in a board meeting.
A rule built from a formula is still a guess, though. The next step is to test it.
The ones built on engagement, not reach. Signal-based deal attribution tests each candidate signal against your own deals and keeps the ones where companies with the signal open deals at a higher rate than companies without it.
Think of every attribution model as a threshold. Last click is one too, just a very low one (1 click). So the useful question about any rule is whether accounts that cross it really open more deals.
To answer it, each signal gets three numbers:
You need all three. A signal with 10x lift that covers 1% of your deals makes a nice slide, but you can't report a quarter with it.
Here are the broadest signals that held up in the 7,466-deal study, ranked by phi:
Signal (180 days before the deal) | Lift | Share of deals | Phi |
|---|---|---|---|
ABM stage Interested | 3.3x | 14.1% | 0.024 |
200+ impressions + 10+ engagements + 3+ clicks | 4.0x | 4.0% | 0.023 |
1,000+ impressions | 4.4x | 2.8% | 0.022 |
10+ engagements | 3.3x | 4.8% | 0.022 |
10+ clicks | 3.7x | 3.5% | 0.021 |
50+ engagements | 6.8x | 1.2% | 0.019 |
A few things stood out:
Because none of these signals is strong on its own, and most accounts are too small to confirm them. No signal in the study reached a phi of 0.1, so none of them predicts a deal by itself.
Significant at = (1.96 / phi)², in target accounts
That is how many target accounts you need before a signal of that strength can be told apart from luck. For 50+ engagements it is about 10,000 companies, and for the carousel click about 45,000. If your list has 3,000 accounts you can't confirm either, however good the lift looks.
There is also the winner's curse. I tested 979 signals, and with that many some will look great by chance. So every combination had to hold up on a random half of the accounts it wasn't found on. And a company already talking to your sales team may simply engage more, which means the arrow can point the other way.
On ZenABM's own account (38,110 target companies, 47 first deals), reach without any engagement came in at 0.7x. Engagement was a different story: one or more engagements came with 7.3x lift and covered 17% of our deals. Five or more had the best phi (0.040, with 12.4x lift and 15% of deals), but I picked the broader one.
Influenced deal at ZenABM = the account engaged with our ads at least once in the 180 days before the deal was created
With 47 deals and a median deal of $199 (most of our deals are self-serve), I treat that as a strong hint, not proof. Your rule will look different, and it should.
A threshold is binary: a deal is influenced or it isn't. The Influence Coefficient is our attempt at the in-between. Each signal that holds up in your data gets a score, and each deal is credited in proportion.
Signal score = phi x log2(lift)
A company's raw score adds up its signals with diminishing weight: the best signal counts in full, the second at half, the third at a third. The coefficient is 100 x that raw score, divided by the highest raw score in your workspace. So a $50k deal from a company with a coefficient of 44 counts as $22k of influenced pipeline, not $50k.
ZenABM reruns the test every Friday over the 180 days before each company's first deal. It leaves out HubSpot website visits from the final 14 days, because a pricing page visit the week before a deal mostly tells you the deal was already in motion. You'll find it in the Deals dashboard, under the Deal influence signals and Influence thresholds management tabs, which are rolling out to beta teams first.
Here is a comparison of engagement metrics for 59 deal accounts versus 488 non-deal accounts:
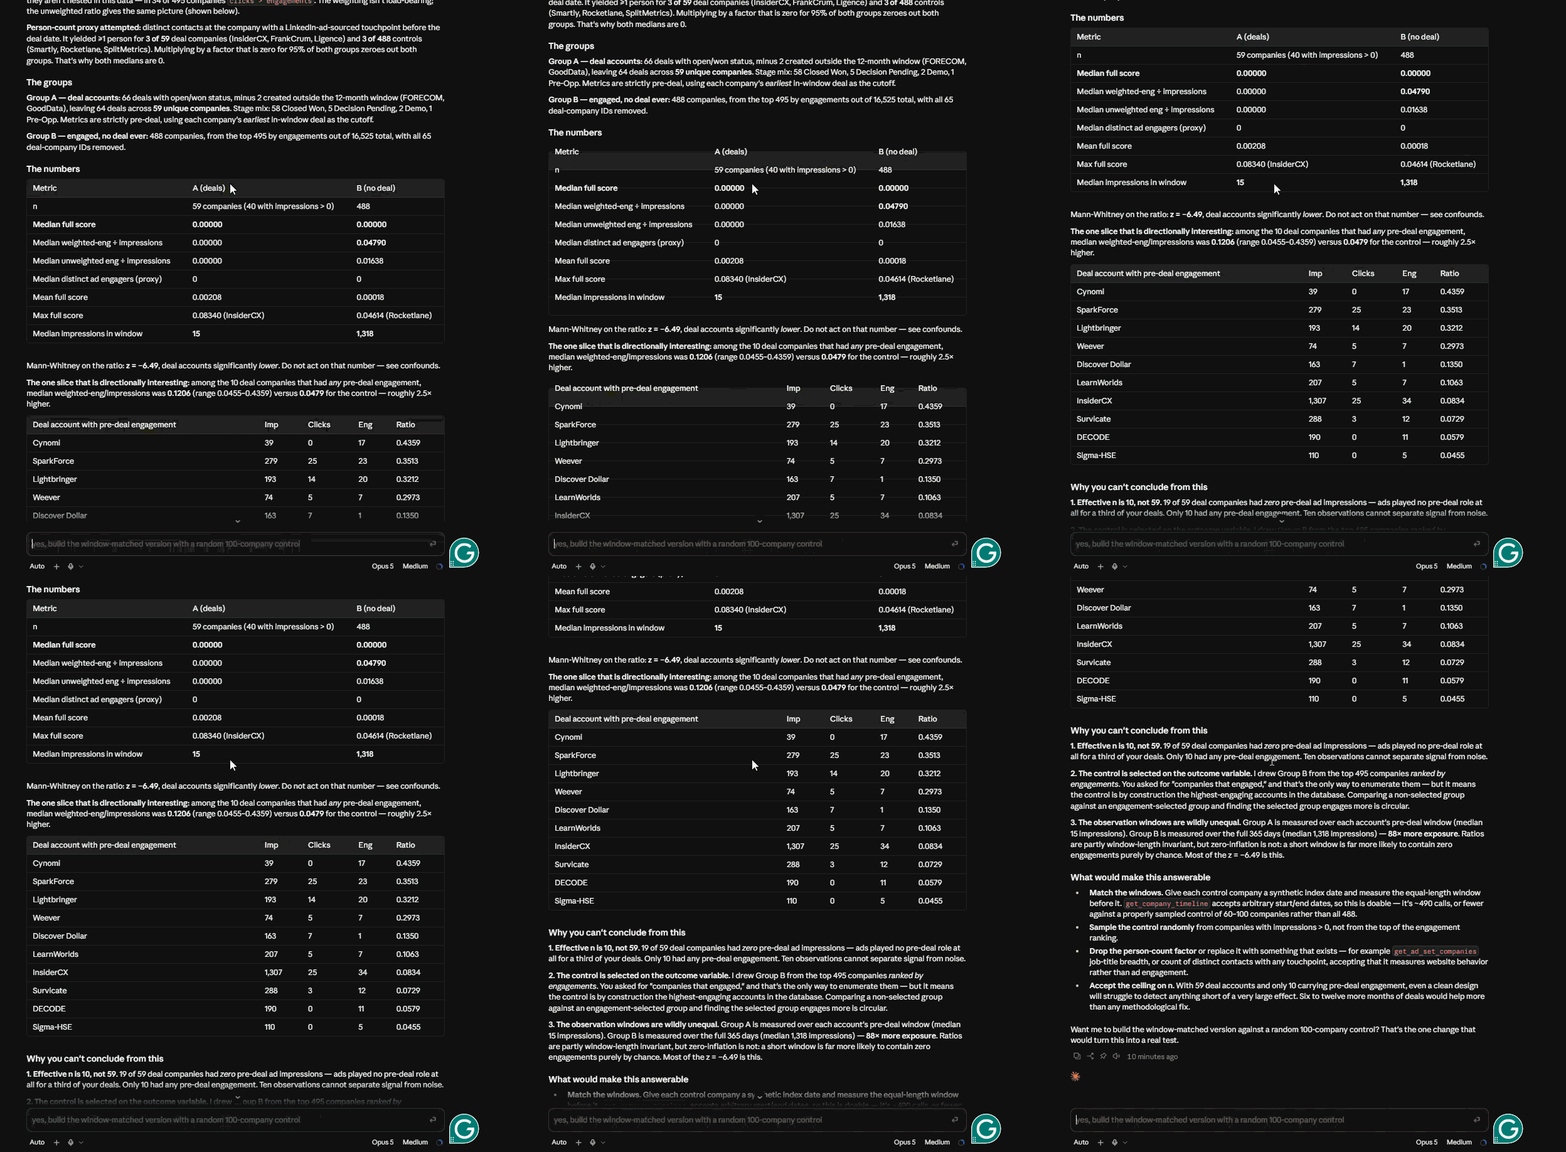
If you'd like to run the search yourself, connect the ZenABM MCP server to Claude and use a prompt like this:
Pull every target company from the last 180 days and mark whether it opened a deal. For each company, collect what happened before the deal: LinkedIn impressions, engagements and clicks by ad format, highest ABM stage and website visits (leave out the 14 days before the deal). Test single signals first, then combinations, and keep a combination only if it beats its better part. For each signal give me lift with a 95% range, coverage, phi and the account count it is significant at. Drop anything with fewer than 5 deals or a range that crosses 1x, check the survivors on a random half of the accounts, and rank by phi.
The full study, with all the format and ABM stage cuts, is in our post on LinkedIn ad signals that correlate with deal open rate. With a tested rule in hand, check it against a deal you know.
Open a deal where you know LinkedIn engagement happened and confirm the touchpoints show up before it opened.
My test deal was the six-figure one: 563 impressions, 20 engagements and 18 clicks on our TLAs, with HubSpot attributing nothing. That is also what Cristina Maliţa's example looks like from the CRM side, 1,000+ impressions and clicks for months and Direct Traffic under last click.
Three failures come up most:
Checking by hand means pasting campaign and CRM exports together. ZenABM's MCP server connects your LinkedIn ads to Claude, ChatGPT or Cursor. It reads and writes, so you can check a deal's touchpoints without opening Campaign Manager. The /revenue-attribution skill runs the analysis from one command.
Here is Claude pulling pipeline data through the ZenABM MCP server:
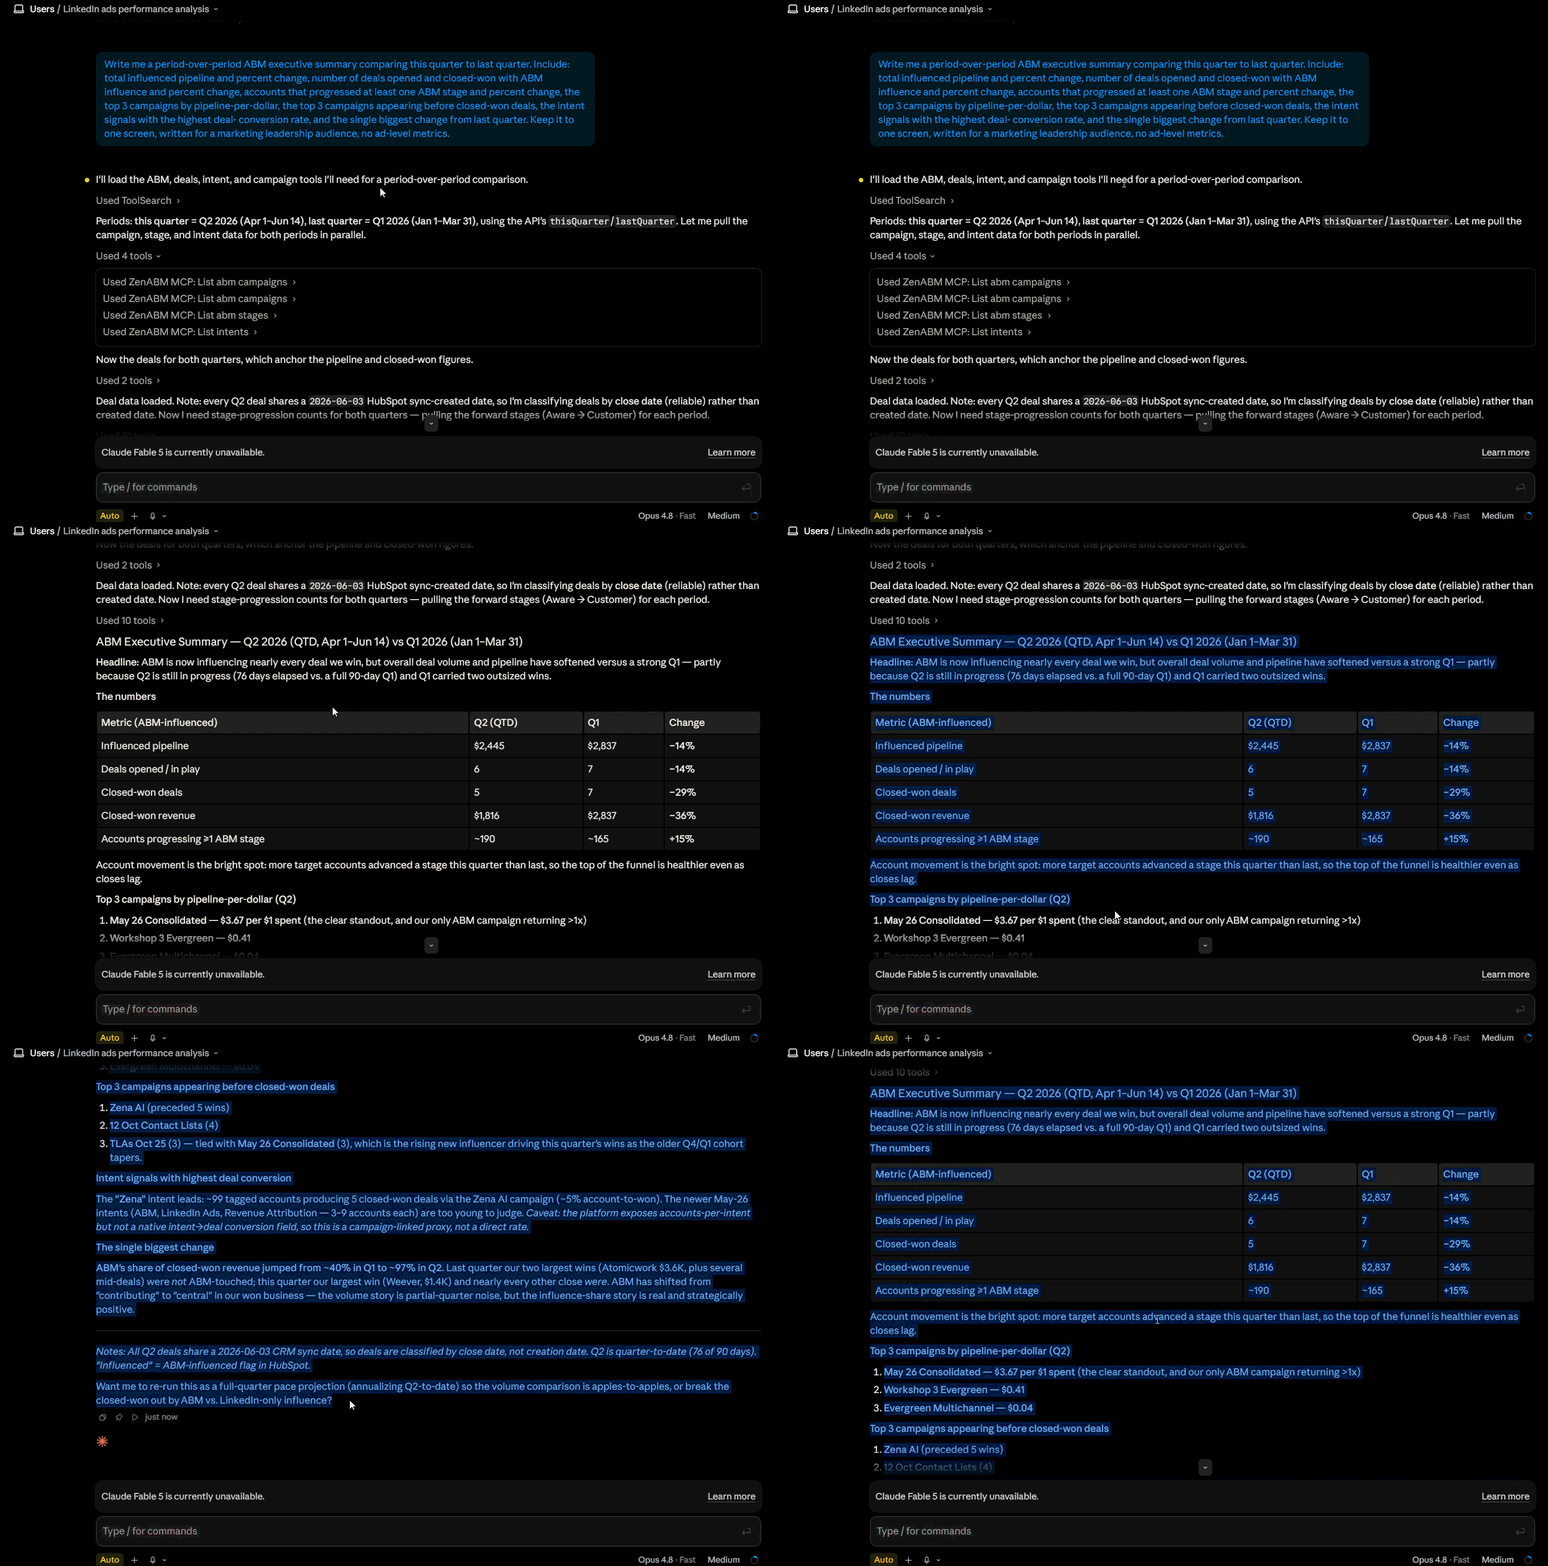
A checked setup lets you use it on won and lost deals.
Open closed-won and closed-lost deals side by side, read the ad touchpoints behind each, tier them and bring named companies to sales.
For each deal, see the impressions, clicks, engagements and spend before it opened and before it closed, by ad set and campaign. Here is the view that shows which campaigns touched a deal over time:
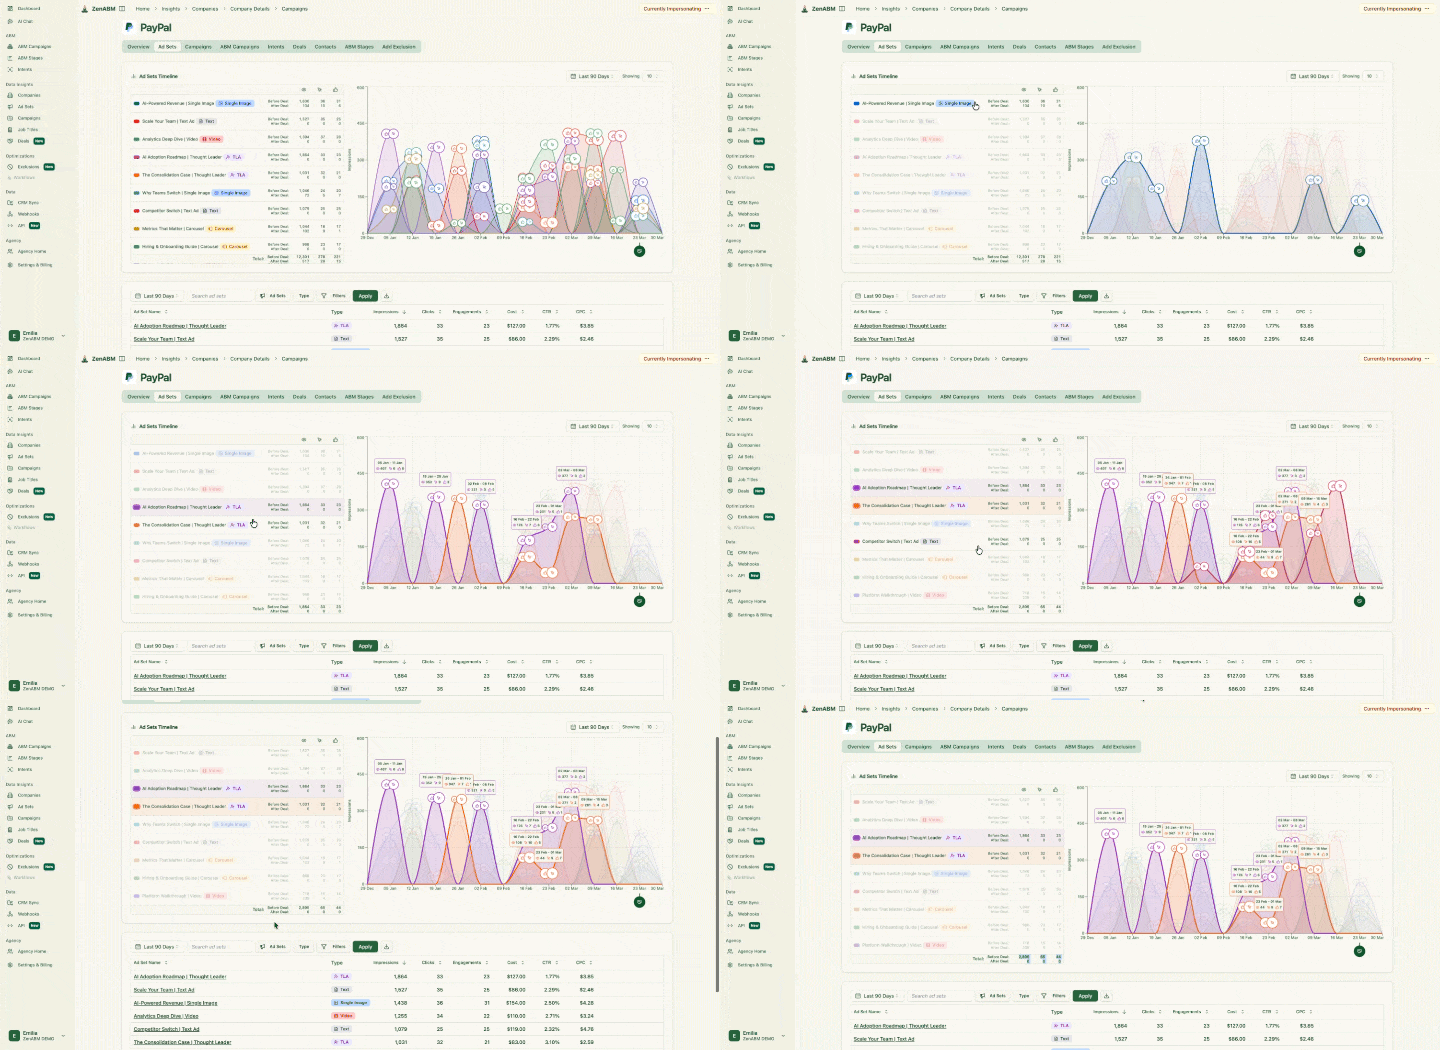
Label each influenced deal low, medium or high with the thresholds above. Leadership trusts the number more when you also show which deals did not make the cut.
List open deals that got no ad exposure. They will be harder to close, so put customer testimonials and social proof in front of those accounts rather than cold content.
Show a specific company in the CRM with its LinkedIn impressions and the source the buyer named, not an aggregate score. A named account is evidence, and a blended multi-touch number is an argument.
Sheila Coque compared influenced and non-influenced deals for two clients:
Client | Influenced deals | Close rate (influenced vs not) | Average deal size (influenced vs not) |
|---|---|---|---|
A | 74 of 230 companies | 18% vs 6% | $163K vs $84K |
B | 283 of 731 companies | 49% vs 35% | $18K vs $9K |
A smaller client got 5 contracts directly attributed, $60,000 in revenue on $15,500 of spend, which is 3.9x. Compare your own win rates with typical ABM conversion rates from LinkedIn ads.
Teams spend hours each week moving CRM credit between channels while believing it means little. A win loss review built on deal touchpoints replaces that work 🤷♀️
Reading deals goes wrong in predictable ways, though.
Five mistakes lead to bad budget calls, and each has a simple fix.
Platform return reflects what a channel claims, not what it caused. One industrial automation marketer saw Business Manager report an 85:1 return on ad spend and dismissed it as LinkedIn "putting two and two together and getting 500". The cost is a budget decision based on a number nobody believes. The fix is to report from your own deal data.
Here is that mistake and its fix in one picture:

Ali Yildirim says that three ad impressions on a deal deep in sales should not carry the same weight as the outbound sequence that started it. The data agrees with him: accounts with fewer than 50 impressions opened fewer deals than average. If you count them, you build a prettier vanity metric. Set the threshold and the engagement gate in advance and tier the deals.
Liam Collins puts it like this: attribution debates settle by whoever owns the dashboard, while incrementality tests settle by a pre-registered win condition. Months of model debate cost you time, so run a holdout instead (more on that below).
Justin Rowe from Impactable found a client's CRM showing zero pipeline influence, yet 11 companies in active pipeline had seen the ads and ended up in real deals. The attribution window had closed before the cycle began. Budget decisions made from that report would have been wrong. Read the account timeline, not the source field. Our guide to last-touch, first-touch and view-through models covers why.
In our LinkedIn Ads TLA Q&A, Gabriel Ehrlich from Remotion audited 481 leads and found the real LinkedIn number was roughly 40 to 50 percent higher than the dashboard. Add a "how did you hear about us" field and read it next to the CRM source.
I push back on attribution as theatre, so the fix for all five is the same: define a strict rule, test it and admit some pipeline would have closed anyway. Which brings us to the limits.
It shows correlation, not causation, so use a test when you need proof.
Influence is generous by design. Some influenced deals were also driven by other channels, like cold search ads, and at our scale I couldn't separate them. A growth and operations lead challenged a high influence score on a deal he sourced himself, calling it correlation dressed up as causation. He was right: that deal came through a colleague's recommendation and ads played no role.
Self-reported answers can also disagree with dashboards, as when a six-figure deal showed paid search while the form fill said LinkedIn.
Signal-based attribution doesn't fix this. Lift, coverage and phi tell you a link is real and how much it matters, but it is still correlation, only with a baseline instead of a screenshot.
When your CFO accepts no modelling answer, run an incrementality test:
Liam Collins' version is to pre-register one win condition, use two paired regions, leave the holdout untouched and keep it dark for 12 weeks. The measure is what happened without ads, not whose dashboard gets credit.
It will hurt, OK? You give up some deals in the holdout half. And please don't shortcut it by comparing ABM deals with inbound deals. You picked the ABM accounts because you expected them to close bigger, so that comparison is rigged from the start.
So how does ZenABM do each step?
ZenABM covers the steps above, from matching deals to companies through to testing the rule and the weekly report:
Here is a company timeline across ad sets:
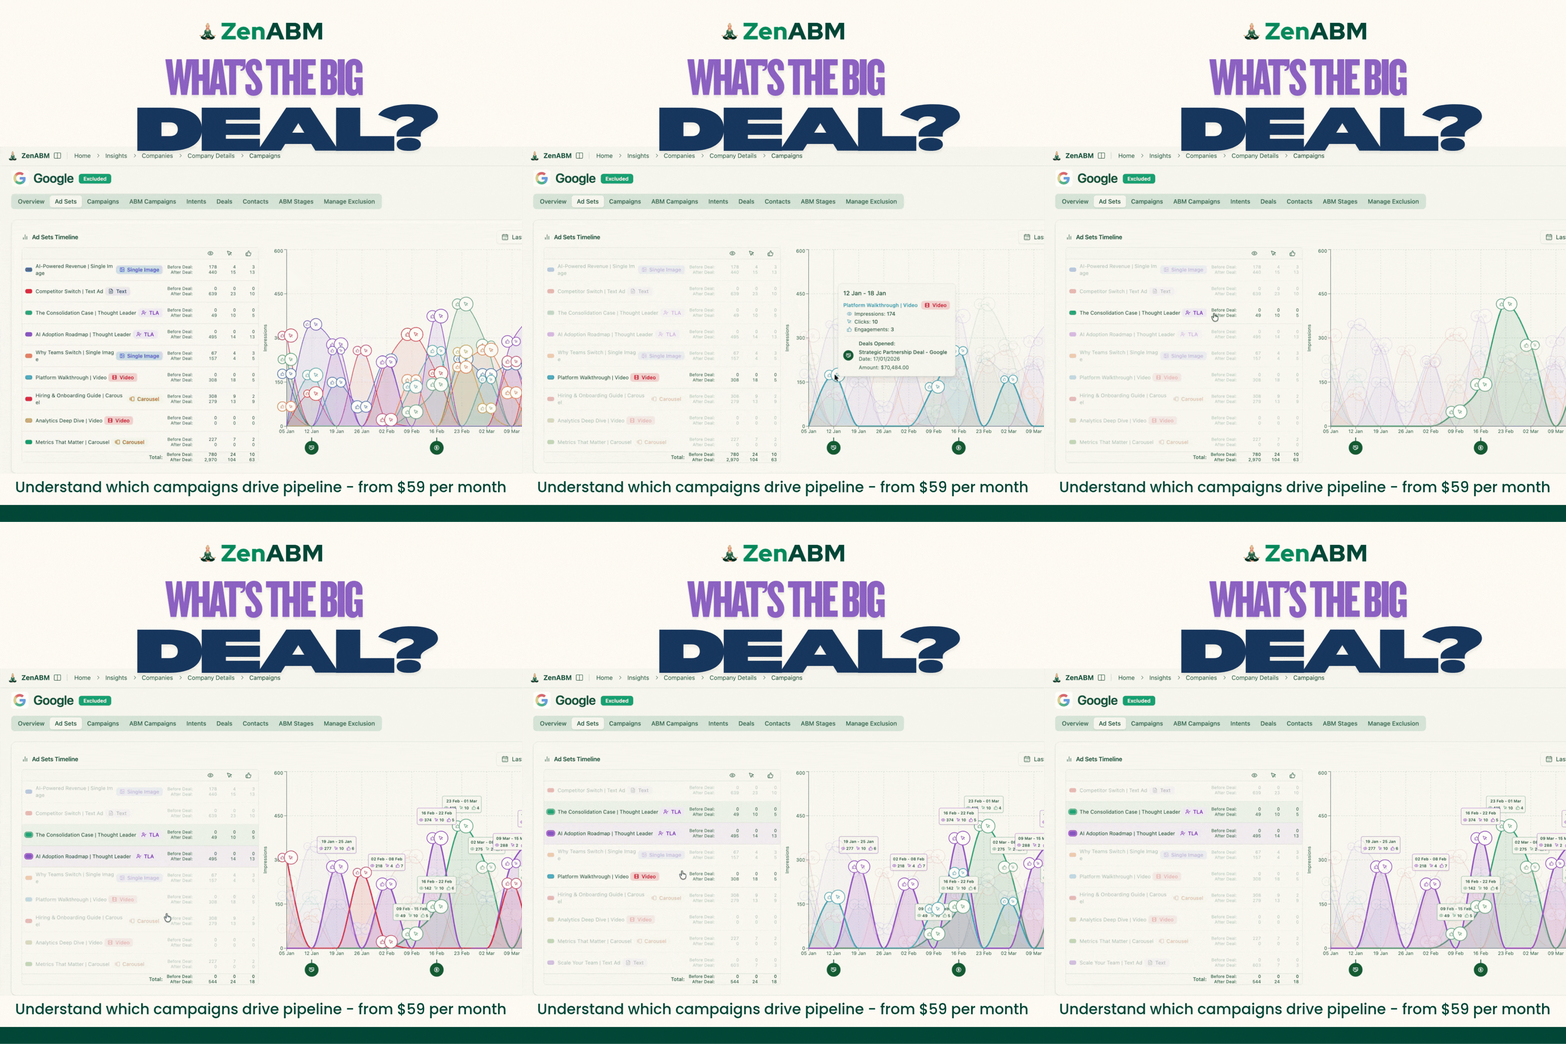
And this is Zena next to an Influenced Deals Summary:
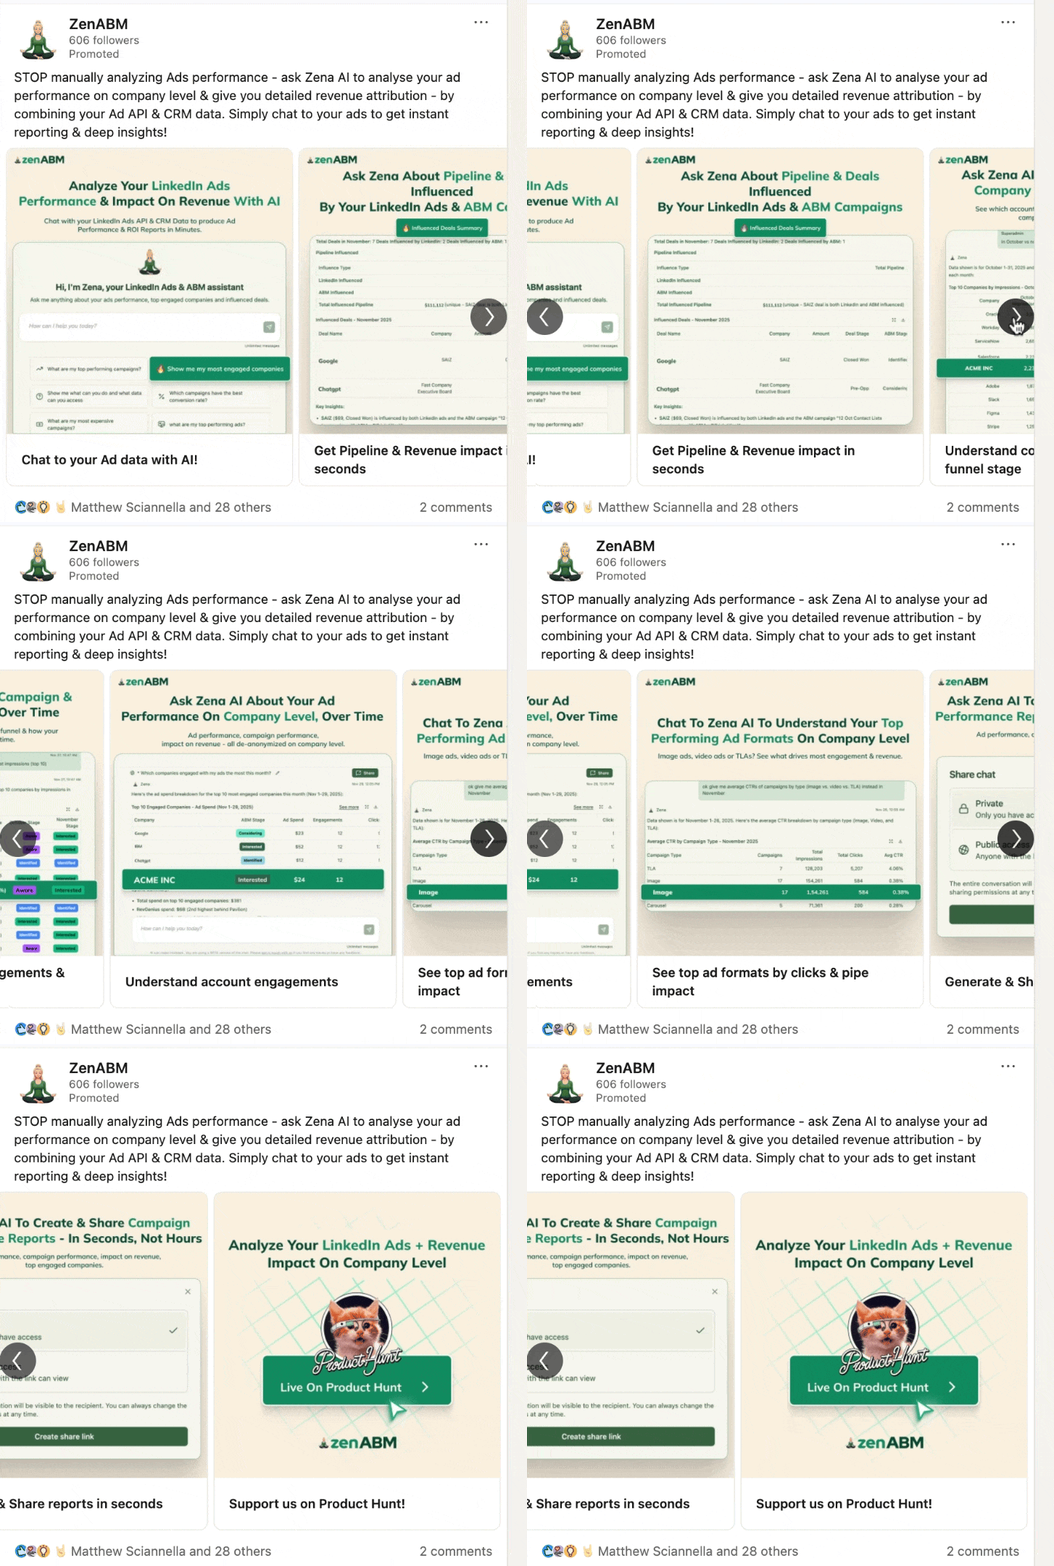
ZenABM starts at $59/month. A pragmatic order of work: write the rule, test it against your own deals, check it on one deal you know, then take named companies to your next win loss review. Which signal would your CFO accept? 😉
Try ZenABM free for 37 days
Connect LinkedIn Ads and your CRM in about 10 minutes and see influenced pipeline, revenue and pipeline per dollar for your own deals.

LinkedIn ads deal attribution shows the impressions, clicks and engagements that touched an account before a deal opened or closed. It credits the account, not the final click, which is why it shows LinkedIn's early work that last-touch hides. At ZenABM we count a deal as influenced when the account engaged with our ads at least once in the 180 days before the deal was created.
Set an impression threshold, an engagement gate and a lookback window before reporting anything. Size the threshold as ICP members per account x 7 to 15 impressions, add a gate such as 3+ clicks or 10+ engagements, and set the window to about 2x your sales cycle. A reasonable starting rule is 200+ impressions plus 3+ clicks or 10+ engagements. Then test it against your own deals and keep it fixed.
Signal-based deal attribution tests which ad engagement signals correlate with deals in your own data, instead of assuming a threshold. Each signal is scored on lift (deal rate with the signal vs without), coverage (share of deals it explains) and phi (how cleanly it separates deal companies). In our study of 7,466 deals, 10+ engagements came with 3.3x lift, while light reach of 1 to 49 impressions went with fewer deals.
Yes. Export closed-won companies from a contract spreadsheet and match them against Campaign Manager delivery data. Sheila Coque did this with 48 closed-won companies and found 24 had received paid exposure, with 5 contracts directly attributed to LinkedIn Ads. The 24 are influenced; the 5 are a smaller, directly attributed subset.
LinkedIn is a demand creation channel with a long cycle, so prospects see ads for months, then convert as direct or branded search and last touch gives LinkedIn zero. Cristina Maliţa's example: a prospect saw 1,000+ impressions, downloaded an e-book in March, then searched the brand in April and showed up as Direct Traffic. ZenABM's deal timeline shows that earlier exposure.
Deal attribution shows the touchpoints behind individual won or lost deals, before they opened and closed. Revenue attribution adds up influenced pipeline and closed revenue from those deals, per channel and campaign, over a period. One answers "what touched this deal?", the other "what did the channel influence overall?". ZenABM does both in the same dashboards.
About the author

