

©2026 ZenABM - All Rights Reserved.

Most ABM reporting answers the wrong question.
It delivers impressions, clicks, and cost per lead, then leaves the reader to guess whether any of it touched a deal. An ABM performance audit with Claude Code answers the only question that matters to a B2B marketing leader: what is actually driving the pipeline.
Not what is getting clicks, not what is cheap, but which ABM campaigns, which accounts, and which intent signals appear before real revenue.
This ABM performance audit with Claude Code takes about 40 minutes by asking Claude plain-English questions while the ZenABM MCP server pulls live LinkedIn Ads, ABM stage, and CRM deal data.
This is a program audit, not an ad audit.
It does not grade creatives, hunt wasted spend, or compare CTRs.
This audit sits one level up, at the account, pipeline, and revenue layer, where the question is whether the whole ABM motion is moving accounts toward deals and which parts of it deserve more budget next quarter.

Short on time?
Here’s a quick overview:
An ABM performance audit is a diagnostic about the program, not a status report about the ads.
The job is to connect three data sets that normally live in three different tools:
Campaign Manager shows the first, a spreadsheet of account stages shows the second, and the CRM shows the third.
Stitching them together by hand is the reason most teams never actually answer “what drives pipeline,” because the join is tedious and the data has moved by the time it is finished.
Claude Code collapses that into a conversation.
Once the ZenABM MCP server is connected, the model can read companies, ABM campaigns, ABM stages, intent signals, and CRM deals on demand and join them across sources.


It selects the right tools from the 60+ available, pulls live data, and returns a structured answer.
Read questions change nothing in the account, and any write action requires explicit confirmation, so this audit is read-only end-to-end.
The reason a conversation beats a dashboard for this specific job is that the answer to “what drives pipeline” is never one number: it is a thread.
The question of which campaigns influenced deals leads to which of those deals were enterprise, which leads to what intent signal was fired first, which leads to whether stage movement accelerated.
Each answer reshapes the next question, and that follow-the-thread investigation is what a conversational interface does well and a fixed dashboard cannot do at all.
The point is to stop reporting on activity and start measuring contribution to revenue, which is the whole reason ABM exists.
Scope note before starting.
If during this audit a creative bleeding budget or an ad set with a poor CTR surfaces, note it and move on.
That work belongs in the ad performance audit, not here.
This pass stays at the account and pipeline level on purpose, and keeping it there is exactly what makes the output actionable at the leadership level.
Starting the ABM performance audit here makes sense because pipeline per dollar reorders everything a team thought it knew about its campaigns.
The campaign with the most clicks is rarely the campaign with the most pipeline, and the campaign with the lowest cost per click is often the one influencing nothing.
Ranking by the influenced pipeline, divided by the spend cuts through both illusions in a single view.
Now, as ZenABM pulls company-level ad engagement data for each ad creative, ad campaign and broader ABM campaigns from LinkedIn Ads API and also connects to your CRM to pull deal value of ad-engaged companies, it is able to lay out proper ABM analytics dashboards in its own UI and also provide attribution metrics like pipeline per dollar into your Claude Code terminal via the ZenABM MCP server.
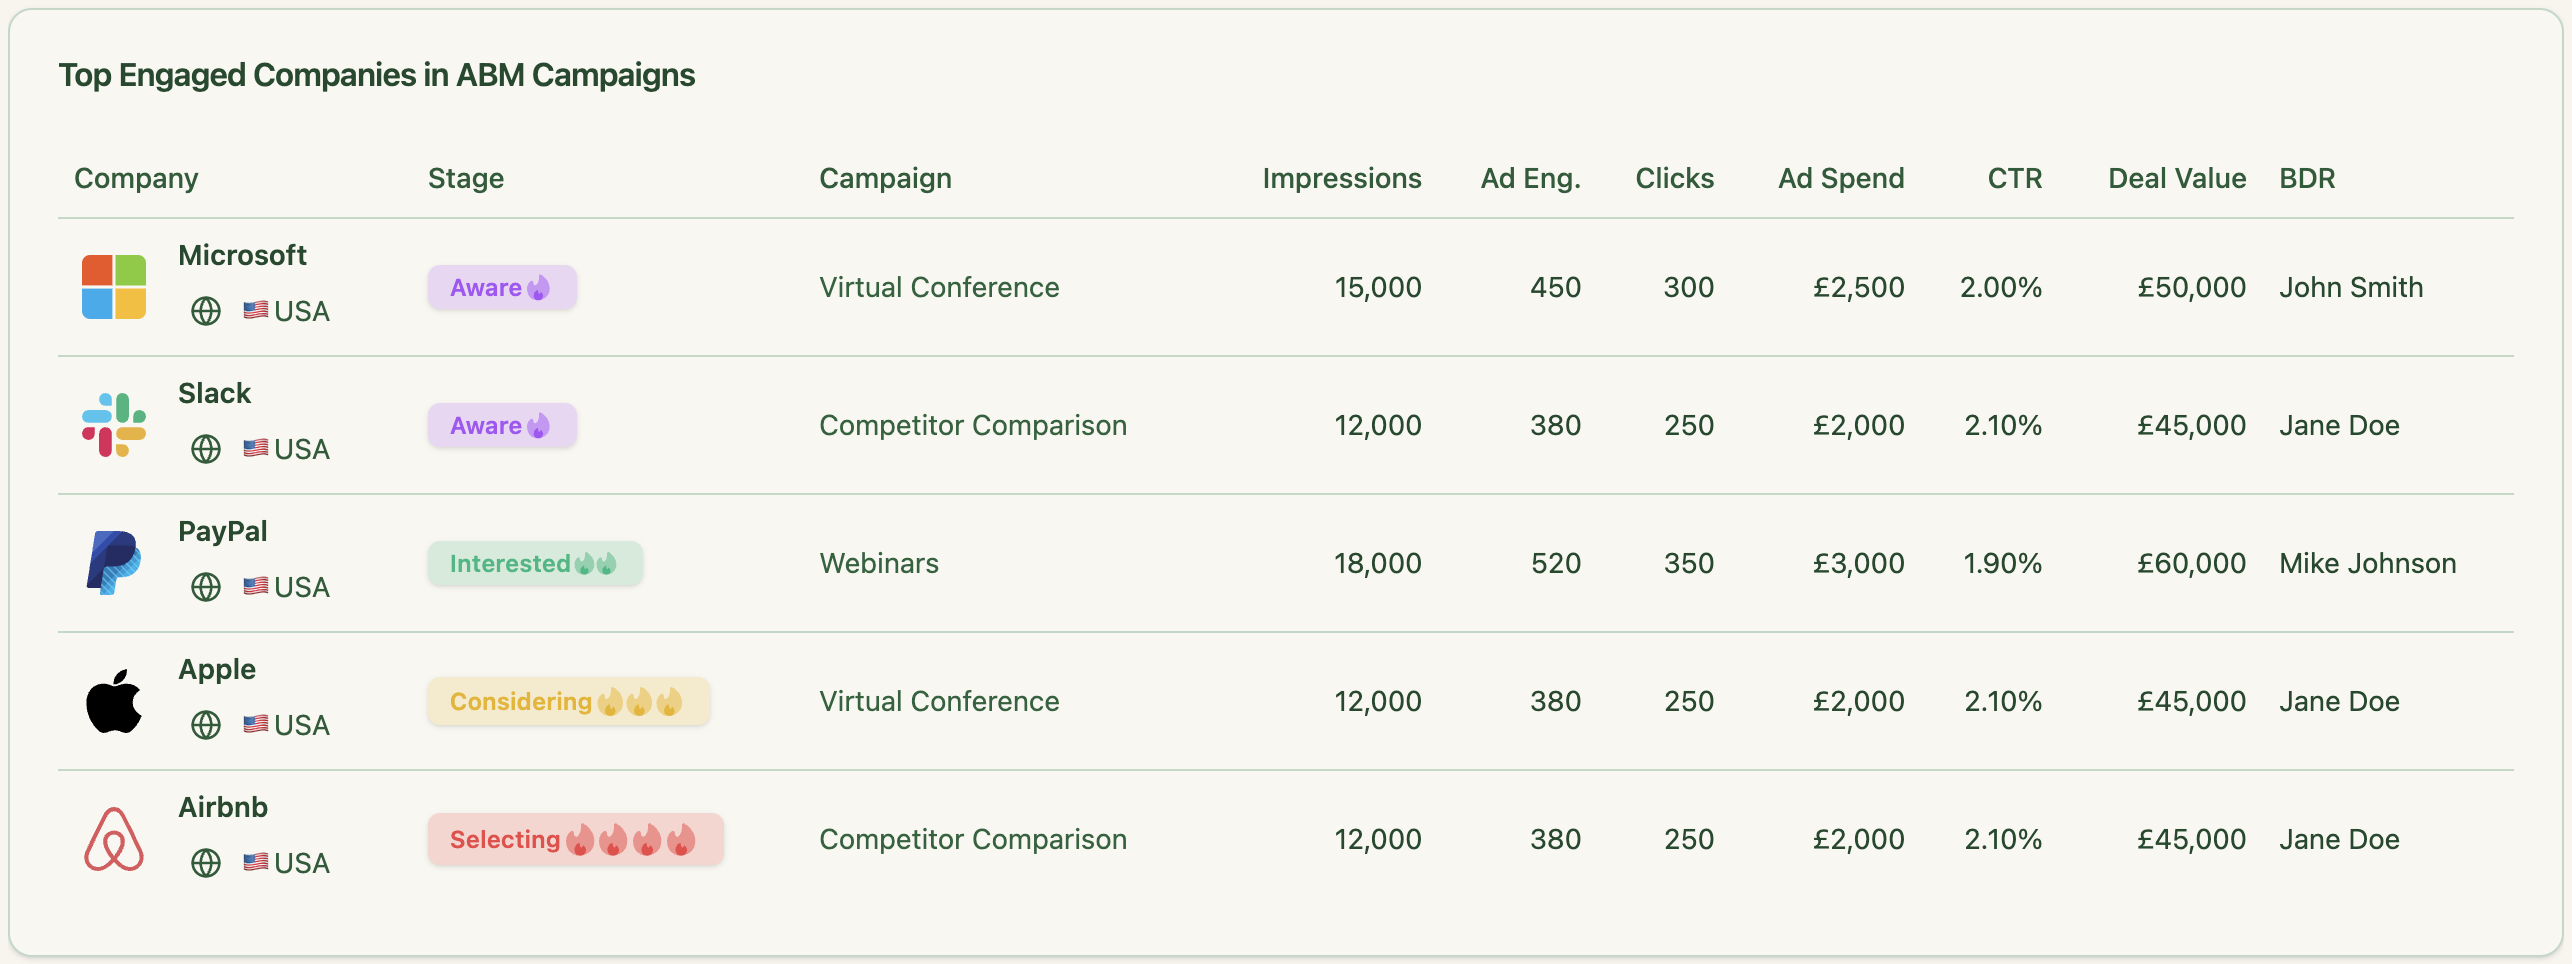


Here is the prompt you can use to get pipeline per dollar and similar details:
Audit my ABM campaigns by pipeline efficiency over the last 90 days. For each ABM campaign list: spend, accounts reached, accounts that moved at least one ABM stage, number of deals opened where an account had prior exposure to that campaign, total influenced pipeline value, and pipeline-per-dollar (influenced pipeline/spend). Sort by pipeline-per-dollar descending. Flag any campaign in the top third of spend whose pipeline-per-dollar is in the bottom third. Those are the expensive campaigns that are not pulling their weight.
How to read it: the top of this list is where the next dollar should go, and the flagged rows are where current dollars are stranded. A campaign that spends a lot and influences little pipeline is not underperforming in a CTR sense; it is misaligned with revenue, and that is a budget-reallocation decision for next quarter rather than a creative tweak this week. Watch for the opposite case too: a low-spend campaign with outsized pipeline-per-dollar is a scaling opportunity that has been starved. This is the account-level version of measuring real LinkedIn ABM ROI rather than vanity engagement.
Maximilian Herczeg (ex-LinkedIn) makes the point in his LinkedIn post that most teams optimize for the wrong stage of the funnel entirely.
“Whenever I talk to companies, they talk about leads and demo bookings. That’s what they want, that’s what they optimise for. Me: ‘What happens once you have them in your pipeline? What marketing strategies do you have in place for that?’ Once more: silence.”
That silence is the gap this audit closes.
Pipeline-per-dollar forces attention past the demo booking to ask what each campaign did to the deals that followed.
Pipeline per dollar tells you which campaigns produce revenue.
ABM stage movement tells you why, by showing how accounts flow through the funnel and where they get stuck.
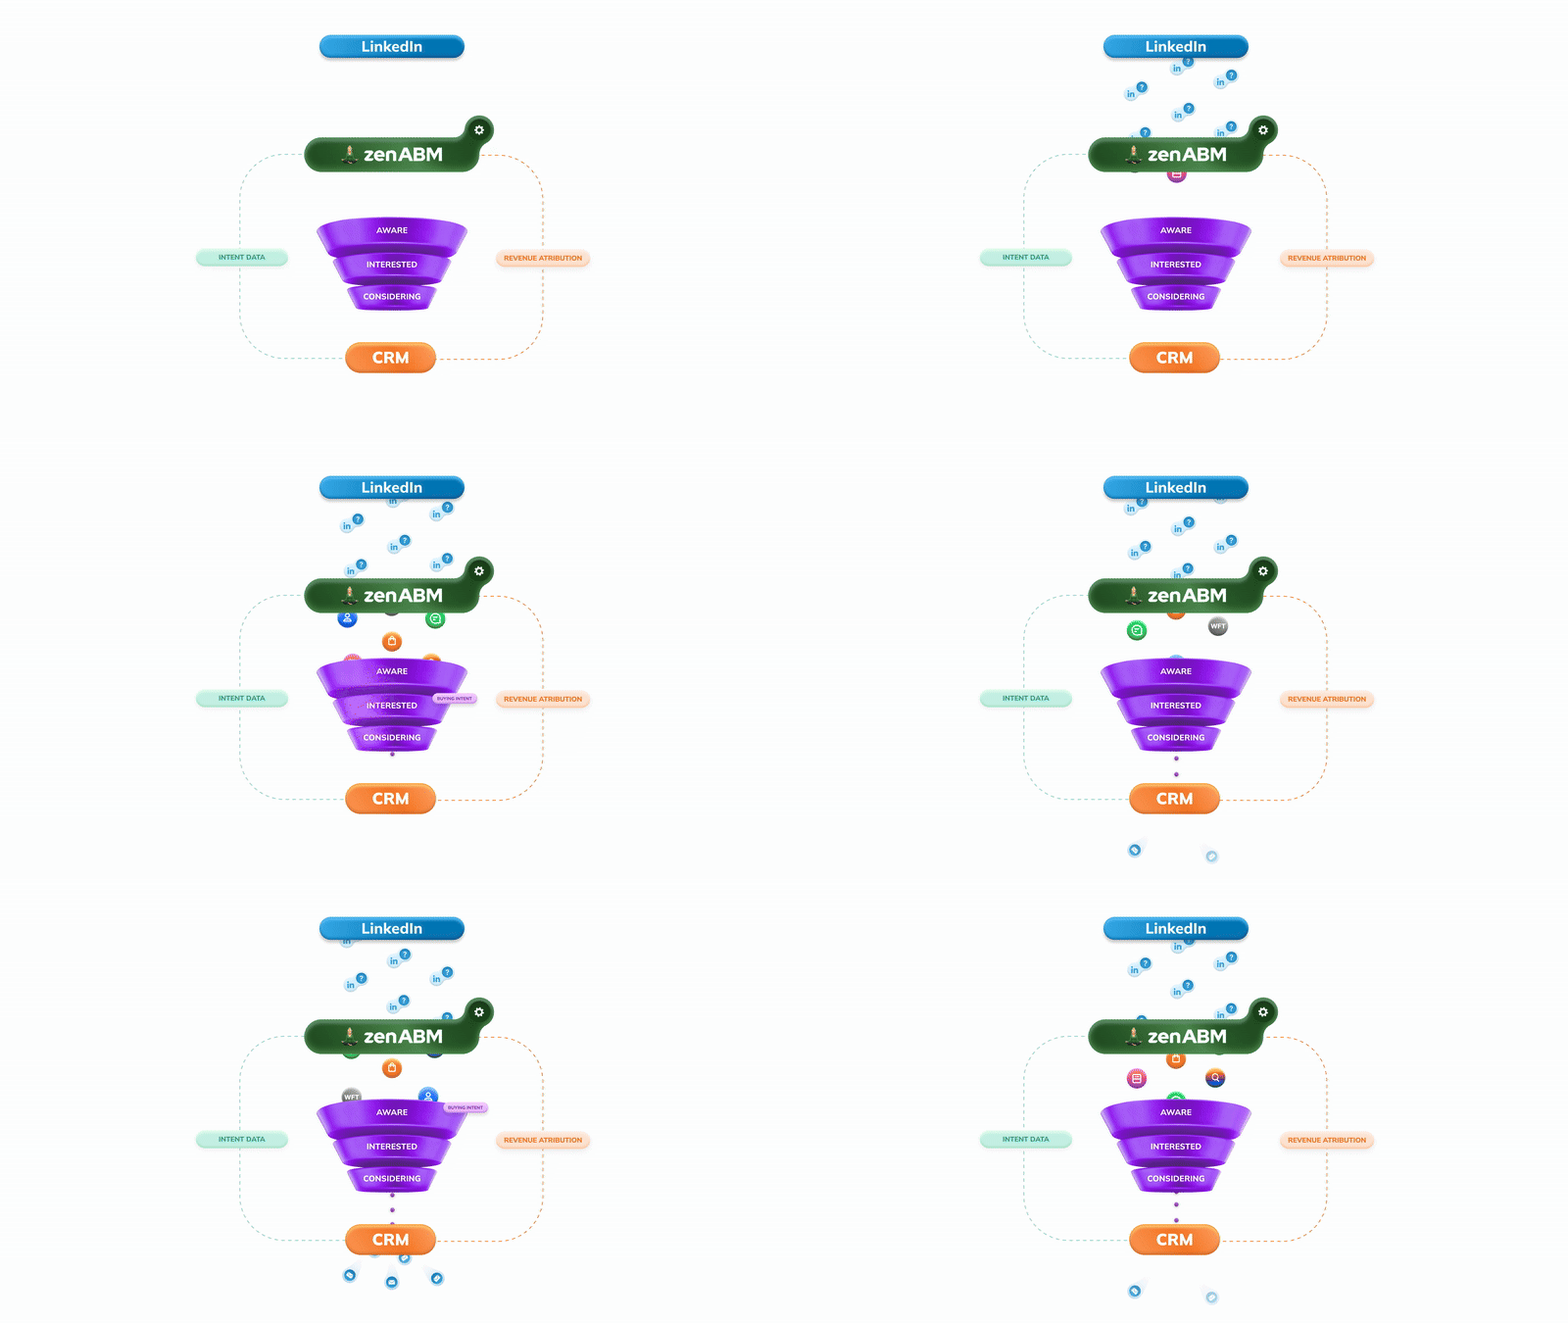
In ZenABM, stages run from aware to interested to considering, and that progression is joined to the deal data, so it is possible to see not just how many accounts sit in each stage but how fast they move and where the drop-off is severe.


A stall is a leak that no spend report will ever show.
An account can sit in the “interested” stage for two months, absorbing impressions and appearing perfectly healthy on a clicks dashboard, while quietly going nowhere.
The following prompt finds those accounts:
Audit my ABM stage movement over the last 90 days. Show how many accounts entered each stage (aware, interested, considering), how many progressed to the next stage, and the median days spent in each stage before progressing. Calculate the stage-to-stage conversion rate. Flag the stage with the worst conversion rate and the accounts that have been stuck in one stage longer than the median without progressing. Those stalled accounts are where the program is losing momentum.
How to read it: two numbers matter. The worst stage-to-stage conversion rate shows where the program structurally breaks, which is usually a content or offer gap at that stage rather than a targeting problem. The list of stalled accounts is the sales-and-marketing follow-up list: the specific companies that engaged, climbed partway, and then went quiet. Those accounts are warmer than any cold prospect, and they are sitting in the funnel right now. Pairing this with the campaign view enables a sharper question: which campaigns actually move accounts between stages versus which only generate first-touch awareness that never progresses.
This is also where the audit stops being abstract.
A stalled “considering” account with a deal-sized company behind it is worth a Slack message to the account owner today, not a line in a quarterly deck.

This is the heart of the ABM performance audit: the question every leadership team asks, and almost no team can answer.
Which campaigns and ad sets show up most often before a deal opens, and before it closes won.
Not which campaign got the last click, but which ones consistently appear in the exposure history of accounts that became real opportunities.
There are two versions of this question, and both are worth running.
The first looks at deals that opened; the second looks at deals that are closed-won, because the campaigns that create opportunities are not always the campaigns that help close them.
How to read it: the side-by-side comparison is the insight. A campaign that shows up constantly before deals open but disappears before they close is an opener: a top-of-funnel awareness engine worth keeping funded for that specific job rather than expecting it to close anything. A campaign that appears before closed-won deals is a closer, and it deserves more budget and more of the best accounts in the program. Most teams fund these backwards, pouring money into the loud opener and starving the quiet closer. This is the program-level equivalent of building a proper revenue attribution model for LinkedIn ABM.
One caution: a common pre-deal touchpoint is correlation, not proof of cause. Read it as “this campaign is in the room when deals happen,” then sanity-check it against the enterprise-deal view below, because a campaign that touches the biggest deals is a much stronger signal than one that touches many small ones.
Intent is the most over-promised metric in ABM.
Every tool will show a spike in account intent and imply a deal is coming.
The honest question this part of the audit answers is narrower: which intent signals actually preceded pipeline, and which were noise that never converted.
That answer only emerges by joining intent history to deal outcomes, which is exactly what ZenABM’s MCP server enables through its company buyer intent tracking and ABM stage data.
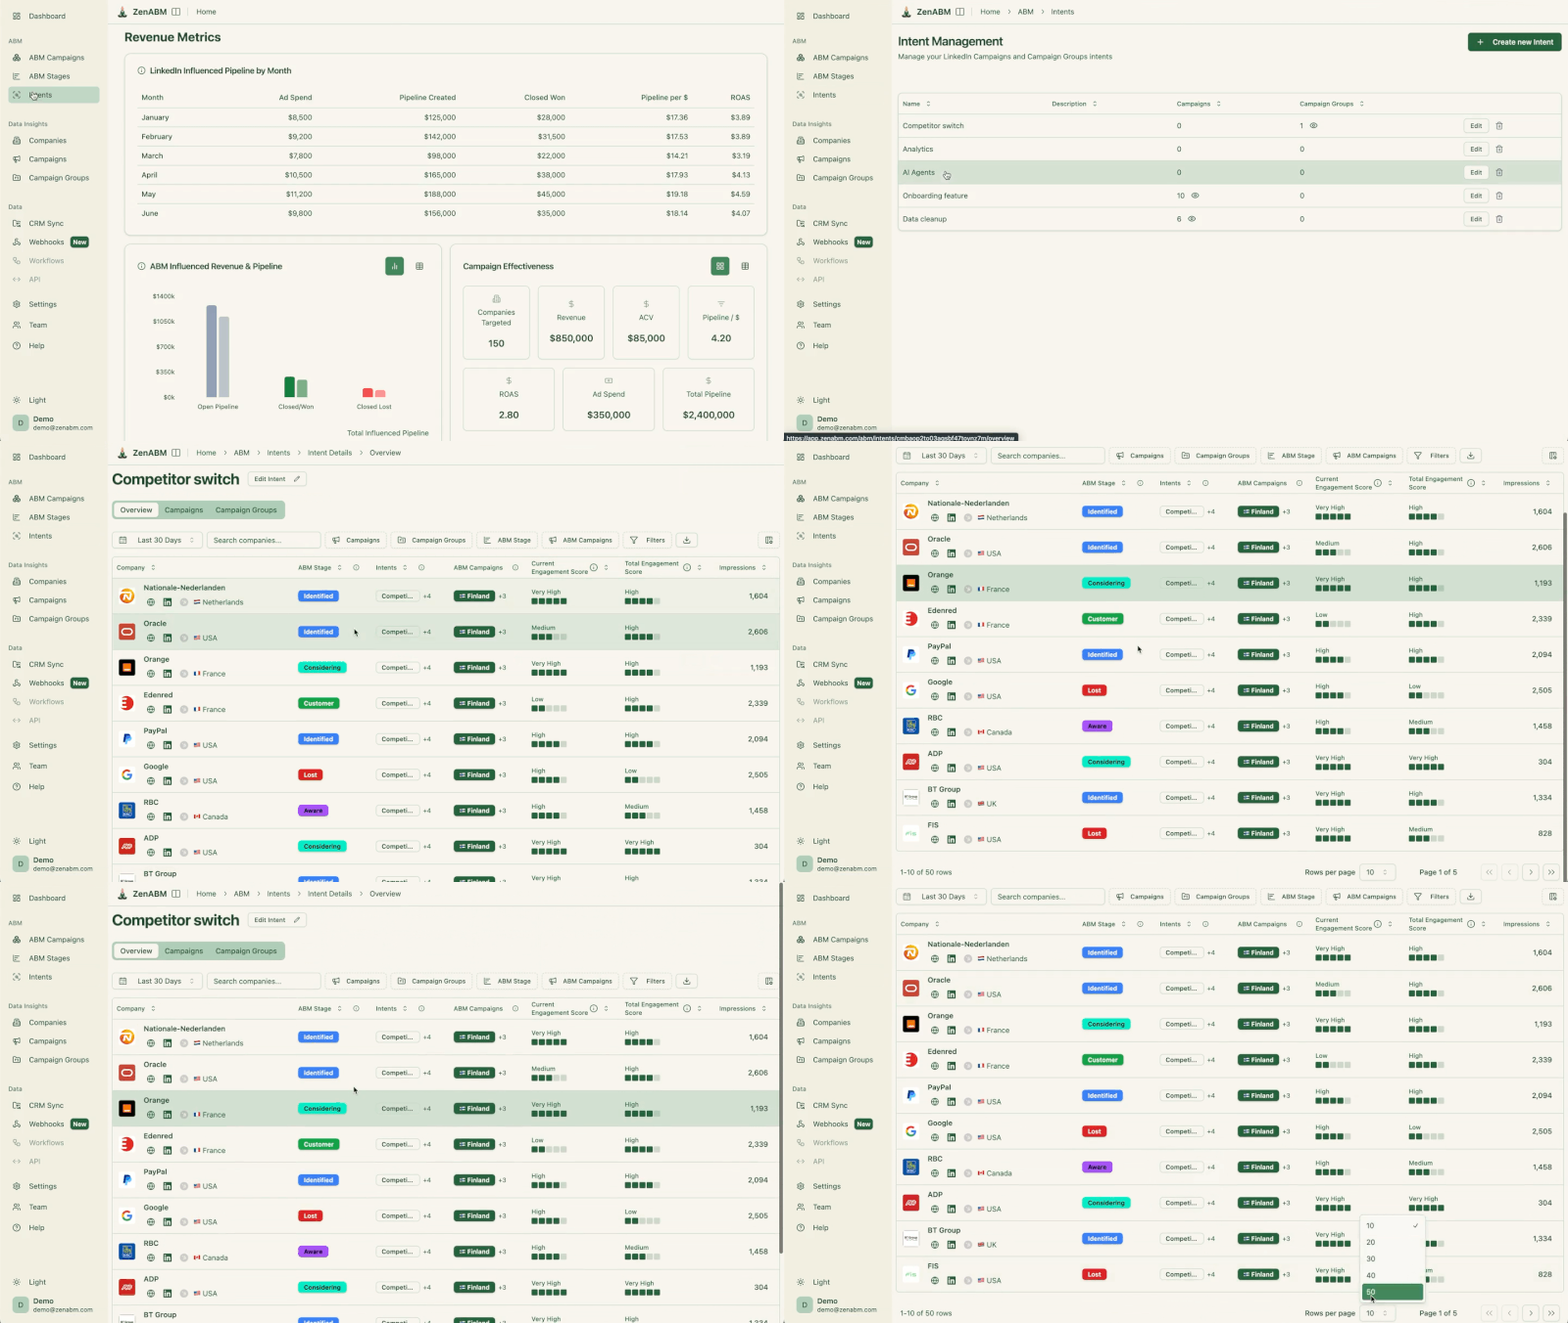

The following prompt looks backwards from deals to find which intent signals fired first, then forward from intent surges to see how often they led anywhere.
Audit the relationship between account intent and pipeline over the last 180 days. First, for accounts that opened a deal, show which intent signals fired in the 30-60 days before the deal was created and how often. Second, for all accounts that showed a strong intent surge, calculate what share went on to open a deal within 90 days. Tell me which specific intent signals have the highest correlation with downstream pipeline and which surges mostly went nowhere. Rank intent signals by their deal-conversion rate, not by raw volume.
How to read it: rank by conversion, never by volume. A loud intent signal that fires on hundreds of accounts and converts almost none is a distraction that wastes the sales team’s time. A quieter signal that fires rarely but converts often is the one worth wiring into alerting and account prioritization. The 30-to-60-day window matters because it separates intent that genuinely precedes a buying motion from intent that is just ambient browsing. Using the winners to decide which accounts get human follow-up and which campaigns get retargeted turns intent from a vanity chart into a routing rule.
Maximilian Herczeg (ex-LinkedIn) captures, in his LinkedIn post, why intent and stage data matter more now than they used to, given how buyers behave before they ever talk to a salesperson.
“Before engaging with a salesperson, buyers self-educate extensively. Cold outreach is losing effectiveness. Trust is hard to build, and people buy from people they trust.”
Because so much of the buying journey now happens before a sales conversation, intent and stage signals are often the only visibility available into accounts that are warming up.
The audit’s job is to identify which of those signals are trustworthy enough to act on.
Not all pipeline is equal, and an ABM performance audit that treats a $5,000 deal the same as a $500,000 deal will lead the program astray.
In most B2B revenue, the top 20% of deals by value account for the majority of the number, so the sharpest version of “what drives pipeline” is narrower: what touched the deals that actually pay for the program.
This prompt isolates the high-value deals and asks what the program did for them specifically.
Identify my top 20% of deals by value over the last 12 months (open and closed-won). For that enterprise segment only, show: which ABM campaigns and ad sets touched those accounts before the deal opened, how many ABM stages each account moved before the deal was created, the median number of pre-deal touchpoints, and total influenced pipeline value. Compare the campaign mix that influenced the top 20% of deals against the campaign mix that influenced the bottom 80%. Tell me which campaigns are disproportionately associated with high-value deals.
How to read it: the comparison is the payoff. If one or two campaigns appear far more often before enterprise deals than before small ones, that is the enterprise-influence signal, and it should reshape how budget is allocated and which accounts get prioritized. The median-touchpoints number is the other gem: enterprise deals almost always need more touches before they open, which reveals whether the program is patient enough to nurture large accounts or whether it gives up too early. Many teams discover their cheapest, highest-volume campaign influences only small deals while a quieter, more expensive campaign quietly touches every whale.
This is account-based marketing doing the one thing it promised: concentrating effort on the accounts that matter most.
The audit proves whether spend is actually concentrated there or whether it has drifted toward whoever clicks the most.
Every section above answers a piece of “what drives pipeline.”
The last step of the ABM performance audit pulls them into one answer that can be handed to a leadership team without translation.
This is the period-over-period executive summary: this quarter versus last, in the language of pipeline and stage movement rather than clicks and CPC.
The following prompt assembles the summary:
Write me a period-over-period ABM executive summary comparing this quarter to last quarter. Include: total influenced pipeline and percent change, number of deals opened and closed-won with ABM influence and percent change, accounts that progressed at least one ABM stage and percent change, the top 3 campaigns by pipeline-per-dollar, the top 3 campaigns appearing before closed-won deals, the intent signals with the highest deal- conversion rate, and the single biggest change from last quarter. Keep it to one screen, written for a marketing leadership audience, no ad-level metrics.
It deliberately leads with pipeline, then stage movement, then the campaigns and intent signals that drove both.

How to read it: this is the artifact, not just an answer. The “single biggest change” line is what a VP or board member reads first, so the prompt forces it. The percent-change framing turns a static snapshot into a trend, which is the difference between “here is what happened” and “here is whether the program is improving.” If influenced-pipeline is trending up while spend is flat, the program is compounding. If the pipeline is flat while spend climbs, there is an efficiency problem to chase in the next monthly audit.
For teams that prefer not to assemble this by hand each quarter, this is exactly the kind of report that belongs in a recurring schedule.
The structured output also slots neatly into a proper ABM analytics dashboard for ROI reporting when a standing view is needed between audits.
Put together, the ABM performance audit with Claude Code is a fixed sequence to run once a month or once a quarter.
Here is the order, start to finish, and why it goes in this order:
The reason this fits in 40 minutes is that nothing is being built from scratch.
The MCP server handles the data work across LinkedIn Ads, ABM stages, intent, and CRM deals through ZenABM’s 60+ tools, while the practitioner handles the judgment work.
Because every step is a read question, nothing in the account changes, so the audit can run as often as needed without risk.
Scope note one more time: this is the program-and-pipeline audit. It is not the ad performance audit, which hunts wasted spend and weak creatives at the creative level, and it is not the campaign-building work of setting up and optimizing campaigns.
Those are separate jobs.
This audit answers a single executive question: what is driving the pipeline, and staying at that altitude is exactly what makes the answer worth taking into a budget meeting.
For teams that want to watch the same engagement signals between audits, ZenABM also makes it possible to see which companies are engaging with LinkedIn ads account by account.
An ABM performance audit is not a reporting exercise. It is a budget decision disguised as a question: which campaigns, which accounts, and which intent signals are actually moving deals forward, and which are consuming spend while producing nothing measurable at the pipeline level.
The prompts in this guide run that investigation end to end, from pipeline per dollar through stage movement, touchpoint frequency, enterprise-deal influence, and intent correlation, and they do it in about 40 minutes because the ZenABM MCP server handles the data joins that would otherwise take days in spreadsheets.
The output is not a dashboard to monitor. It is a set of decisions to make: where to reallocate budget next quarter, which stalled accounts to hand to sales this week, which intent signals to wire into account prioritization, and whether the program is compounding or drifting.
Run it once, and those decisions become defensible.
Run it every quarter, and the trend line becomes the most useful artifact in any budget conversation.
ZenABM connects LinkedIn Ads, ABM stage tracking, intent signals, and CRM deal data in one place, which is what makes the audit possible without stitching together three separate tools by hand.
The MCP server is live on the $59/month plan, with a 37-day free trial to run the full audit before committing.
You can start your free trial now or book a demo to know more!
It is a program-level review run by asking Claude Code questions in plain English while the ZenABM MCP server pulls live LinkedIn Ads, ABM stage, and CRM deal data.
It answers what is driving the pipeline by examining pipeline per dollar by campaign, stage movement, pre-deal touchpoints, enterprise-deal influence, and intent correlation.
It is not an ad-level audit of creatives or wasted spend, which is a separate pass.
An ad performance audit works at the creative and spend level, finding wasted budget and weak creatives across ad sets and formats.
This ABM performance audit works one level up, at the account, pipeline, and revenue level, asking which campaigns and intent signals influence real deals.
Run the ad audit weekly to keep spend clean, and run this program audit monthly or quarterly to decide where the budget should be allocated.
Influenced pipeline is the dollar value of opportunities where an account had measurable ABM exposure, meaning impressions, clicks, or engagement, before the deal was created.
It is not a last-click claim that the ad closed the deal, and it is not a guarantee of causation.
It is the honest pattern that these accounts saw the program and then entered the pipeline, which is the strongest signal LinkedIn ABM measurement can give.
No.
Every prompt in this ABM performance audit is a read question, so the MCP server pulls and joins data without touching anything.
Write actions like pausing a campaign or changing a budget are flagged as destructive and require explicit confirmation, so this audit is read-only from start to finish.
About 40 minutes once the MCP server is connected, because the work is asking questions and reading joined answers rather than building reports by hand.
The six steps run in sequence: pipeline per dollar, stage movement, pre-deal touchpoints, enterprise influence, intent correlation, and the executive summary.
ZenABM starts at $59 per month with a 37-day free trial, and because the audit is read-only, it can run as often as needed.
