
Most ABM dashboards track the wrong ABM metrics.
They report on impressions, clicks, and CTR, which are metrics that tell you whether your ads are running, not whether your program is working.
In this post, I will break down ABM metrics into three tiers: ad delivery metrics (useful for diagnostics), account-level metrics (useful for strategy), and business outcome metrics (useful for proving ROI), and also share actual benchmarks from 211 companies running ABM in 2025, based on the ZenABM ABM Benchmarks Report.
What you will learn:
Short on time?
Here’s a quick rundown:
Not all ABM metrics are equal.
They fall into three tiers, each serving a different purpose and a different audience.
Understanding which tier a metric belongs to is what determines whether it belongs in your weekly dashboard, your executive report, or your ads team’s optimization sheet.
| Tier | What It Measures | Who Cares | Examples |
|---|---|---|---|
| Tier 1: Ad Delivery | Are ads running efficiently? | Campaign manager / ads specialist | CTR, CPC, CPM, impressions, video views |
| Tier 2: Account-Level | Are target accounts progressing? | Demand gen / ABM lead | Accounts per stage, stage velocity, audience penetration, engagement score |
| Tier 3: Business Outcomes | Is ABM generating revenue? | VP Marketing / CEO / CFO | Pipeline influenced, pipeline per $ spent, ROAS, deal open rate, cost per opportunity |
The mistake most teams make is reporting Tier 1 metrics to executives and wondering why nobody is excited about a 2.68% CTR.
Executives care about Tier 3.
Your ads team cares about Tier 1.
You, as the ABM lead, should obsess over Tier 2, because Tier 2 metrics are the leading indicators that predict Tier 3 results before Tier 3 results appear.
These metrics tell you whether your ads are working mechanically.
They are important for optimization but should never appear in your executive ABM report.
| Format | Median CTR | Median CPC | Efficiency Score |
|---|---|---|---|
| Thought Leader Ads | 2.68% | $2.29 | 9.5/10 |
| Single Image | 0.42% | $13.23 | 5.5/10 |
| Video | 0.24% | $15.61 | 4.0/10 |
| Carousel | 0.32% | $13.30 | 4.5/10 |
These benchmarks are useful for one thing: diagnosing whether a specific ad or format is underperforming relative to its peers.
If your image ads are at 0.20% CTR when the median is 0.42%, something is wrong with the creative or targeting. But a 0.42% CTR by itself does not tell you whether ABM is working.
Do not let easily trackable Tier 1 metrics crowd out the harder-to-measure but more meaningful Tier 2 and Tier 3 metrics.

These are the metrics to check weekly.
They tell you whether the ABM program is creating the conditions for the pipeline, even before the pipeline materializes.
If Tier 3 metrics are the scoreboard, Tier 2 metrics are the game film: they show you what is actually happening underneath the final numbers.
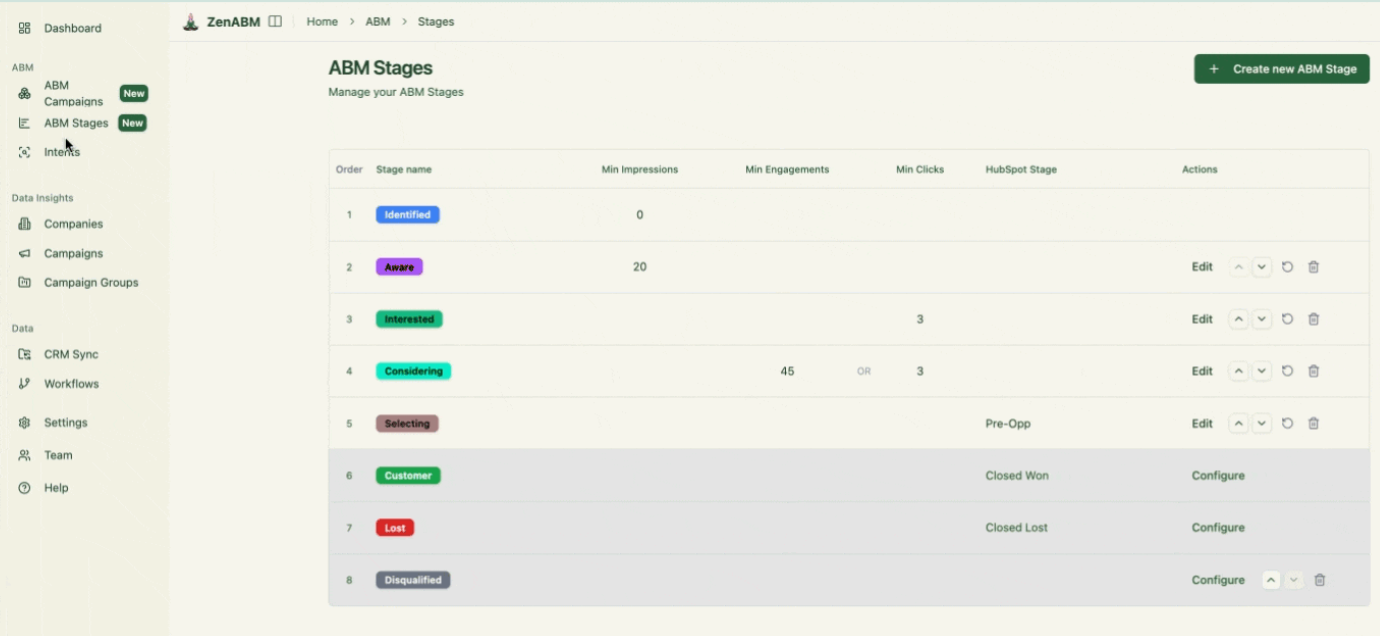
How many accounts are in each ABM stage (Identified, Aware, Interested, Considering, Selecting)?
This is the most important single metric because it shows you the health of your funnel at the account level.
The expected flow, based on Kyle Poyar’s ABX benchmarks adapted for our program and visible in ZenABM’s analytics dashboards:
If your Aware-to-Interested conversion is below 20%, your ads are reaching accounts but not engaging them: the creative is not resonating or the message is wrong for the audience.
If Interested-to-Considering is below 10%, your warm campaign creative or outbound follow-up is not converting engaged accounts into pipeline, and you need to look at both the ad content and the BDR outreach sequence.
How fast are accounts moving between stages?
If it takes 90 days for an account to go from Identified to Interested, that is a fundamentally different program from one that achieves the same progression in 30 days.
Stage velocity directly impacts pipeline forecasting because it lets you estimate when current campaigns will produce results.
An account entering “Aware” today, in a program with a 60-day average stage velocity, will likely enter “Interested” in two months.
Without tracking velocity, you are running a program with no forecast.
What percentage of your target audience has received meaningful exposure?
LinkedIn shows this metric natively in Campaign Manager. For ABM, the target is 40%+ penetration on your target account list.
Below that, many accounts have not been reached enough times for your program to be effective.
As Maximilian Herczeg (ex-LinkedIn) emphasized in his post:
“Your ads need 8-10 touchpoints per month to show effectiveness. Many ad accounts I check don’t even achieve half of that.”

Audience penetration at scale is one of the most commonly underestimated ABM metrics.
A program with 20% penetration has not actually reached most of its target list, regardless of what the impressions counter says.
How are your account scores distributed across your target list?
If most accounts cluster at low scores with very few reaching “Interested,” your content may not be resonating with the audience, or your target list contains accounts that are too early in the awareness cycle.
ZenABM shows this distribution across your entire target list, making it easy to spot the pattern and adjust either the creative or the list composition.

![]()

These are the metrics that justify your ABM budget and prove ROI.
They require connecting ad engagement data with CRM deal data, which is exactly what ZenABM was built to do.
Without this connection, Tier 3 reporting either becomes a manual spreadsheet exercise or does not happen at all.
Total deal value from companies that engaged with your ABM campaigns before the deal was created.
This is the headline number: in our program, it was $5.29M over 16 months.
One important clarification on terminology: this is “influenced,” not “attributed.”
A deal can be influenced by multiple channels simultaneously.
The same $100K deal might be influenced by LinkedIn ads, organic content, and outbound.
That overlap is correct and expected; the point is to understand LinkedIn’s contribution to the deal journey, not to claim sole credit.
Pipeline influenced divided by total ad spend.
This is the efficiency metric that tells you how hard your ABM dollars are working.
Userpilot’s program (where ZenABM was a part of their tool stack), for instance, achieved $10.79 in pipeline per $ spent.

From the ZenABM 2026 Benchmarks Report (211 companies, $5.5M aggregate spend), top performers achieved significantly higher ratios through better targeting, creative optimization, and faster stage velocity.
The full report breaks this down by company size, country, and industry.

Number of deals opened divided by the number of companies targeted.
This tells you what percentage of your target account list actually converted into opportunities.
A low deal open rate (under 2%) typically means list quality is poor or targeting is too broad.
A high rate (5%+) suggests strong ICP alignment.
This metric is one of the clearest signals of whether you are targeting the right accounts, independent of how much you spend or how well the creative performs.
Closed-won revenue from ABM-influenced deals divided by total ad spend.
This is the ultimate metric.
The ZenABM benchmarks report breaks ROAS down by company size, country, and industry to give you specific targets relevant to your segment – access it here.
Total ABM spend divided by the number of opportunities created.
This is the ABM equivalent of “cost per SQL” in demand gen, and it makes your program directly comparable to other pipeline generation channels.
When you can show that your ABM program generates opportunities at $X each, you can defend the budget with the same language finance uses to evaluate every other go-to-market investment.
Different stakeholders need different ABM metrics at different frequencies.
Mixing tiers in the wrong audience context either bores executives with tactical noise or overwhelms practitioners with strategic summaries that do not help them optimize.
| Audience | Frequency | Metrics |
|---|---|---|
| CEO / Board | Monthly / Quarterly | Pipeline influenced, ROAS, pipeline per $ spent, cost per opportunity |
| VP Marketing | Weekly | Accounts per stage, stage velocity, pipeline influenced (running total), and budget pacing |
| Demand Gen / ABM Lead | Weekly | Stage conversion rates, audience penetration, engagement score distribution, campaign velocity |
| Ads Specialist | Daily / Weekly | CTR, CPC, CPM by format, ad-level performance, and creative fatigue signals |
| BDR Manager | Daily | New “Interested” accounts, intent data per account, and outreach response rates |
ZenABM provides all of the ABM metrics natively: account stages, deal attribution, pipeline per $ spent, and company-level engagement analytics, etc.


Some mistakes related to tracking ABM metrics you should avoid:
From the ZenABM 2026 ABM Benchmarks Report (211 companies, $5.5M aggregate spend, 161,256 ads):
| Metric | Benchmark | What It Means |
|---|---|---|
| TLA CTR | 2.68% median | Top-performing format. Below 1.5% is a creative issue. |
| Single Image CTR | 0.42% median | Core format. Below 0.30% is a creative or targeting issue. |
| TLA CPC | $2.29 median | 77% cheaper than image ads. Best format efficiency. |
| Single Image CPC | $13.23 median | Standard for B2B LinkedIn. Above $18 signals a problem. |
| Aware rate | ~55% of targeted | Percentage of target accounts reaching 50+ impressions. |
| Interested rate | ~32% of Aware | Percentage of Aware accounts reaching engagement threshold. |
| Considering rate | ~18% of Interested | Percentage of Interested accounts booking demo or trial. |
| Pipeline per $ spent | $10.79 (our program) | Higher means a more efficient program. Full report compares by segment. |
| ROAS | 2x+ (our program) | Closed revenue divided by ad spend. Above 1x is profitable. |
For the full benchmarks broken down by company size, country, and industry, download the complete ZenABM ABM Benchmarks Report.
![]()
The gap between ABM programs that get their budgets renewed and those that get cut almost always comes down to one thing: whether the team can answer the question “how much pipeline did this generate?” with a number, not a story about CTR. Tier 1 metrics (CTR, CPC, CPM) will never answer that question.
They are diagnostic tools for your ads team, not evidence for your CEO.
The teams that conflate these two audiences end up with executives who think ABM is “the thing that generates impressions” rather than “the thing that generated $5.29M in pipeline.
The fix is mechanical, not philosophical. Track Tier 2 weekly (accounts per stage, stage velocity, audience penetration) so you always know whether the program is building toward the pipeline before the pipeline shows up.
Track Tier 3 monthly (pipeline influenced, ROAS, pipeline per $ spent, deal open rate) so you always have the number when someone asks.
Use format-specific benchmarks to diagnose Tier 1 problems, not to report to leadership. ZenABM was built precisely to close the gap between Tier 1 and Tier 3, connecting LinkedIn ad engagement data to CRM deals so that pipeline per $ spent and deal open rate are live numbers in your dashboard rather than manual calculations that happen once per quarter when someone asks.
Starting at $59 per month, with 90 days of historical data backfilled on signup, it is the fastest way to move from reporting clicks to reporting pipeline.
Start your free 37-day trial and see your Tier 3 ABM metrics in minutes, or book a demo to know more.
Some common questions about ABM metrics:
At the strategic level: accounts per stage, stage velocity, and audience penetration (weekly). At the business outcome level: pipeline influenced, pipeline per $ spent, ROAS, deal open rate, and cost per opportunity (monthly and quarterly). Ad-level metrics like CTR and CPC are important for campaign optimization but should not be your primary success measures. See the complete ABM KPIs guide for the full framework.
Our program achieved $10.79 in pipeline per $ spent over 16 months ($5.29M pipeline from $490K spend). The ZenABM benchmarks report provides detailed breakdowns by company size, country, and industry. As a general guide: $5+ is solid, $10+ is strong, and top performers achieve $15+. The metric varies significantly by ACV and sales cycle length, so compare against your own segment rather than an industry average.
No. ABM replaces individual lead metrics with account-level metrics. Instead of MQLs, track MQAs (marketing-qualified accounts): accounts that have reached the “Interested” stage based on engagement scoring. Instead of cost per lead, track cost per opportunity at the account level. The shift from lead-level to account-level measurement is fundamental to ABM. If you are still counting leads, you are doing demand gen, not ABM.
ZenABM pulls company-level engagement data from the LinkedIn Ads API and maps it to CRM deals in HubSpot or Salesforce. This gives you pipeline influenced per campaign, deal open rate by account segment, and ROAS: the Tier 3 metrics that prove ROI. Without this connection, you are stuck reporting Tier 1 metrics (CTR, CPC) that executives do not care about and cannot act on.
Use format-specific benchmarks from the ZenABM 2026 Benchmarks Report: TLAs at 2.68% CTR and $2.29 CPC, single image at 0.42% CTR and $13.23 CPC, video at 0.24% CTR and $15.61 CPC, carousel at 0.32% CTR and $13.30 CPC. Always compare within the same format. A single image ad at 0.42% CTR is performing at median and is not underperforming just because TLAs achieve 2.68%.