
Here is the problem: Most LinkedIn ads reporting gives you only top-line ad and campaign performance metrics (aggregate, anonymized – via LinkedIn Campaign Manager or e.g. Hubspot Marketing) – impressions, clicks, CTR, CPCs – and then – lagging lead-level metrics. Those numbers are fine if you are running lead gen, if you’re running account-based marketing on LinkedIn, campaign-level reporting misses the entire point. You need to know which companies are engaging with your ads, which accounts are moving through your funnel (whether a particular lead filled in the form or not), and whether your ad spend is actually creating pipeline. After running LinkedIn ABM campaigns that generated $5.29M in pipeline from $490k in ad spend, I have built a LinkedIn ads reporting framework that actually makes sense for Account Based Marketing. In this post, I will share the exact metrics, dashboards, and attribution models I use – and why most LinkedIn ads reports fail to answer the questions that matter. 
LinkedIn Campaign Manager was built for advertisers who care about lead volume and cost per lead. It shows you the basics: impressions, clicks, CTR, CPC, conversions, and cost per conversion. For a B2C advertisers (who don’t care about following up on engagements on Company level) or someone running gated content campaigns, that is enough.  For B2B marketers – especially those running ABM – it falls short in three critical ways.
Campaign Manager shows you aggregate numbers. It does tell you which specific companies saw your ads in the “companies” tab – but you don’t see how that translates into revenue over time (in your CRM) or the engagements over time on a specific company level (like you do in the companies view in ZenABM): 

Campaign Manager’s conversion tracking uses click-based last-touch attribution by default. That means it gives 100% of the credit to the last ad someone clicked before converting. This sounds reasonable until you think about how B2B buying actually works. A VP of Engineering at your target account sees your Thought Leader Ad on Monday. She reads the post but does not click. On Wednesday, she sees your single image ad and clicks through to your blog. On Friday, she visits your website directly and books a demo. Under click-based last-touch, the single image ad gets all the credit. The TLA that started the whole journey? Zero credit. This is why teams that rely on last-touch attribution consistently undervalue top-of-funnel formats like Thought Leader Ads (which have a 2.68% median CTR and $2.29 CPC) and overvalue bottom-funnel direct response ads. Alternative? Impression-based “influence” model: 
Campaign Manager has no idea what happens after someone clicks. It does not know if that company became an opportunity, how much the deal is worth, or whether it closed. So your LinkedIn ads report shows clicks and conversions, but your CFO wants to know: how much pipeline did this create? What is our ROAS? 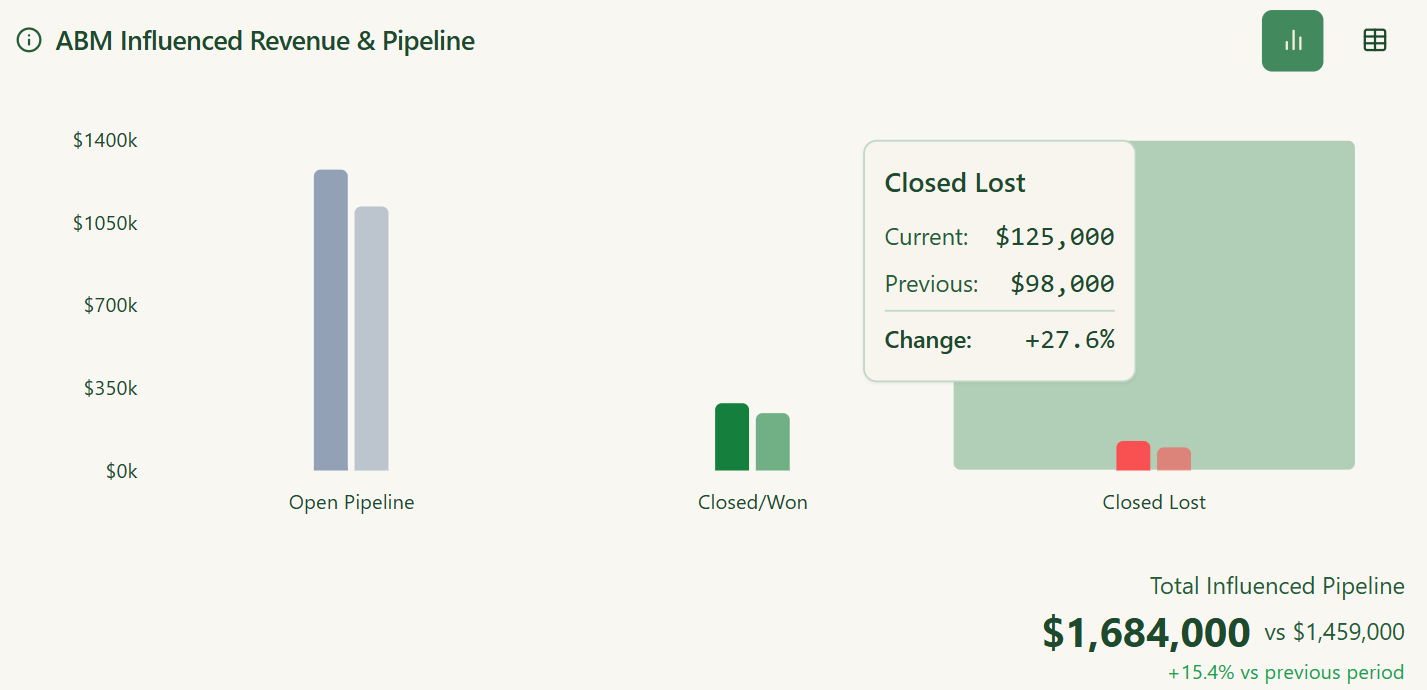
After running campaigns across 26,315 accounts over 16 months, I have narrowed down LinkedIn ads reporting to two categories: campaign health metrics and business impact metrics.
These tell you if your campaigns are running correctly. Track them weekly.
| Metric | What It Tells You | Benchmark (from ZenABM data) |
|---|---|---|
| CTR by ad format | Are people engaging with your creative? | TLA: 2.68%, Single Image: 0.42%, Video: 0.24%, Carousel: 0.32% |
| CPC by ad format | How much are you paying per click? | TLA: $2.29, Single Image: $13.23, Video: $15.61, Carousel: $13.30 |
| Audience penetration | What % of your target list are you reaching? | 30-50% monthly for cold, 70-90% for warm |
| Frequency | How many times is each person seeing your ads? | Max 4 per campaign/month, 6-10 total for cold |
| Budget utilization | Are you spending your daily budget? | 95%+ daily budget consumption target |
These benchmarks come from the ZenABM 2026 LinkedIn ABM Performance Benchmarks Report, which analyzed 160,000+ ads across 211 companies. 
These are the metrics that connect your LinkedIn ads to revenue. Report on them monthly.
| Metric | What It Tells You | How to Calculate |
|---|---|---|
| Target accounts reached | How many accounts from your TAL saw your ads? (= Account penetration – not audience penetration!) | Accounts with 1+ impression / total TAL |
| Accounts engaged | How many target accounts clicked or interacted? | Accounts with clicks or engagement / total TAL |
| Pipeline influenced | How much pipeline came from engaged accounts? | Deal value from accounts with ad engagement |
| Pipeline per dollar spent | Efficiency of ad spend | Total influenced pipeline / total ad spend |
| ROAS (closed-won) | Actual revenue return | Closed-won revenue from engaged accounts / ad spend |
| Account stage movement | Are accounts progressing through your funnel? | Count of accounts moving from Aware to Engaged to Interested |
 Our results after 16 months: $10.79 pipeline per dollar spent and over 2x ROAS in closed-won revenue. Those are the numbers that justify budget increases.
This is the most important decision in your LinkedIn ads reporting setup: which attribution model to use.
This model gives credit to the last ad a person clicked before converting. It is the default in LinkedIn Campaign Manager and most analytics tools. When it works: Lead gen campaigns where the click-to-conversion path is short and linear. When it fails: ABM campaigns. B2B buying committees have 6-10 people. The average B2B deal takes 3-6 months. Dozens of touchpoints happen before someone books a demo. Last-touch attribution ignores all of that context. Here is what happens when you rely on click-based last-touch reporting for ABM:
Influence-based attribution credits every ad touchpoint that an account experienced before a deal was created. If a company saw your TLA, clicked your single image ad, and then booked a demo after seeing a retargeting ad – all three touchpoints get credit for influencing that deal. This model works at the account level, not the individual level. That is critical because B2B purchases are made by buying committees, not single people. If three different people from the same company engaged with three different ads, all of those touchpoints influenced the buying decision. The difference in reporting is dramatic. When I switched from click-based to influence-based attribution, our reported pipeline influence jumped by over 3x. The ads were always working – we just were not measuring them correctly.
Here is the reporting framework I use. It is the same structure I built into ZenABM because no existing tool provided it out of the box.
This layer answers: are my campaigns healthy?

This layer answers: are the right companies engaging?
This is where company-level engagement tracking becomes essential. You cannot build this layer with Campaign Manager alone because it does not show you which companies are engaging with which campaigns. 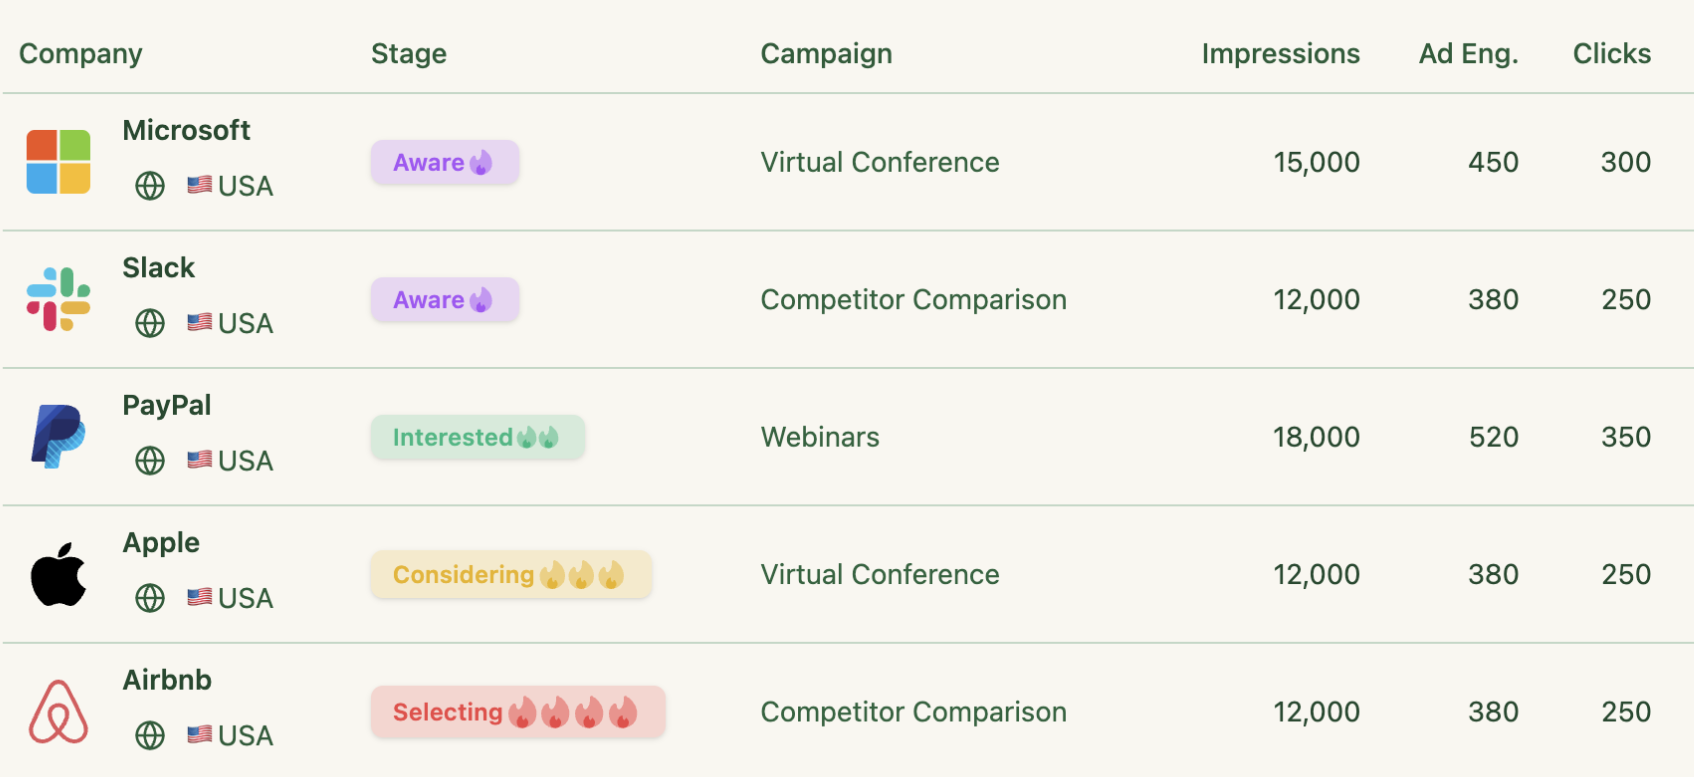
This layer answers: is this generating pipeline and revenue?
This layer requires influence-based revenue attribution that connects your LinkedIn ad data to your CRM. Campaign Manager cannot do this natively. 
I built ZenABM specifically because I could not find a tool that provided all three reporting layers in one place. Here is what ZenABM’s reporting dashboard gives you that Campaign Manager does not. Company-level engagement data. See exactly which companies saw your ads, which campaigns they engaged with, how many impressions and clicks each company received, and their engagement score over time. ABM stage tracking. Define your own funnel stages – Identified, Aware, Engaged, Interested, Opportunity – and watch accounts move through them based on engagement thresholds you set. Influence-based pipeline attribution. Connect your LinkedIn ad data to your CRM deals. See which campaigns influenced which deals, how much pipeline each campaign touched, and your true ROAS – not the artificially low number from last-touch attribution. CRM integration. All of this data flows bi-directionally into your CRM (HubSpot, with Salesforce on higher tiers). Sales can see LinkedIn engagement data on every company record without logging into another tool. FlowFuse used this reporting framework to scale LinkedIn ABM from 20% to 80% of their marketing budget – after seeing clear pipeline attribution data that proved the channel was working. You can read another case study here. 
After reviewing reporting setups from dozens of B2B teams, here are the most common mistakes I see.
If your LinkedIn ads report only shows impressions, clicks, and CTR, you are reporting on activity – not results. Leadership does not care how many people clicked your ad. They care how much pipeline it created. Add pipeline influence and ROAS to every report, even if the numbers are small in early months.
TLAs have a $2.29 median CPC. Single image ads have a $13.23 median CPC. Does that mean TLAs are 6x better? Not necessarily. The right comparison is cost per influenced pipeline dollar, not cost per click. A $13 click that leads to a $50k deal is better than a $2 click that leads nowhere.
Your aggregate CTR might look fine at 0.5%. But if you split it by account tier, you might find that Tier 1 accounts have 0.2% CTR while Tier 3 accounts have 0.8%. That tells you your messaging is not resonating with your most important accounts – a problem that aggregate reporting completely hides. ZenABM allows you to see the differences between different target audience performance by allowing you to split your campaigns into separate “ABM Campaigns” – and track all the metrics separately for each: 
Monthly reporting is fine for leadership. But if you only look at your campaigns once a month, you will miss budget pacing issues, ad fatigue, and impression concentration problems. Check campaign health metrics weekly. Report business impact monthly.
Campaign Manager is great for managing campaigns. It is not great for reporting on business impact. You need to connect your LinkedIn ad data to your CRM to report on what actually matters: pipeline and revenue.
Include two categories: campaign health (CTR, CPC, frequency, audience penetration, budget utilization) and business impact (target accounts reached, accounts engaged, pipeline influenced, pipeline per dollar, ROAS). Campaign health metrics are for your marketing team. Business impact metrics are for leadership.
Check campaign health metrics weekly to catch issues like ad fatigue and budget pacing. Report business impact metrics monthly. Account stage movement and pipeline attribution need time to accumulate meaningful data – reviewing them too frequently leads to premature decisions.
Because B2B buying involves multiple touchpoints over months. Click-based last-touch attribution only credits the last ad clicked before conversion. This systematically undervalues awareness-stage formats like Thought Leader Ads and overvalues bottom-funnel retargeting. Influence-based attribution, which credits all touchpoints an account experienced, gives a much more accurate picture.
You need a tool that pulls company-level engagement data from LinkedIn’s API and matches it against your CRM deals. ZenABM does this automatically – it shows which campaigns influenced which deals and calculates pipeline per dollar and ROAS. Campaign Manager alone cannot make this connection.
Based on our data across 211 companies, aim for 3-5x ROAS. 5x is strong. 10x is exceptional. Our own campaigns achieved over 2x ROAS in closed-won revenue and $10.79 in pipeline per dollar spent after 16 months. Top performers spend $6,576/month – 144% more than the median of $2,693 – because they can prove the return.