
LinkedIn Campaign Manager shows you 40+ metrics. Impressions, clicks, CTR, CPC, CPM, engagement rate, conversions, lead gen form opens, video views, social actions, viral impressions – the list goes on. Most of them do not matter for B2B. I know this because I have spent over $490k on LinkedIn ads through ZenABM, analyzed data from hundreds of ABM campaigns, and published the 2026 LinkedIn ABM Performance Benchmarks Report. The biggest finding? The metric most teams obsess over – CTR – actually has a negative correlation with pipeline generation. In this guide, I will break down every LinkedIn Ads metric that matters, share real benchmarks for each, and introduce you to the “hidden” company-level metrics that Campaign Manager does not show – but that separate average B2B marketers from the ones actually driving revenue. 

Before diving into individual metrics, I want to reframe how you think about LinkedIn Ads measurement. There are three distinct levels, and most teams only operate at the first one:
| Level | What It Measures | Where You Find It | Who Cares About It |
|---|---|---|---|
| Campaign-Level Metrics | How your ads are performing (CTR, CPC, CPM, engagement rate) | LinkedIn Campaign Manager | Media buyers, ad managers |
| Company-Level Metrics | How target accounts are engaging (impressions per account, engagement per account, stage progression) | ABM platforms like ZenABM | ABM managers, demand gen leads |
| Revenue-Level Metrics | How ads connect to pipeline and deals (pipeline influenced, ROAS, pipeline per dollar) | CRM + attribution tools | CMOs, VPs, leadership |
The problem is that most LinkedIn advertisers live exclusively at Level 1. They optimize CTR and CPC, report those numbers to leadership, and wonder why nobody is impressed. Leadership does not care about your click-through rate. They care about pipeline and revenue. This guide covers all three levels – starting with the basics so you have a solid foundation, then moving into the metrics that actually influence business outcomes.

These are the metrics LinkedIn Campaign Manager gives you out of the box. They are useful for managing campaign health and optimizing ad delivery – but they are not the end goal. Think of them as operational metrics, not success metrics.
CTR measures the percentage of people who clicked your ad after seeing it. LinkedIn calculates it as clicks divided by impressions. 2026 benchmarks by ad format:
| Ad Format | Average CTR |
|---|---|
| Text Ads (TLAs) | 2.68% |
| Single Image Ads | 0.42% |
| Carousel Ads | 0.32% |
| Video Ads | 0.24% |
| Overall Average | 0.44-0.65% |
Text Ads have the highest CTR because they appear in a different placement (sidebar and top bar) and attract more intentional clicks. But a high CTR does not necessarily mean better results – more on this in the next section. 
CPC tells you how much you pay each time someone clicks your ad. It varies dramatically by format. 2026 benchmarks by ad format:
| Ad Format | Average CPC |
|---|---|
| Text Ads (TLAs) | $2.29 |
| Single Image Ads | $13.23 |
| Carousel Ads | $13.30 |
| Video Ads | $15.61 |
The gap between Text Ads ($2.29) and other formats ($13-16) is massive. This is why I always recommend running Text Ads as part of your LinkedIn ABM strategy – they give you cheap clicks and high reach for a fraction of the cost.
CPM measures how much you pay per 1,000 impressions. This metric matters most for brand awareness and top-of-funnel campaigns where your goal is reach rather than clicks. 2026 benchmarks by ad format:
| Ad Format | Average CPM |
|---|---|
| Text Ads (TLAs) | ~$2 |
| Video Ads | $38.94 |
| Carousel Ads | $45.28 |
| Single Image Ads | $59.15 |
Notice how Single Image Ads have the highest CPM ($59.15) despite being the most commonly used format. Video Ads actually deliver cheaper impressions ($38.94) because LinkedIn’s algorithm favors video content. If your goal is getting in front of as many target accounts as possible, Video Ads and Text Ads give you the most efficient reach.
Engagement rate includes all interactions – clicks, likes, comments, shares, and follows – divided by impressions. It tells you how compelling your content is to the audience. 2026 benchmarks:
Video consistently generates 3x the engagement of static formats. This makes sense – video stops the scroll, creates emotional connection, and gives viewers a reason to interact beyond just clicking through.
If you are using LinkedIn’s native Lead Gen Forms, this metric tracks the percentage of people who opened the form and actually submitted it. 2026 benchmarks:
The key to high Lead Gen Form conversion is keeping the form short (3-4 fields max) and using auto-populated fields from LinkedIn profile data. Every manual field you add drops your completion rate.
This deserves its own section because it is the single most important insight from our 2026 benchmarks report, and it challenges what most LinkedIn advertisers believe. CTR has a negative correlation with pipeline generation. Our analysis across hundreds of B2B LinkedIn campaigns found a Spearman correlation of rho = -0.170 between CTR and pipeline value. In plain English: campaigns with higher click-through rates did not generate more pipeline. If anything, the relationship trended slightly negative. Meanwhile, ad spend showed a positive correlation with pipeline (rho = 0.566). The more you invested in getting your message in front of target accounts consistently, the more pipeline you generated – regardless of whether people clicked. Why does this happen?
What should you optimize instead? Account reach (what percentage of your target accounts are seeing your ads), engagement per account (are the right people at target accounts interacting), and ultimately pipeline influenced. These are the metrics that predict revenue.

This is where most LinkedIn advertisers have a blind spot. Campaign Manager shows you aggregate campaign performance – total impressions, total clicks, average CPC. But it does not tell you which specific companies are engaging with your ads, how deeply they are engaging, or whether your target accounts are actually seeing your campaigns. For B2B, this is the gap between running ads and running an ABM program. Company-level metrics bridge that gap. 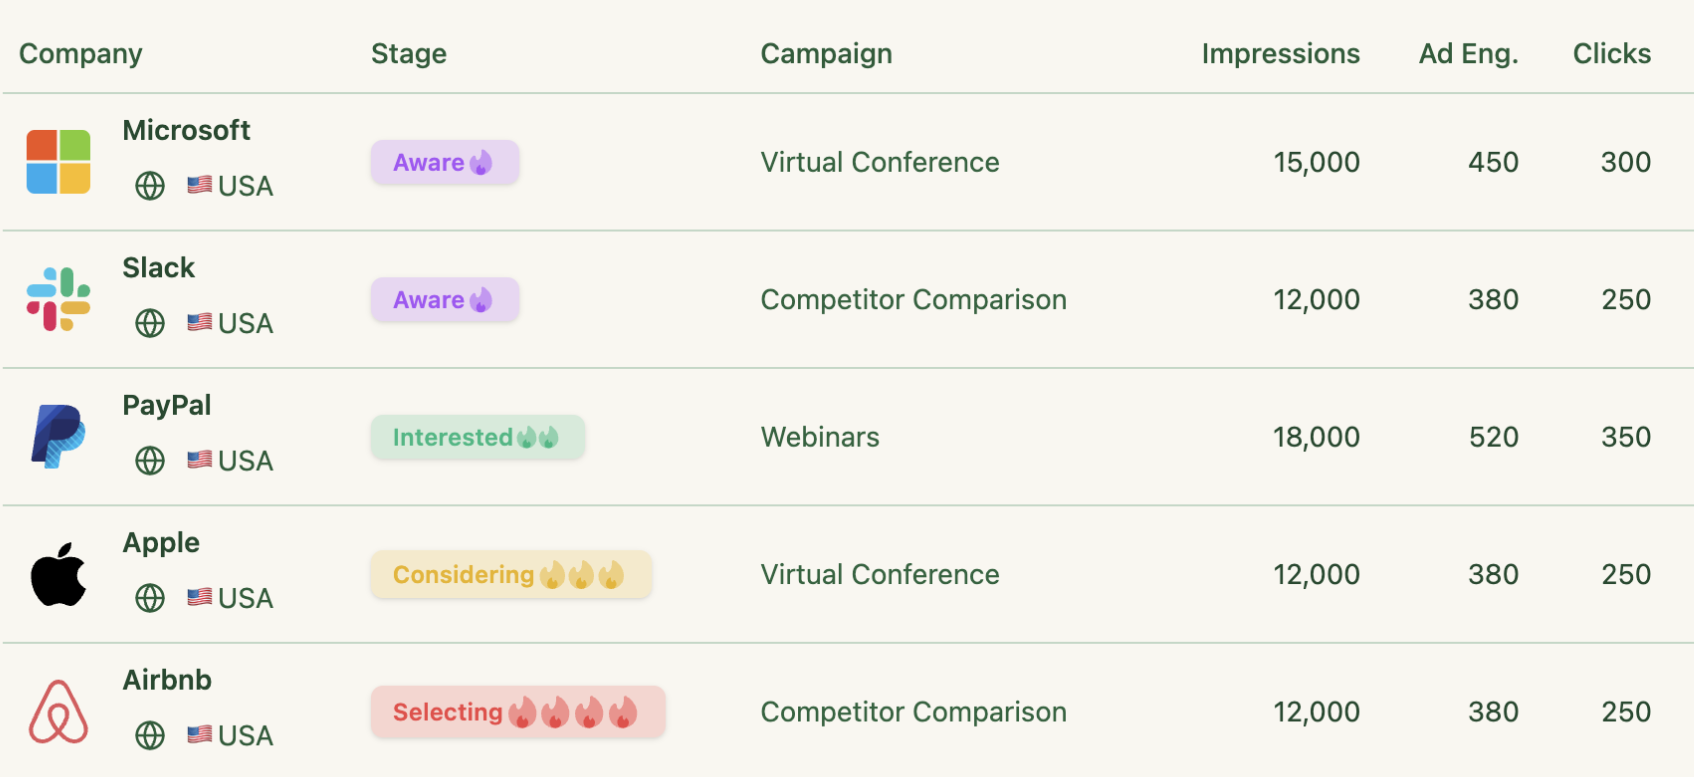
 This measures what percentage of your target account list has received at least one impression from your LinkedIn ads. Benchmark: Aim for 50%+ target account reach within the first 60 days of a campaign. If you are below this after two months, your audience targeting or budget needs adjustment. Why this matters: if only 20% of your target accounts are seeing your ads, you are wasting 80% of your ABM potential. LinkedIn’s algorithm tends to concentrate delivery on accounts that are easier to reach (larger companies, active LinkedIn users), so you need to actively monitor and adjust.
Total impressions divided by the number of target accounts reached. This tells you how frequently each account is exposed to your messaging. Too few impressions per account and you are not building awareness. Too many and you are wasting budget on accounts that have already saturated. This is where impression capping at the company level becomes critical – something Campaign Manager cannot do natively.
Similar to impressions per account, but tracking active engagement. This metric tells you which accounts are actively investigating your offering versus passively seeing your ads. When I see an account with 200+ impressions but zero clicks, that is a signal. Either the messaging is not resonating with that specific account, or the right people at that account are not being reached. When I see an account with 15+ clicks across multiple people, that is a buying signal.
This is a composite metric that weighs different interaction types – impressions, clicks, video views, lead gen form submissions – into a single score per account. It gives you a holistic view of how engaged each account is with your campaigns. In ZenABM, we calculate this automatically and use it to trigger stage progressions. An account might go from “Aware” to “Engaged” once their engagement score crosses a certain threshold.
 This tracks how accounts move through your ABM funnel stages based on their engagement with your LinkedIn ads: Identified (on your target list) – Aware (received impressions) – Engaged (clicked or interacted) – Interested (high engagement, multiple touchpoints) – Opportunity (deal in pipeline) Tracking stage progression over time tells you whether your campaigns are actually warming up accounts or just burning impressions. If accounts are stuck in “Aware” for months without progressing to “Engaged,” your ad creative or offer needs work.
At the campaign level, you might see that “VP of Marketing” is your top-engaging job title. But at the account level, this gets more interesting. Are you reaching the economic buyer, the champion, and the technical evaluator at each target account? Or are you only reaching one persona? Multi-threaded engagement – where multiple decision-makers at the same account are interacting with your ads – is a strong buying signal. It means your campaign is penetrating the buying committee, not just reaching one person.
These are the metrics that connect your LinkedIn ad spend to actual business outcomes. They are what leadership cares about, what justifies your budget, and what separates strategic marketers from tactical ones.
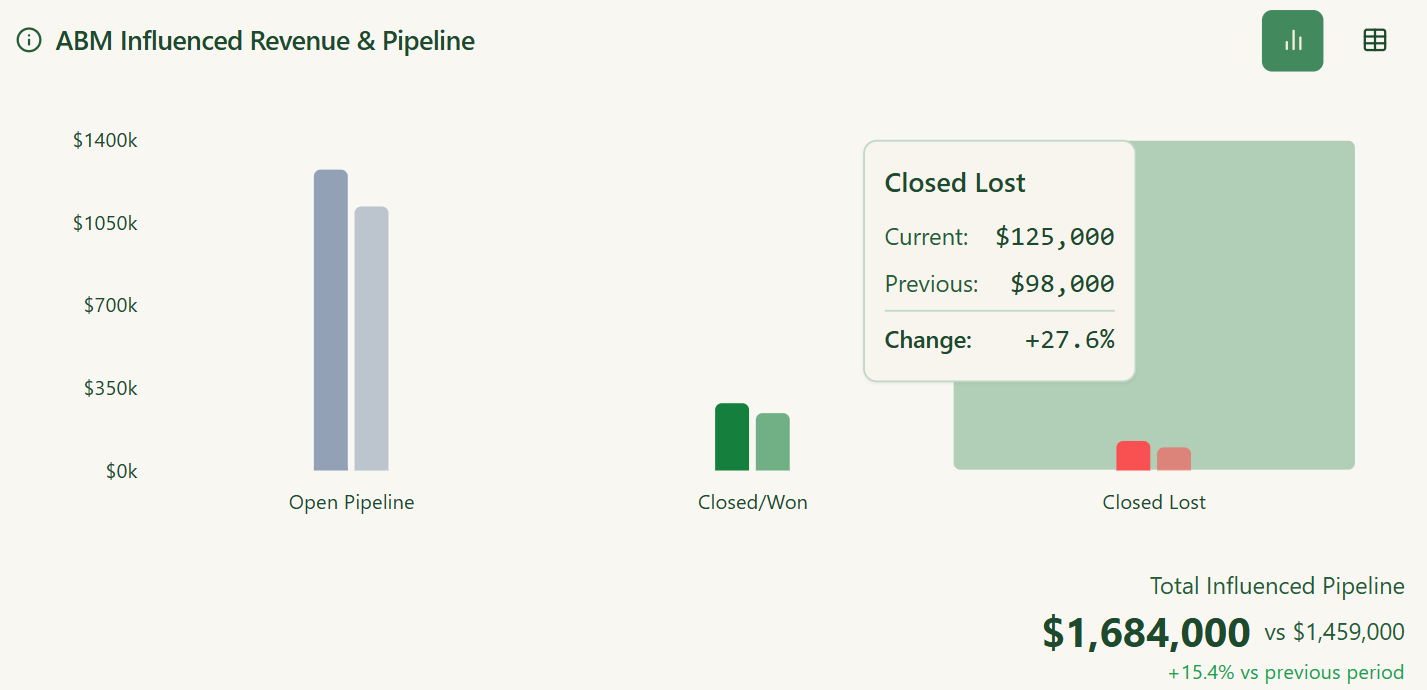 This measures the total pipeline value of deals where at least one contact at the account was exposed to your LinkedIn ads before the deal was created. 2026 benchmarks:
Pipeline influenced is not the same as pipeline “created by” your ads. B2B buying journeys involve many touchpoints – outbound, content, events, referrals. LinkedIn ads are rarely the sole driver. But they play a critical role in warming accounts, building familiarity, and shortening sales cycles. The key is tracking influence, not sole attribution. You can learn more about how to set this up in my guide to ABM revenue attribution.
This is my favorite revenue metric. It tells you how much pipeline you generate for every dollar you invest in LinkedIn ads. 2026 benchmarks:
| Performance Level | Pipeline Per Dollar |
|---|---|
| Median | $5.21 |
| Top Performers | $15.20 |
The gap between median ($5.21) and top performers ($15.20) is nearly 3x. What separates them? Top performers typically have tighter account lists, better alignment between ads and sales outreach, and they track company-level metrics to avoid wasting budget on non-target accounts. 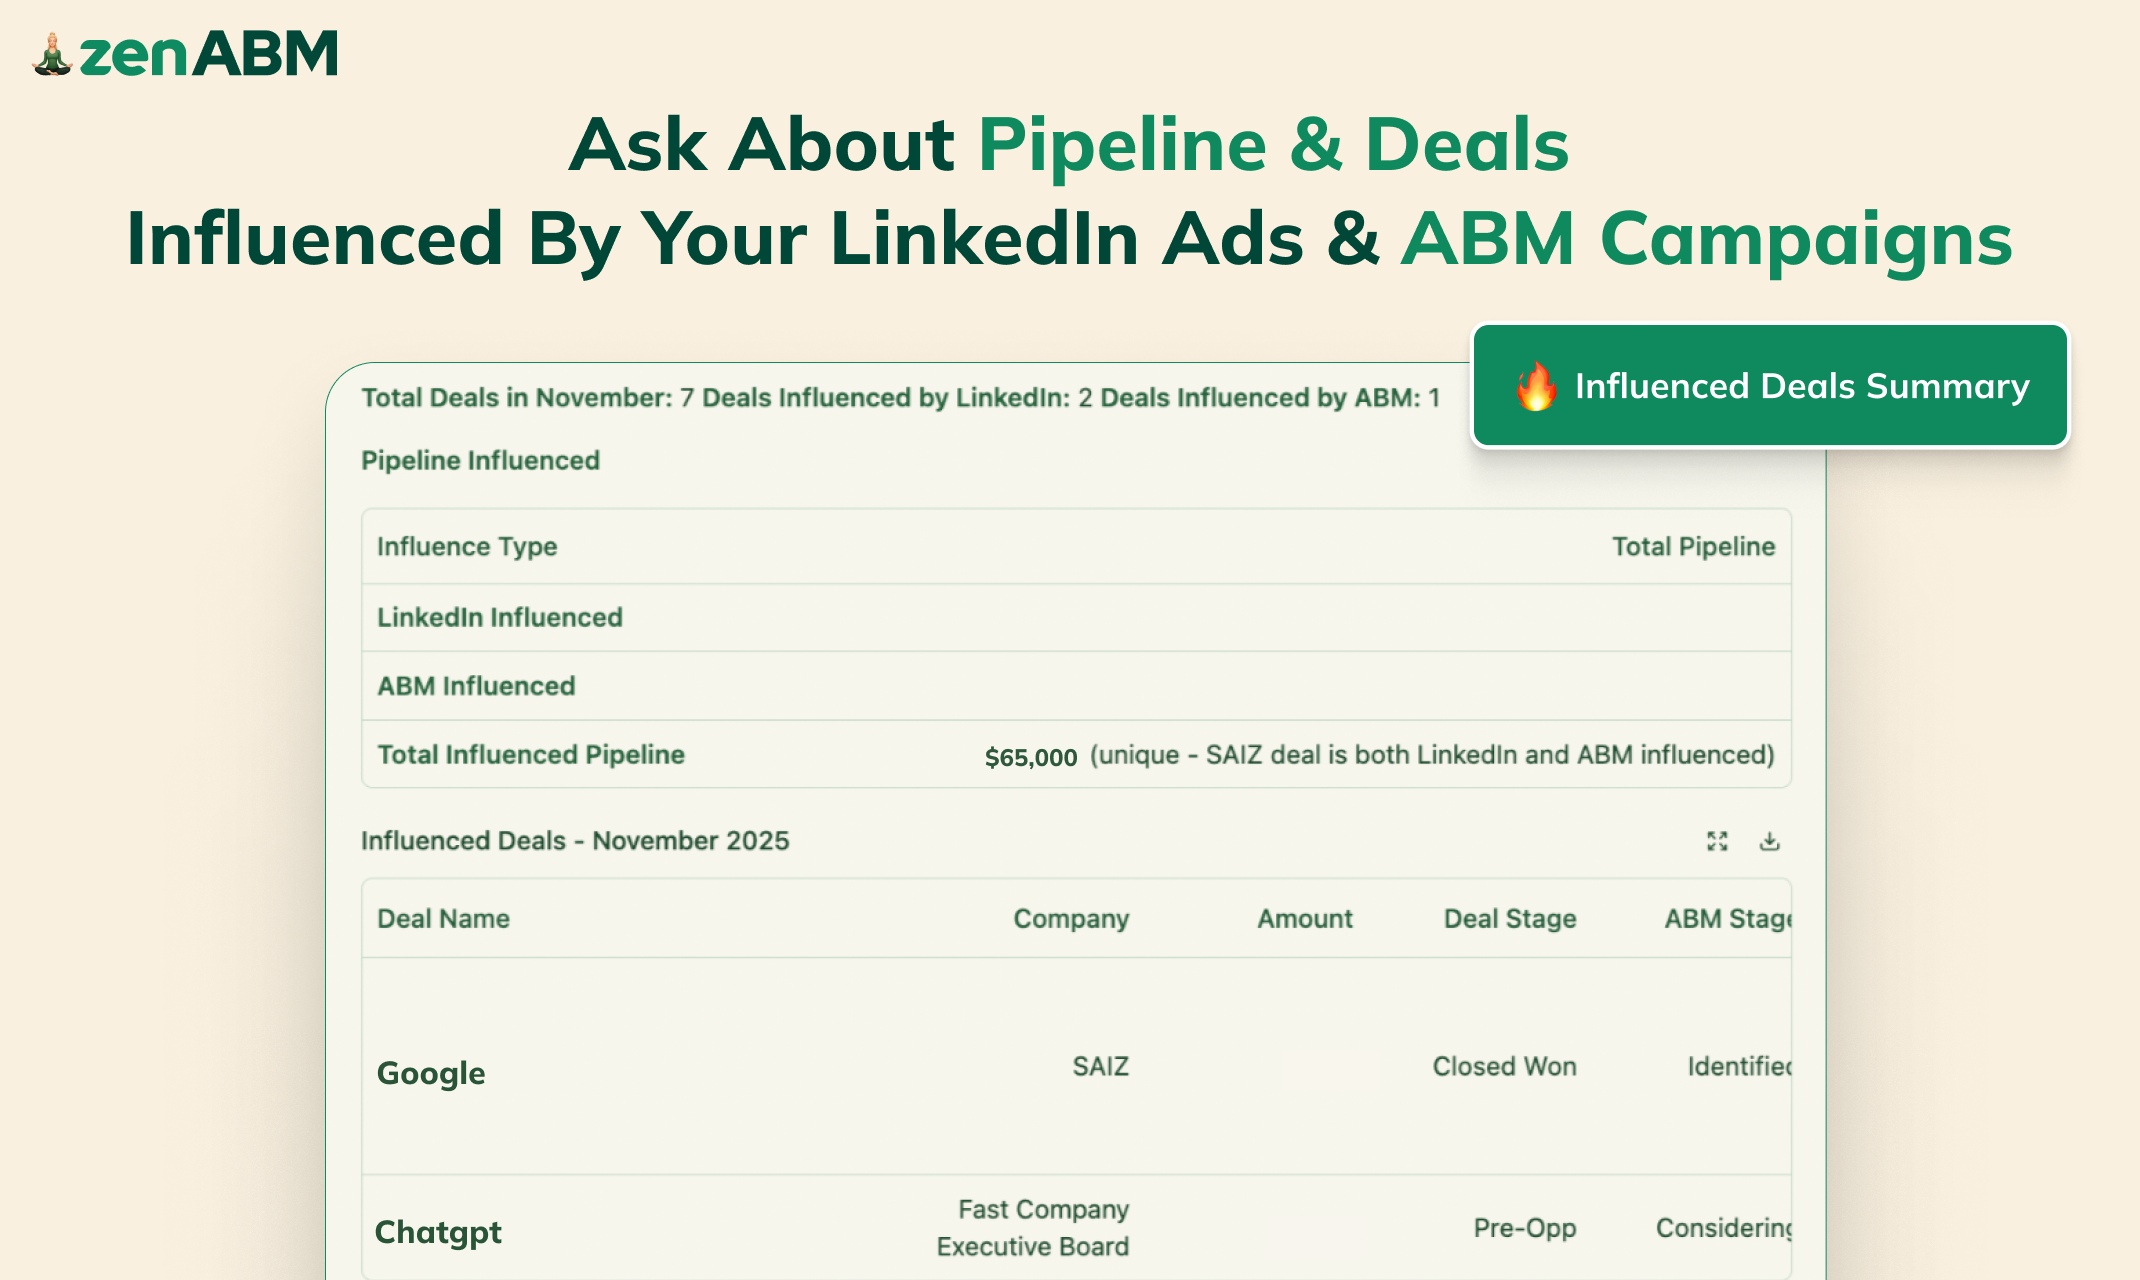
ROAS measures the revenue generated per dollar spent on ads. Unlike pipeline per dollar, this looks at closed-won deals rather than open pipeline. 2026 benchmarks:
| Performance Level | ROAS |
|---|---|
| Median | 1.62x |
| Top Performers | 2.79x |
A 1.62x median ROAS means the average LinkedIn ABM advertiser is generating $1.62 in revenue for every $1 spent. That is already positive ROI. Top performers at 2.79x are nearly doubling their return. And remember – these numbers only capture directly attributable revenue. The brand awareness and trust-building effects of LinkedIn ads create additional value that is harder to quantify.
 This measures the percentage of target accounts that progress from receiving LinkedIn ad impressions to having an open deal in your CRM. 2026 benchmark: 0.58% median deal open rate That might sound low, but context matters. If you are targeting 1,000 accounts and 0.58% convert to deals, that is roughly 6 deals per month. At a $50k average deal size, that is $300k in monthly pipeline from your target account list. The math works when your account list is well-built and your targeting is precise.
This is the sales cycle metric that LinkedIn ads influence. How long does it take from the first time an account sees your ad to when a deal appears in your CRM? 2026 benchmarks:
These timelines matter for two reasons. First, they set realistic expectations – if you just launched LinkedIn ads last month, do not expect pipeline next week. Second, they help you design your campaign structure. You need enough budget to sustain 60-180 days of consistent impressions across your target account list. 
Not every campaign should be measured the same way. The metrics that matter depend on what you are trying to achieve. Here is a breakdown of which metrics to prioritize based on your campaign objective:
| Campaign Objective | Primary Metrics | Secondary Metrics | Vanity Metrics (Ignore) |
|---|---|---|---|
| Brand Awareness | Target account reach, impressions per account, CPM | Engagement rate, video completion rate | CTR, CPC |
| Engagement / Education | Engagement per account, clicks per account, content consumption | CTR, engagement rate, video views | CPM, impression volume |
| Lead Generation | Lead gen form completion rate, cost per lead, lead quality | CTR, CPC | Impressions, CPM |
| Pipeline / Revenue | Pipeline influenced, pipeline per dollar, ROAS, deal open rate | Account stage progression, time to deal | CTR, CPC, CPM |
| ABM (Multi-stage) | Account stage progression, multi-threaded engagement, pipeline influenced | Target account reach, engagement score | Aggregate CTR, aggregate CPC |
Notice that CTR and CPC appear in the “vanity metrics” column for most objectives. That is not to say you should completely ignore them – they are useful for comparing ad creatives against each other. But they should not be the numbers you report to leadership or use to judge campaign success.
I have sat in enough QBR meetings to know this: your VP or CMO does not want to hear about CTR. They want to know if LinkedIn ads are contributing to revenue. Here is the reporting framework I use and recommend to ZenABM customers. Monthly report to leadership should include:
| Metric | Why Leadership Cares | Format |
|---|---|---|
| Pipeline Influenced | Shows the dollar value LinkedIn ads contribute to | Dollar amount + month-over-month trend |
| Pipeline Per Dollar | Shows efficiency of ad spend | Ratio + comparison to benchmark ($5.21 median) |
| Target Account Reach | Shows coverage of your ideal customer list | Percentage + accounts reached vs. total list |
| Account Stage Progression | Shows accounts moving toward buying | Funnel visual with stage counts + movement |
| Deals Influenced | Shows tangible pipeline impact | Deal count + total value + example accounts |
| Total Ad Spend | Shows investment level for context | Dollar amount + budget utilization % |
What to leave out of leadership reports: CTR, CPC, CPM, engagement rate, impression counts, click counts, video view counts. These are operational metrics for your internal ad management – not strategic metrics for leadership. The exception is when leadership specifically asks about them, or when you need to justify a budget increase. In that case, frame them in context: “Our CPC is $13.23, which is in line with the LinkedIn benchmark. But more importantly, every dollar we spend generates $5.21 in pipeline.”

The overall average CTR for LinkedIn Ads is 0.44-0.65%. Text Ads average 2.68%, Single Image Ads 0.42%, Carousel Ads 0.32%, and Video Ads 0.24%. But here is the thing – a “good” CTR does not necessarily mean a good campaign. Our 2026 benchmarks data shows CTR has a negative correlation with pipeline generation (rho = -0.170). Instead of chasing a high CTR, focus on whether your ads are reaching the right accounts and driving engagement from target companies.
For ABM, campaign-level metrics like CTR and CPC are secondary. Your primary metrics should be: target account reach (aim for 50%+ within 60 days), impressions and clicks per target account, engagement score per account, account stage progression (from Aware to Engaged to Interested to Opportunity), and multi-threaded engagement (multiple people at the same account interacting). These company-level metrics require an ABM platform like ZenABM since Campaign Manager does not provide them natively.
LinkedIn Ads ROI is best measured through three revenue metrics: pipeline influenced (the total value of deals where contacts at the account were exposed to your ads – median $13,819/month), pipeline per dollar spent (median $5.21, top performers $15.20), and ROAS (median 1.62x, top performers 2.79x). To track these, you need to connect your LinkedIn ad data with your CRM deal data. This requires either manual tracking, a BI tool, or an ABM platform that handles the attribution automatically.
LinkedIn is the most expensive paid social platform, so high CPC is expected. The average CPC ranges from $2.29 (Text Ads) to $15.61 (Video Ads). If your CPC is significantly above these benchmarks, check three things: audience size (too narrow = higher costs), ad relevance score (low quality = higher costs), and bidding strategy (manual bidding can help cap costs). But more importantly, do not optimize purely for low CPC. Cheap clicks from the wrong people are worse than expensive clicks from your target accounts.
Based on our 2026 data, the time from first LinkedIn ad impression to deal creation is 60-90 days for mid-market accounts and 90-180 days for enterprise accounts. This means LinkedIn Ads is not a quick-win channel. You need at least 3-6 months of consistent investment before you can fairly evaluate pipeline impact. Teams that give up after 30 days of “no results” are quitting before the data has a chance to materialize. Build your campaign budget and leadership expectations around these timelines from day one.