
Two days after launching a LinkedIn ABM campaign live on camera during Workshop 4 of the ZenABM ABM Bootcamp 2026, we pulled the performance data and ran a live teardown.
The results:

If you find the results interesting, this post covers everything from the live ad teardown session, including the Userpilot competitor campaign data and Nihal’s live client campaign results.
Watch the full session on YouTube here.

A quick overview of the results:
Some tips:
A tool-recommendation: ZenABM gives account-level LinkedIn ad engagement for each ad creative, pipeline dashboards, account scoring, ABM stages, CRM sync, first-party qualitative intent, automated BDR assignment, custom webhooks, job-title analytics, impression capping via company exclusion, and AI chatbot Zena for natural language analytics starting at just $59 per month.
ZenABM’s ABM bootcamp workshop campaign had been live for exactly 2 days when we reviewed the data.
Here is what it showed:
| Format | Impressions | Spend | Landing Page Clicks | Cost per LP Click | Real CTR |
|---|---|---|---|---|---|
| TLAs (2 active) | 6,277 | $131.58 | 74 | $1.78 | 1.18% |
| Single Image Ads | ~5,000 | $269 | 28 | $9.64 | ~0.56% |
TLAs brought landing page clicks at 5.4x less cost than single image ads to the same audience in the same window of 48 hours.
This is consistent with our 2026 benchmarks report showing TLAs have a $2.29 median CPC vs. $13.23 for single image ads.

The live data, in fact, was even more favorable for TLAs than the median.
Important note on TLA metrics: The LinkedIn Performance tab showed approximately 10% CTR for the TLAs, which is an inflated number that includes likes, comments, shares, and “see more” clicks. The real CTR (Clicks to Landing Page / Impressions from the Engagement tab) was 1.18%. Always check the Engagement tab for TLA landing page click data. Never compare the Performance tab TLA CTR with single image ad CTR, because they measure completely different things.
The single image ads that performed best in the live campaign were not the ones my design team was, well, proud of, but the opposite.

Top 3 performing single image ads (by CTR):
And bottom performers?
The most visually creative ads with bold colors, minimal text, and strong visual concepts performed the worst.
Several barely crossed the 0.35% CTR threshold I consider for keeping an ad running.

This finding is consistent across multiple client campaigns Nihal has run.
His explanation: “Warm audience that already knows your brand wants to understand specifically what you do and whether it is relevant to their problem. Dense, informative ads serve that need. Beautiful abstract ads do not, because catchy stuff works for awareness, not education.”
This is the warm audience dynamic.
For cold audiences that have never heard of you, a bold visual hook may be necessary to stop the scroll.
For warm audiences that have already seen your TLAs and engaged with your brand, information density is the key.

Alongside the workshop campaign, we reviewed Userpilot’s live competitor takeout campaign, which targeted companies using a specific competitor.
Our key findings:
The most common mistake in LinkedIn ad management is impatient decision-making.
If you pause or replace an ad after 200 impressions, it produces meaningless data.
Here is the correct framework:
1. The 1,000 impression / frequency 2 rule: Do not make decisions about an ad until it has both 1,000+ impressions, AND an average frequency of 2 or higher. Frequency of 2 means the average viewer has seen it twice. At that point, the CTR is a reliable signal of how the audience actually responds to the ad, not just first-impression novelty.
2. Timeline: At $10K/month targeting 1,000-2,000 accounts, expect 1-2 weeks to reach 1,000 impressions per ad with “Rotate ads evenly” set. Please, do not touch anything before that.
3. CTR benchmarks from our 2026 benchmarks report:
4. When to replace: When an ad’s CTR drops below your benchmark threshold after 1,000+ impressions with frequency 2+, pause it and replace with a new ad. Keep 5 ads active at all times in your single image ad set. LinkedIn will not show the same ad to the same person for 72 hours, so having 5 ensures continuous brand presence across your audience without gaps.

On the basis of an analysis of 161,000+ ads from ZenABM users in our benchmark report, let’s look at the visual and copy patterns that consistently separate high from low CTR ads.
These traits were consistent across high-performing ad creatives:
These traits were consistent across low-performing ad creatives:
Note that LinkedIn won’t show an ad even twice to the same user in 24 hours.
So, with 5 ads active in an ad set, a person can see your brand every day with a fresh creative.
With 2 ads active, the user will see it every 2 days.
This is why maintaining 5 active ads is important not just for more data, but for sustained brand visibility.
What about creative fatigue?
Creative fatigue sets in when average frequency hits 3 per ad.
At that point:
Solution?
Replace it with a new creative aligned with the patterns that performed best in your first round.
Remember: Evergreen campaigns need creative refreshes every 4-8 weeks for most audiences. High-frequency campaigns (warm retargeting with small audiences) may need refreshes every 2-3 weeks. Monitor frequency in your LinkedIn Campaign Manager delivery metrics and set a personal alert to review creative when any ad reaches frequency 2.5.
For the full picture of running ABM on LinkedIn including how to connect ad performance data to account-level pipeline tracking, see the ultimate guide.
Everything discussed in this teardown breaks down when you rely only on LinkedIn Campaign Manager.
The interface was never designed to answer ABM questions like which target accounts engaged, which creatives moved accounts forward, or which ads actually influenced pipeline.
ZenABM exists precisely to close that gap.
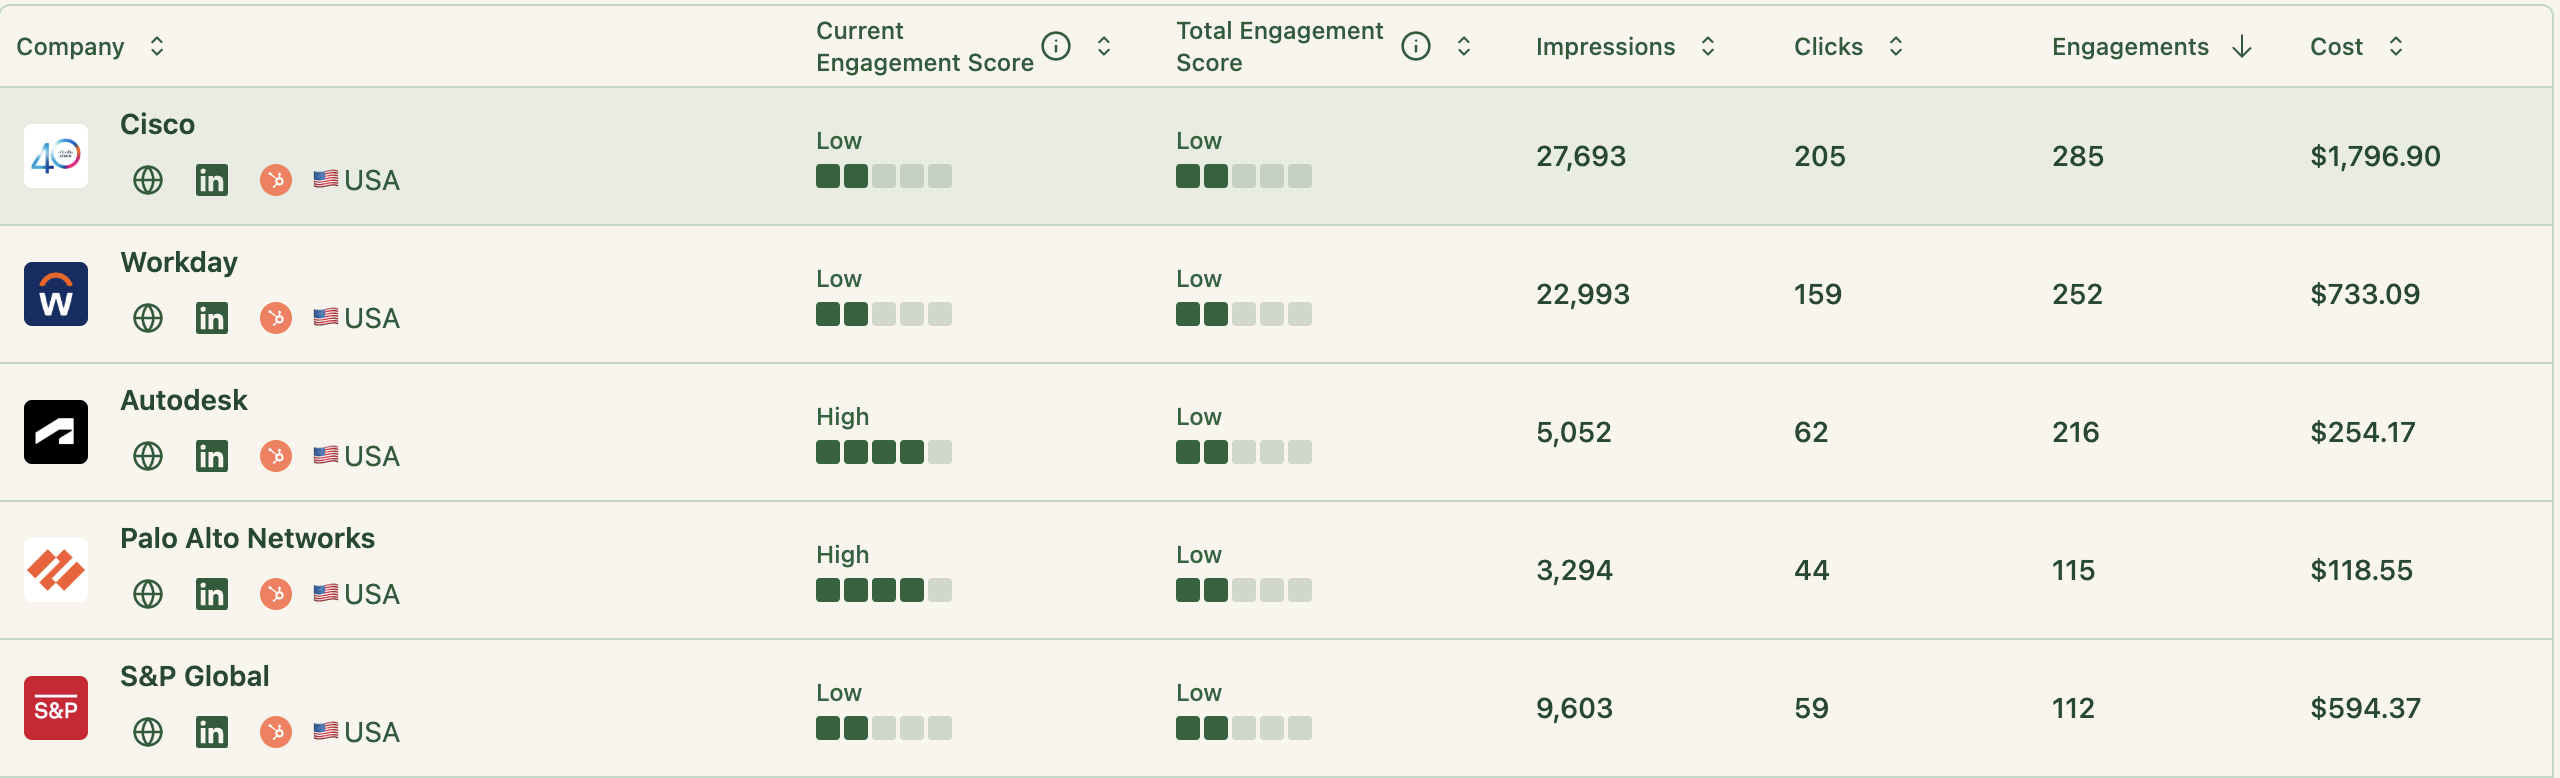
ZenABM captures account-level LinkedIn ad engagement directly from the official LinkedIn Ads API.
Instead of looking at aggregated CTRs and CPCs, you can see exactly which target companies saw, clicked, and engaged with each ad, campaign, and format.
This is critical when TLAs show inflated CTRs in the Performance tab, because ZenABM focuses on real engagement signals, not vanity metrics.
ZenABM lets you analyze ad performance by account quality, not volume.
You can quickly identify whether your “ugly but effective” ads are engaging Tier-1 target accounts or just driving cheap clicks from irrelevant companies.
This is how you separate ads that look good from ads that actually matter for ABM.
ZenABM enables job-title and persona-level engagement analysis.
Instead of guessing whether your dense, screenshot-heavy ads resonate with senior buyers, you can see which job titles within each account interacted with specific creatives.
This directly supports decisions like doubling down on product-heavy ads for warm audiences or changing messaging when engagement skews junior.

ZenABM supports impression capping via company-level exclusions.
When large enterprises start absorbing a disproportionate share of impressions, ZenABM allows you to exclude those companies automatically once they hit a defined threshold.
This keeps your spend evenly distributed across your target account list, something LinkedIn cannot do natively.
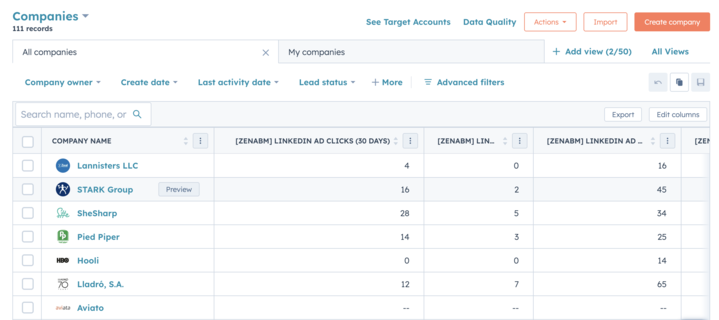
ZenABM connects ad engagement to ABM stages, account scoring, and CRM workflows.
When an account consistently engages with TLAs, dense single-image ads, or competitor comparison content, ZenABM updates the account’s stage, pushes signals into HubSpot or Salesforce, and can automatically assign a BDR.
Ads stop being a reporting artifact and start becoming an activation trigger.
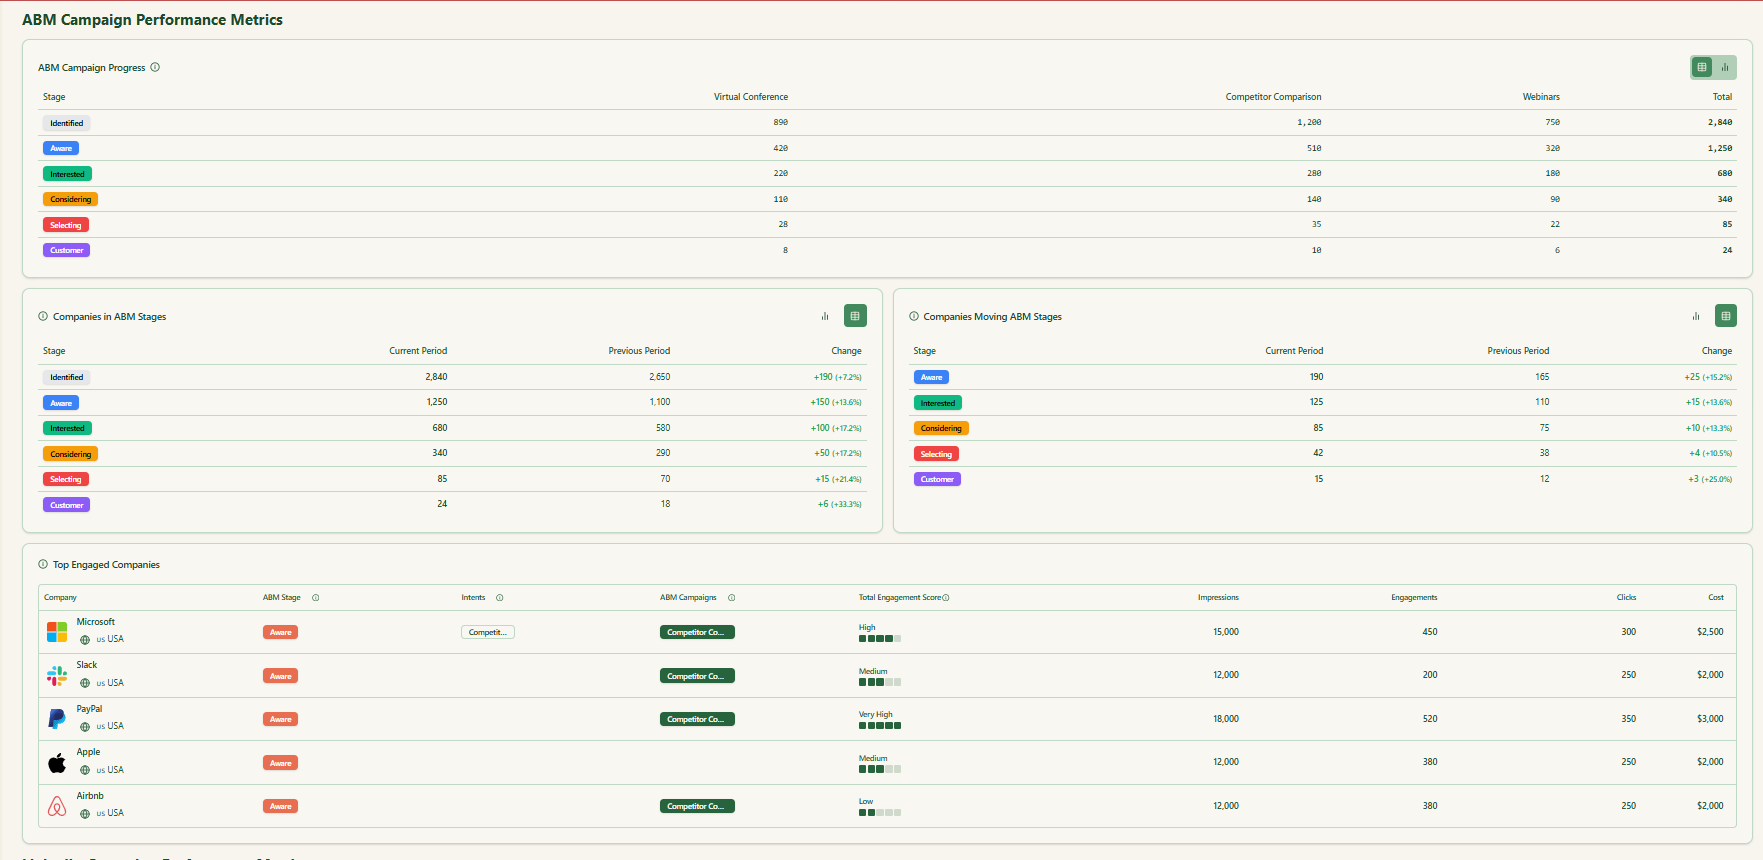
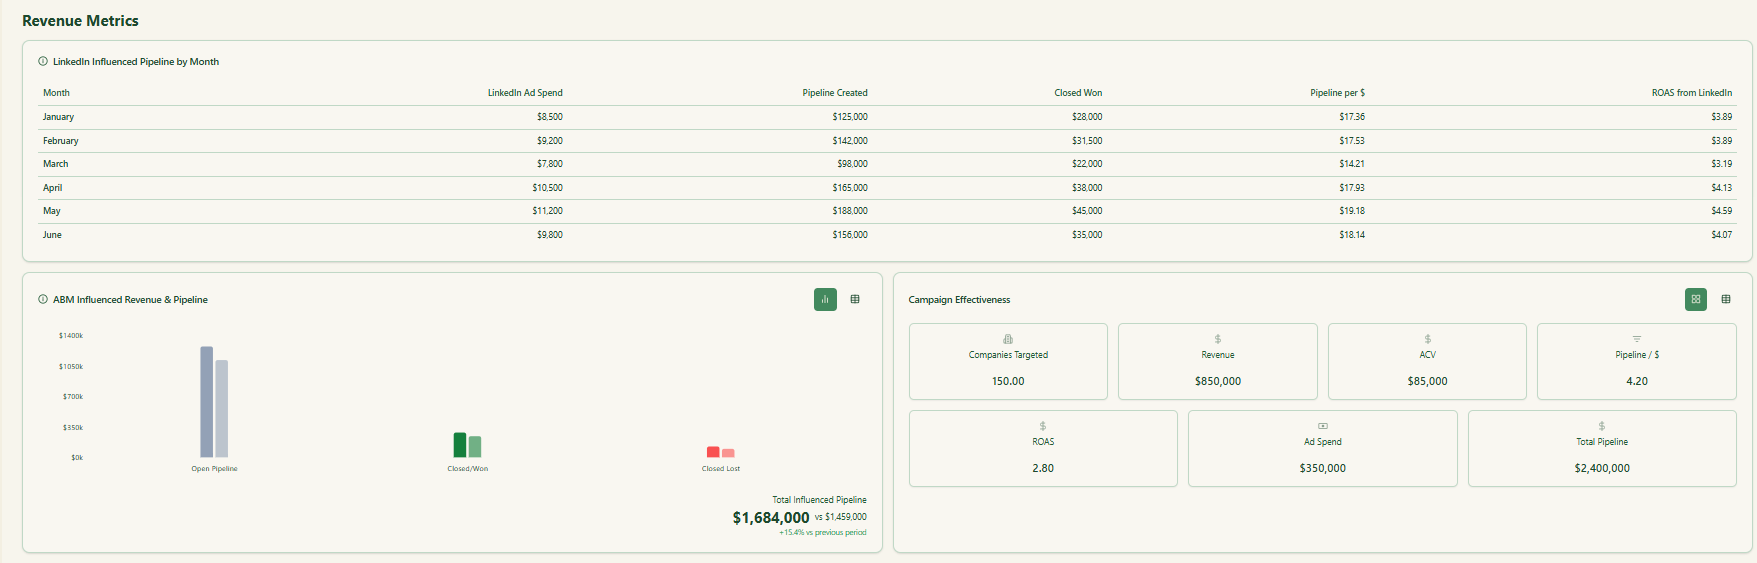
ZenABM gives you a single source of truth for ABM performance, combining ad-level data, account engagement timelines, pipeline contribution, and spend efficiency.
Instead of exporting CSVs and stitching dashboards together, you can see which creatives drove awareness, which ones fueled evaluation, and which ones correlated with real revenue.
It ships with dashboards that connect LinkedIn ads to account engagement, stage movement, and revenue.
ZenABM provides its AI chatbot called Zena that answers analytics questions in natural language.
You can ask Zena open-ended questions like you would a smart analyst and get company-level answers about:
Under the hood, Zena combines OpenAI with a library of prompts and endpoints to join ad engagement, spend, and CRM deals so it can explain which campaigns drove pipeline, which accounts turned into opportunities, and where performance concentrates.
Instead of exporting spreadsheets and stitching pivot tables, you get plain language outputs that can be used in reviews, standups, or exec updates.
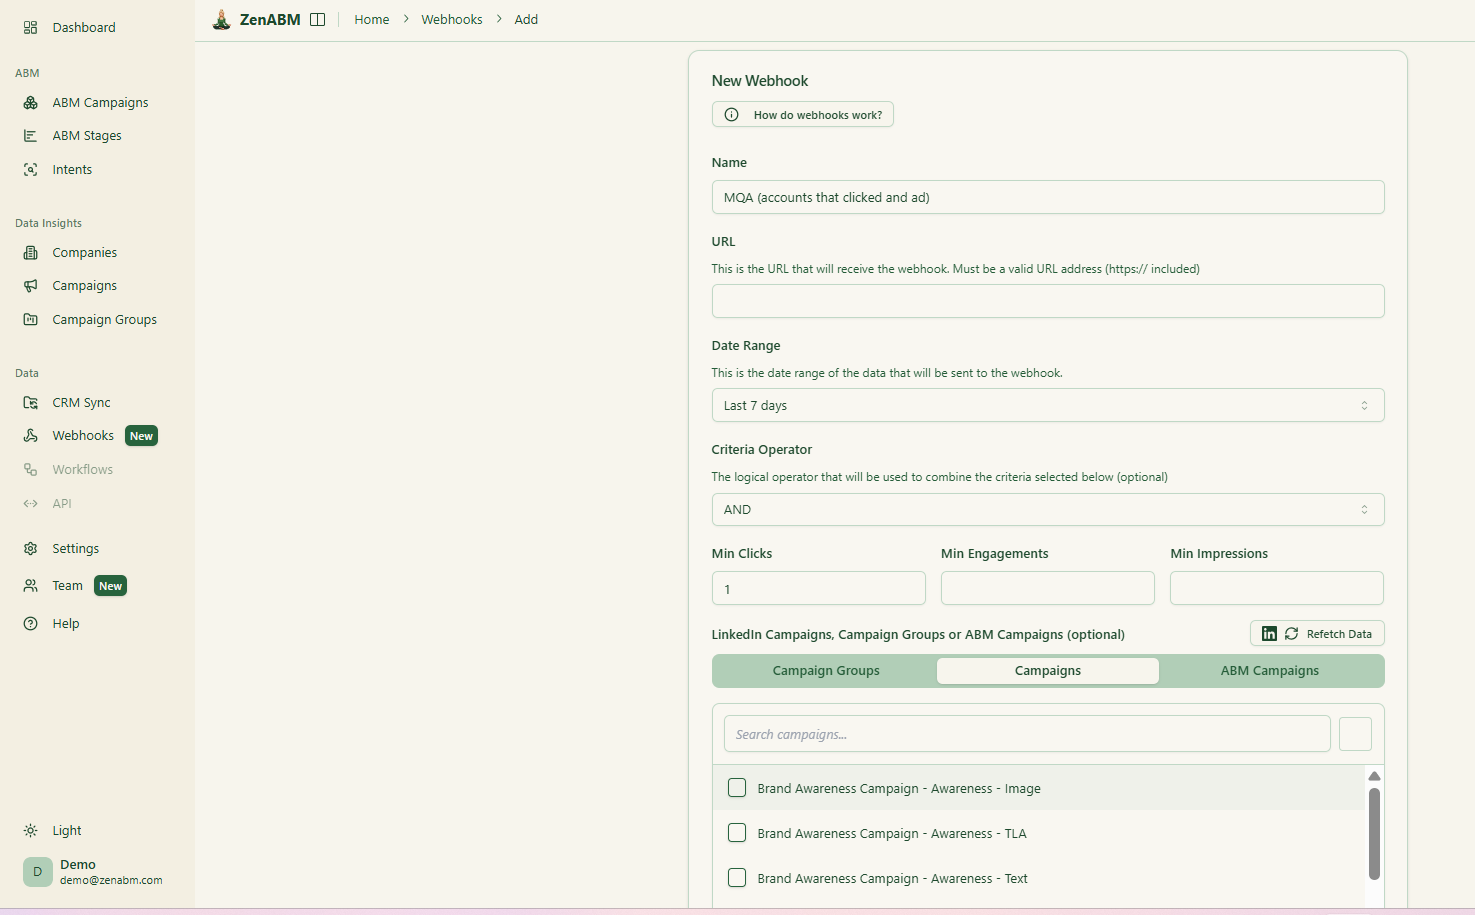
ZenABM’s custom webhooks let you push events into your stack, for example, Slack alerts, enrichment flows, or other ops automations.

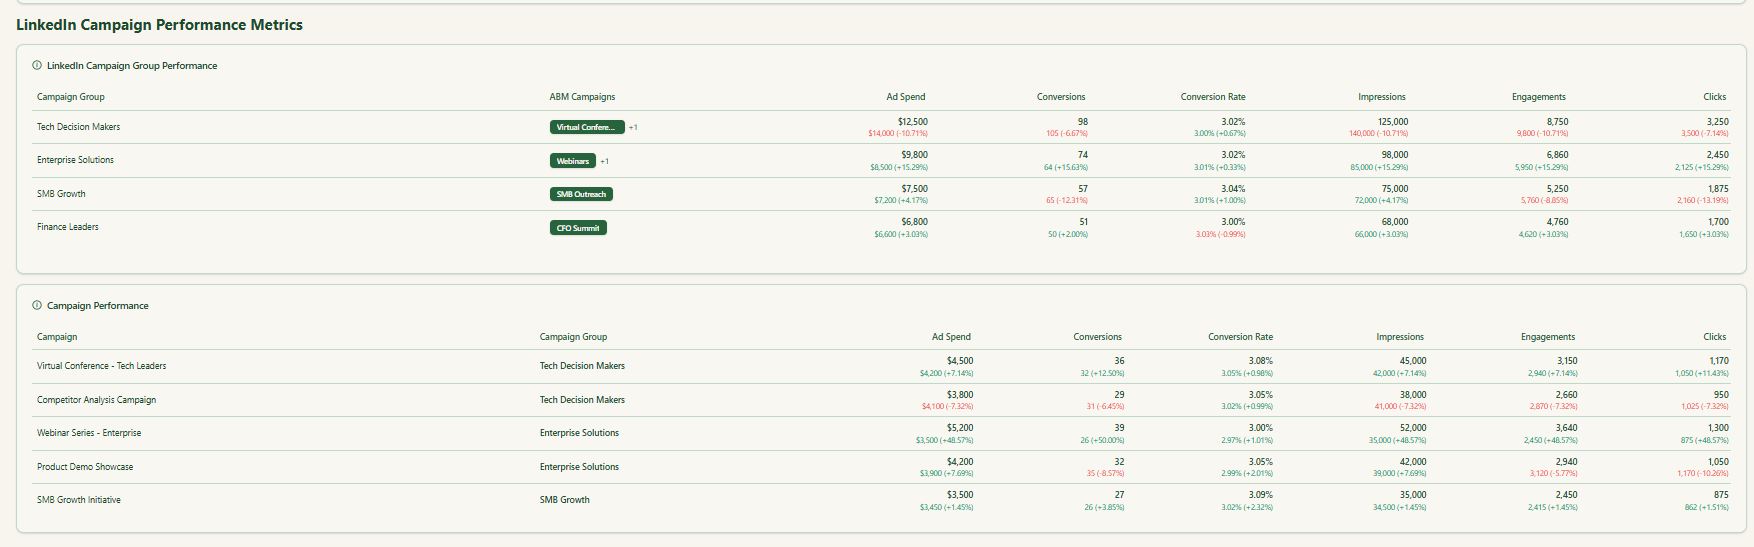
Most tools treat each LinkedIn campaign separately. ZenABM lets you group several into one ABM campaign object so you can see performance across regions, personas, or creative clusters.
Instead of juggling fragmented reports in Campaign Manager, you see spend, pipeline, account movement, and ROAS for the entire initiative.
For agencies, ZenABM offers a multi-client workspace.
You can manage multiple ad accounts and clients in one environment, each with its own ABM strategy, dashboards, and reporting, instead of constantly switching accounts in Campaign Manager.
LinkedIn ABM performance is not about prettier ads or faster optimizations, it is about respecting audience context, waiting for statistically valid signals, and measuring what actually matters.
Warm audiences reward clarity and information density, not visual cleverness, while TLAs quietly outperform when you track real landing-page engagement instead of vanity CTRs.
If you combine disciplined evaluation thresholds with account-level visibility into who engaged and why, ABM stops being guesswork and starts behaving like a repeatable system.
If you want to see these patterns in your own LinkedIn ABM campaigns, ZenABM shows exactly which target accounts engage with each ad, which creatives move accounts forward, and where budget is being wasted, all at the account level.
Try ZenABM free for 37 days and review your next campaign with the same teardown framework used in the ABM Bootcamp, without relying on guesswork or inflated metrics.
Wait until the ad has 1,000+ impressions AND an average frequency of 2 or higher. Only then is the CTR data reliable enough to make a decision. If CTR is below 0.35% for single image ads at that threshold, pause and replace. If above 0.5%, keep running. Replace proactively when frequency hits 3 – creative fatigue is setting in regardless of CTR at that point.
Audience context. The campaign was running to a warm audience that had already seen multiple Thought Leader Ads from our brand and was familiar with who we are. Warm audiences want information – they are evaluating whether what we do is relevant to their specific problem. Dense, informative ads answer that question. Abstract creative ads do not. For cold audiences that have never heard of you, the calculus may be different – a visual hook may be needed to stop the scroll first.
Use caution. LinkedIn ads are publicly visible in the Ad Library even when you exclude competitors from your targeting. Using competitor brand names or logos in ads risks trademark infringement claims. Use implicit comparisons, alternate spellings, or category descriptions rather than direct brand name use. Use AI to generate meme-format images rather than using original copyrighted meme images.
The Performance tab CTR for TLAs includes likes, comments, shares, profile clicks, and “see more” expansions – not just landing page clicks. To find real landing page CTR: go to the Engagement tab, find “Clicks to Landing Page,” divide by impressions. In our live campaign data, a TLA showing 10% Performance tab CTR had a real landing page CTR of 1.18%. These are not the same metric.