©2026 ZenABM - All Rights Reserved.

Running ABM campaigns on LinkedIn is powerful – but reporting on them can be a total time sink. Between exporting data from Campaign Manager, building pivot tables, and aligning it all with CRM activity… it’s easy to lose the story in the spreadsheets. This is where AI (and tools like Zena) can make a huge difference. Especially at the end of the year – when Demand Gen Managers & CMOs have already so much to report on…
Here’s how to use AI to automate and accelerate ABM reporting – from company engagement to revenue attribution. I’ll show you how to use our AI chatbot Zena (10 messages are completely free in the free trial, then it’s only $59 per month – with 10 chats per day, and only $159 for 50 daily chats with Zena!) – but for now, watch this interactive demo to see how Zena AI can help you:
For end-of-year ABM reporting, a Demand Gen Manager should:
Start with business impact – pipeline, revenue, and pipeline per $ spent by ABM campaign.
Then show leading indicators – how accounts and personas moved through the ABM funnel and engaged at the company level.
Finish with channel & creative diagnostics – which campaigns, ads, and formats actually worked, and where optimisation and budget shifts should happen next year.
Let’s dive deeper into how to get these insights.
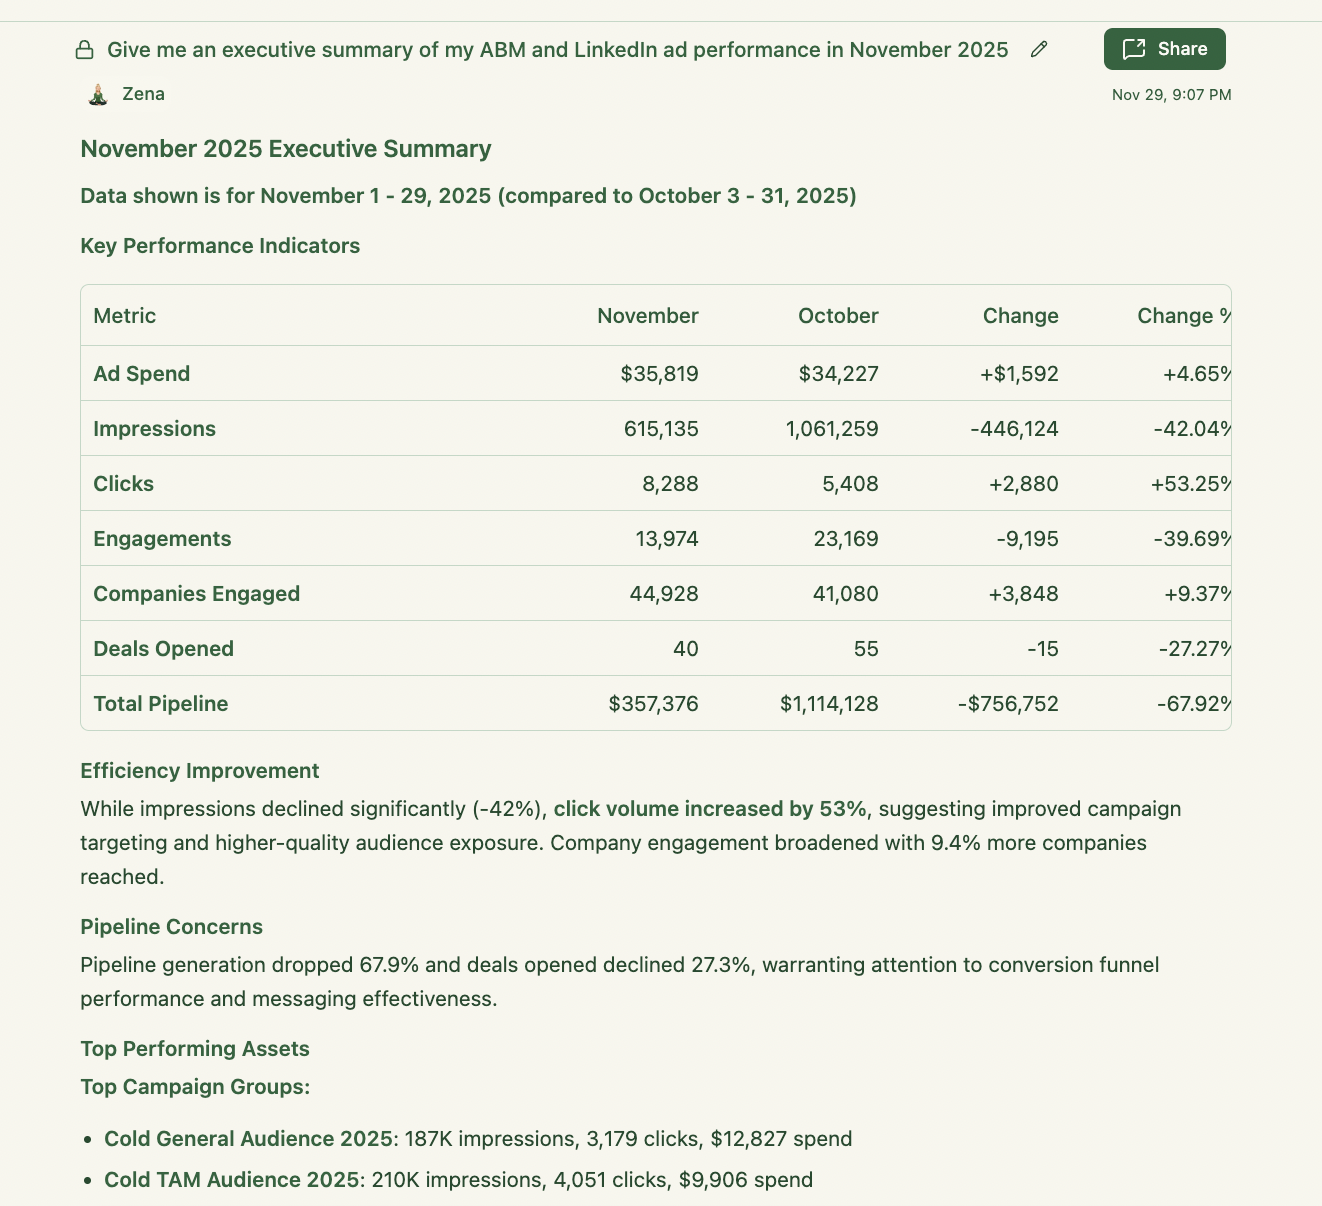
When reporting on ABM performance at the end of the year, focus on the metrics that actually show business impact – pipeline, account progression, and campaign effectiveness – not just clicks or impressions. Here are the 3 key areas a good end-of-year ABM report should focus – and how to produce it with AI:
Let’s dive a bit deeper into end of year ABM reporting:
This is the hero section of your EOY report: “Did our ABM on LinkedIn actually drive pipeline and revenue – and was it worth the money?”
a) Pipeline generated & influenced by ABM campaigns
Total pipeline influenced by LinkedIn + ABM campaigns (by quarter/month)
Pipeline generated net-new vs influenced existing deals
Breakdown by campaign, segment (SMB / mid / enterprise), and region
Number of opportunities where LinkedIn was part of the journey
b) Revenue influence
Closed-won revenue where ABM LinkedIn campaigns were in the opportunity journey
Revenue by key campaigns and/or buyer segments
Deals that started after ad engagement (first-touch) vs deals where LinkedIn supported progression or acceleration
Influence explanation (1 sentence):
Revenue is attributed to ABM campaigns on LinkedIn when ad engagement (impressions, clicks, or repeat interactions) from a target account occurs in the lookback window before or during an opportunity, and that opportunity is created or progresses in the CRM.
c) Campaign effectiveness: pipeline per $ spent
Pipeline per $ spent for each ABM campaign
Revenue per $ spent for the top 3–5 campaigns
Cost per influenced opportunity & cost per influenced closed-won
Show all pipeline influenced by LinkedIn ABM campaigns this year, broken down by campaign and segment.
Which ABM campaigns generated the highest pipeline per $ spent?
What percentage of total pipeline and revenue was influenced by LinkedIn ads this year?
Which deals became opportunities shortly after ad engagement? Show their journeys.
Rank all ABM campaigns by cost per influenced opportunity and cost per influenced closed-won deal.
Which campaigns drove the most revenue despite relatively low spend? (Quiet overperformers)
This is your leading indicators story: “Are we actually moving the right accounts through the funnel – and are the right people engaging?”
a) Funnel stage distribution & movement
How many accounts are in Aware / Interested / Selecting / Customer
Stage progression over the year: how many accounts moved 1+ or 2+ stages
Accounts stuck in Aware/Interested despite high spend
b) Company-level engagement with ABM campaigns
Top engaged companies by clicks, impressions, and repeat engagement
New accounts that engaged for the first time this year
High-intent accounts with no CRM activity or no open opportunities
Tier 1 accounts: who is warm vs cold
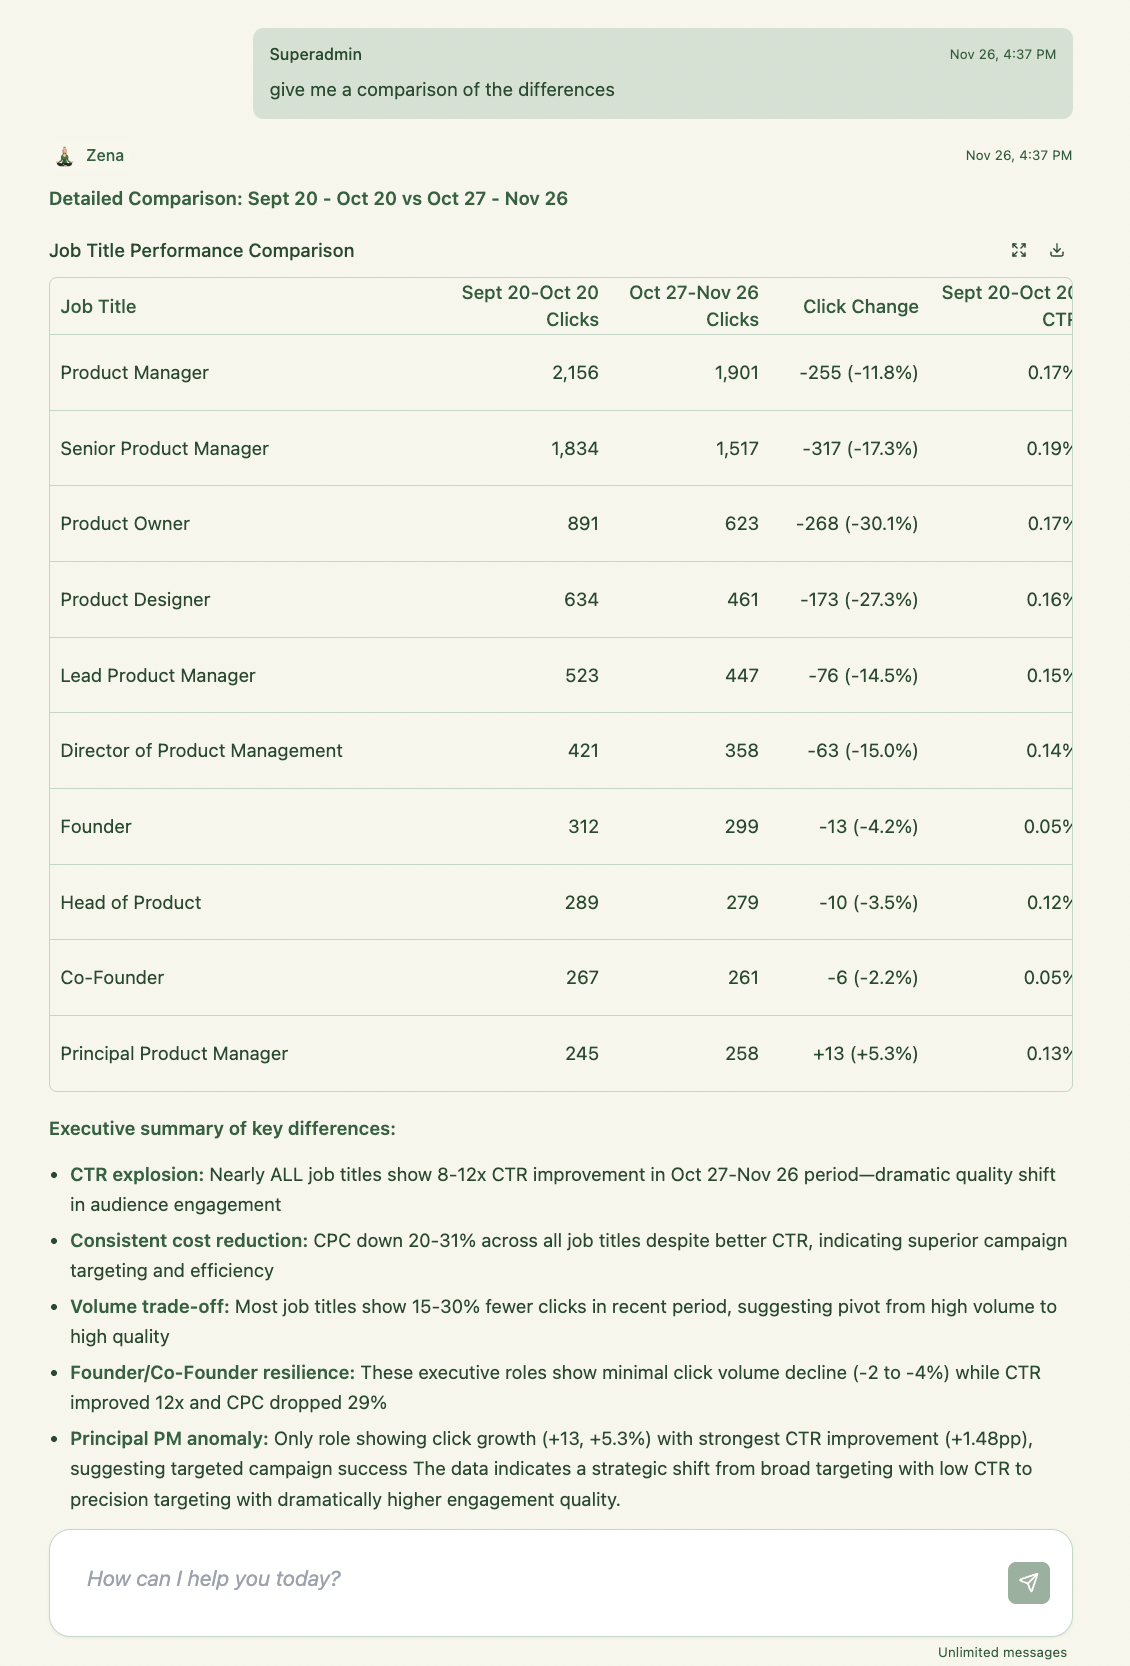
c) Persona / ICP-level engagement
Which job titles and seniorities engaged most across ABM campaigns
Persona engagement per campaign (who each campaign really resonated with)
ICP vs non-ICP engagement split
Personas that consistently show high intent (repeat clicks, multiple campaigns)
Show all accounts that moved at least 2 stages this year across ABM campaigns.
Which accounts are stuck at Aware despite high LinkedIn ad spend?
Show my top 100 engaged companies, their current funnel stage, and whether Sales has touched them.
Which companies engaged with our ads for the first time this quarter?
Which high-intent companies (multiple clicks, repeat engagement) have no opportunities in the CRM?
Which job titles and seniority levels engaged most with our ABM campaigns this year?
Which personas are over-represented in engagement vs our ideal ICP?
Which job titles show the strongest link between engagement and opportunity creation?
This is your channel / creative performance layer: “Which campaigns, ads, and formats actually worked and contributed to the ABM campaign results – and where did we waste budget?”
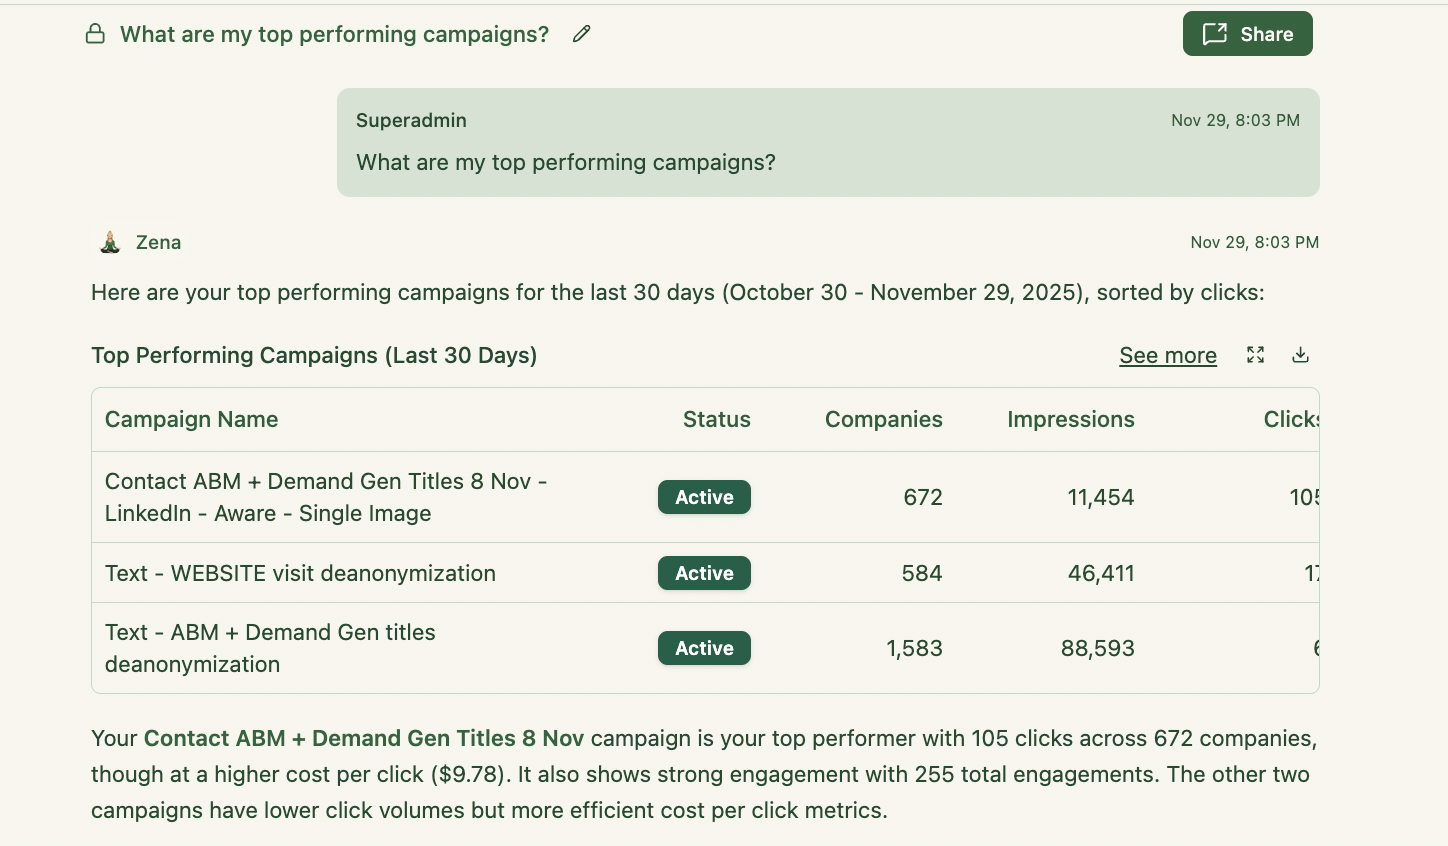
a) LinkedIn campaign performance
Best campaigns by CTR, CPC, CPM, engaged companies
Campaigns with declining engagement (fatigue)
Performance differences by segment/region (e.g., enterprise vs mid-market)
Campaigns that drive first-touch engagement vs nurture / acceleration
b) Ad-level performance
Top ads by CTR, engaged accounts, and influenced opportunities
Ads with high spend but low performance
Creatives repeatedly clicked by the same high-value accounts
“Hero” ads that appear frequently in journeys of closed deals
c) Ad format performance
CTR, CPC, CPM and engagement for image vs video vs TLA vs carousel
Formats that work best for C-level vs IC/manager personas
Formats that are best at pipeline influence, not just cheap clicks
Which LinkedIn campaigns performed best this year by engaged accounts and CTR?
Show campaigns where engagement dropped significantly in the last 90 days (potential fatigue).
Which campaigns drove the most engaged companies in enterprise accounts?
Which of my ads had the highest CTR and the highest number of engaged companies this year?
Which ads were most often involved in journeys for opportunities and closed-won deals?
Show ads with high spend but low CTR or low engaged accounts so I can cut them.
Rank ad formats (image, video, TLA, carousel) by engagement and pipeline influence this year.
Which ad formats perform best for VP+ and C-level personas?
Which campaigns and ads gave me the lowest cost per engaged company?
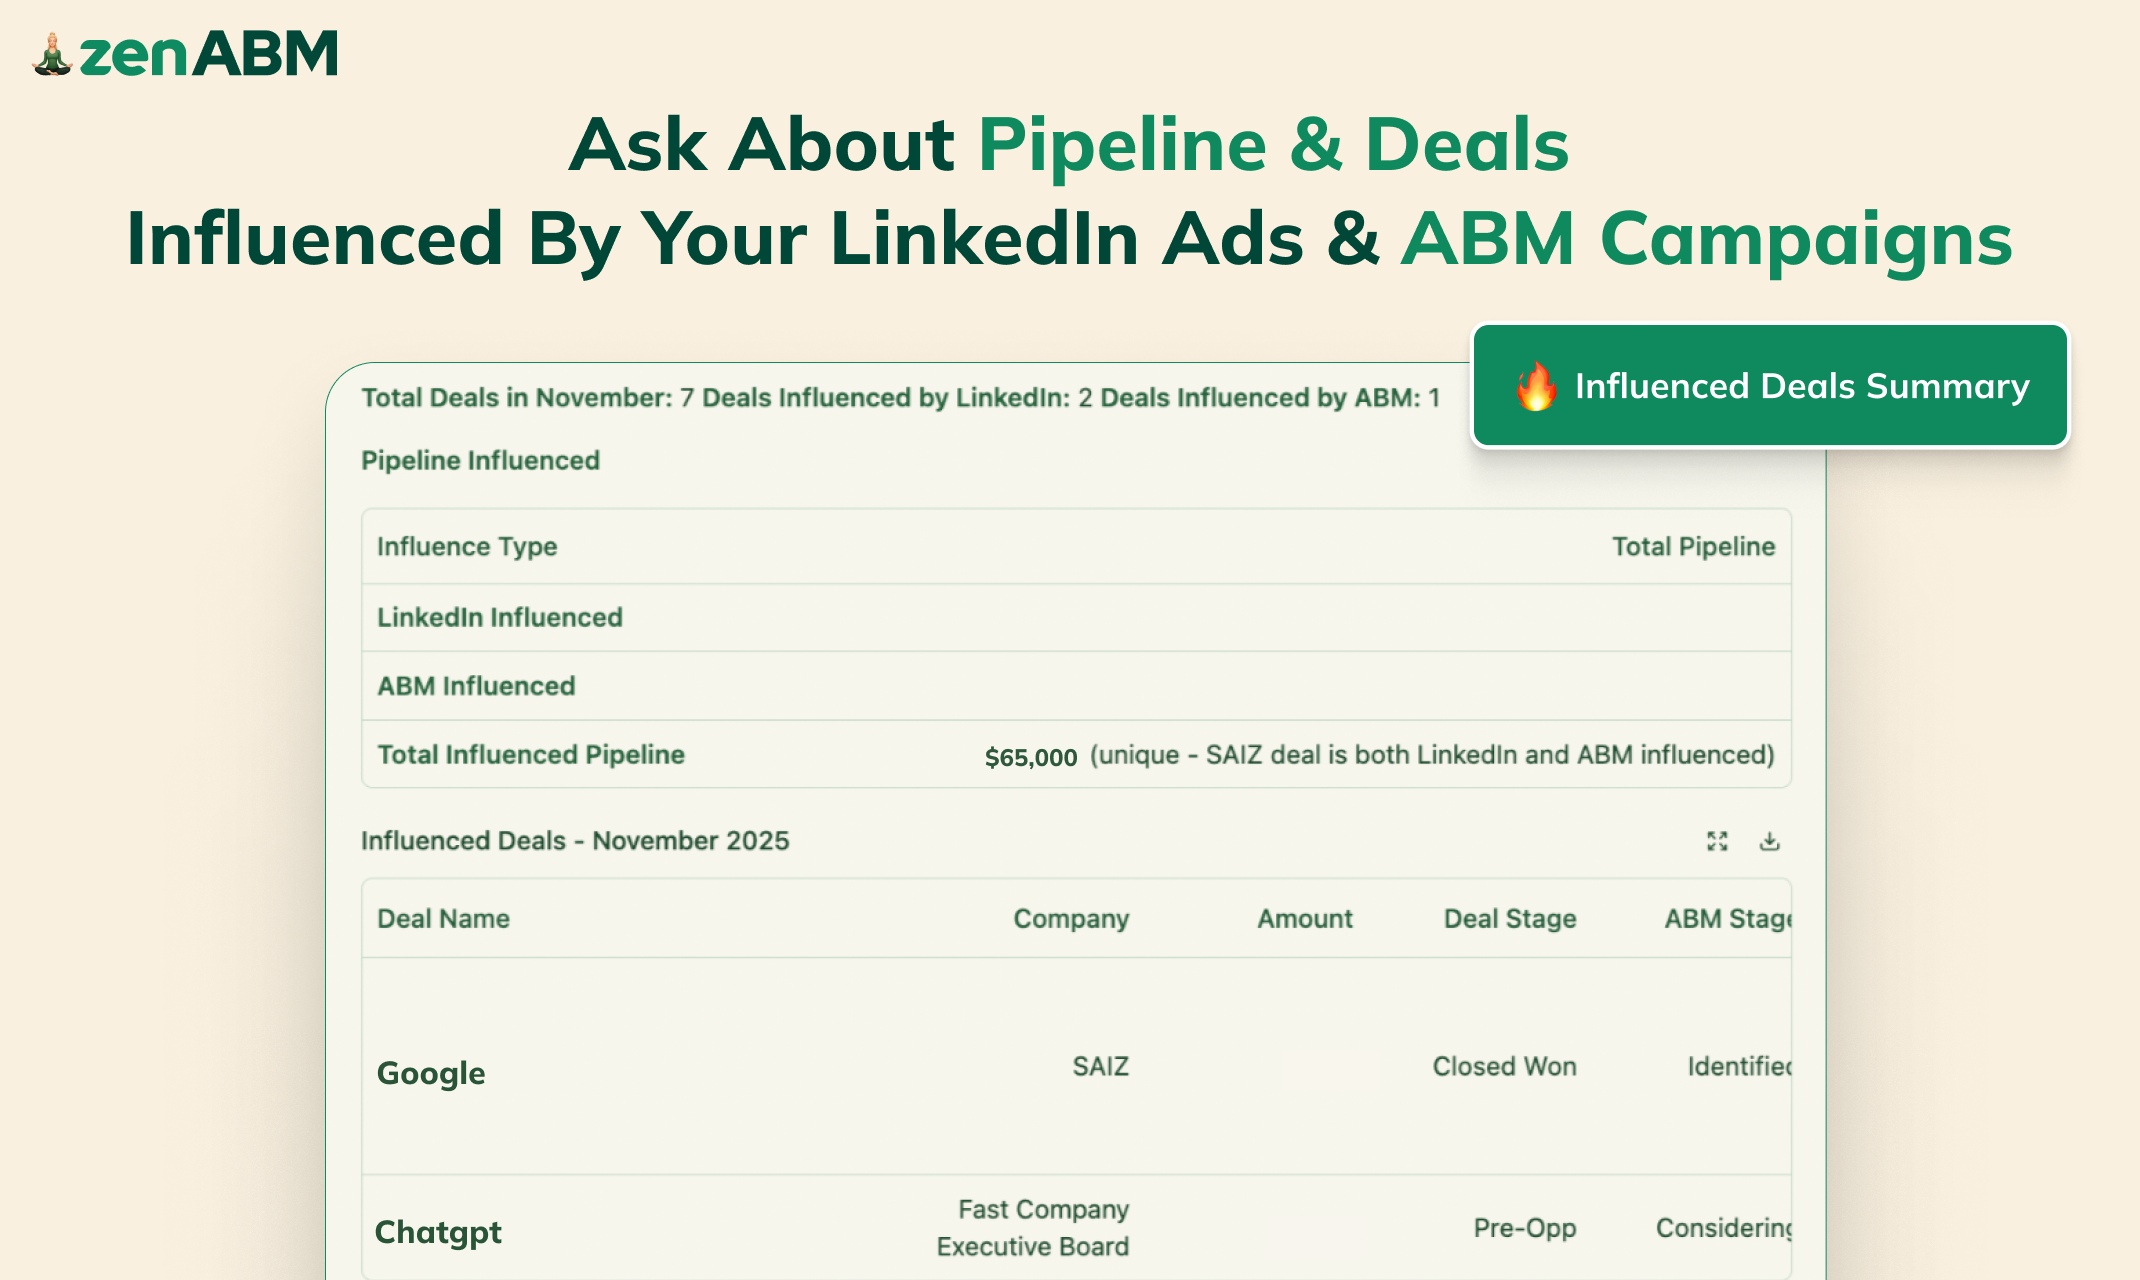
AI reporting isn’t just about clicks – it’s about revenue. Zena can match ad engagement to CRM deals to show which campaigns generated pipeline or closed deals.
Prompts to try:
Show all deals influenced by LinkedIn ads.
What percentage of pipeline was driven by ad engagement?
Which campaigns influenced the most revenue this quarter?

Which accounts became opportunities after clicking ads?
Walk me through the journey for Deal X.
Finally, you can show marketing’s impact on revenue without building attribution models from scratch.
AI can generate reports in seconds based on up-to-date LinkedIn and CRM data for a quick performance summary for leadership or sales. But more importantly – it can help you generate month-by-month trend reports – so you can see if your campaigns are producing more or less pipeline (deals) and revenue over time.
Prompts to try:
Generate a weekly LinkedIn Ads performance report.
Give me a one-page ROI summary for leadership.
Create a Sales-ready list of accounts to contact this week.
Show opportunities we might lose based on declining engagement.
What should I fix first in my LinkedIn Ads strategy?
No more cobbling together slide decks the night before a review.
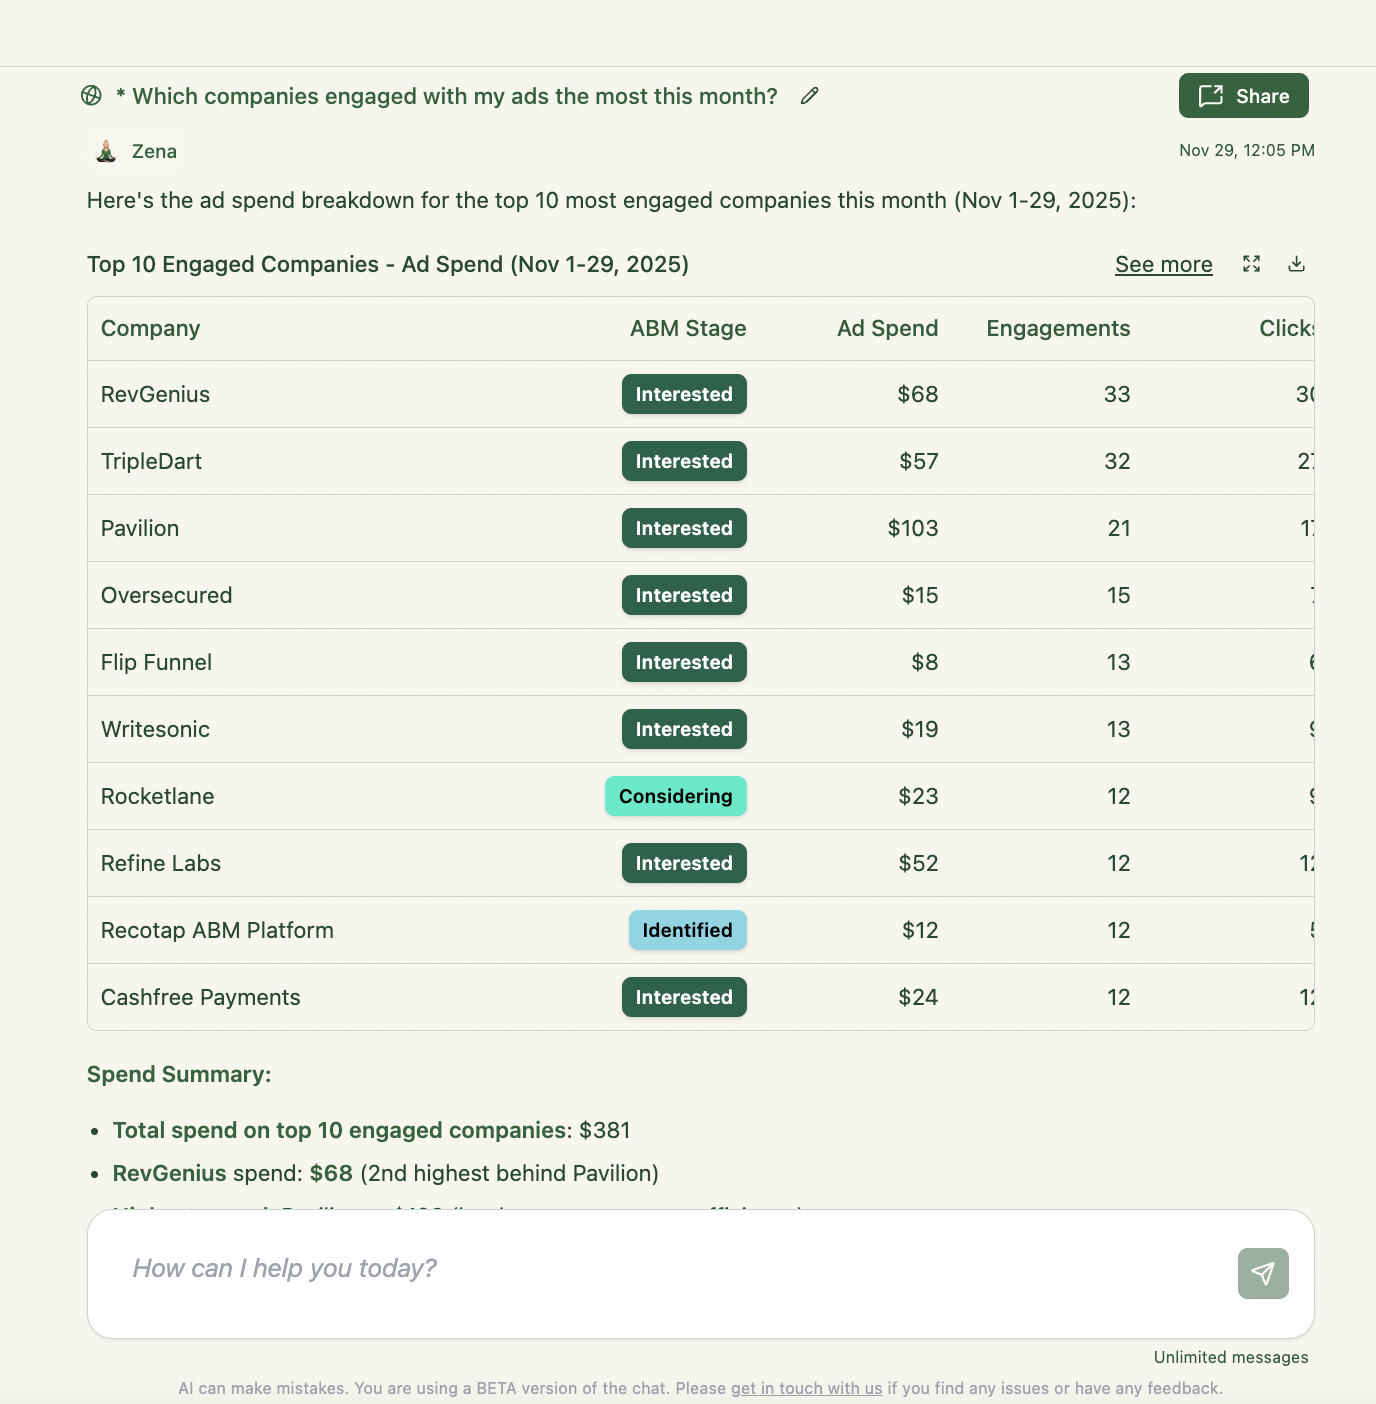
Zena AI can now surface exactly how each account interacted with your LinkedIn ads – no more anonymous clicks. Zena shows clicks, impressions, funnel stages, and engagement history for each company in your target list.
Prompts to try:
Show my top engaged companies this month.

Which companies clicked our ads the most this week?
Which accounts progressed from Aware → Interested in the last 30 days?
Which companies have high engagement but no CRM activity?
Which companies engaged for the first time this week?
This kind of granular reporting helps you spot the accounts worth passing to sales — without digging through 10 CSVs.
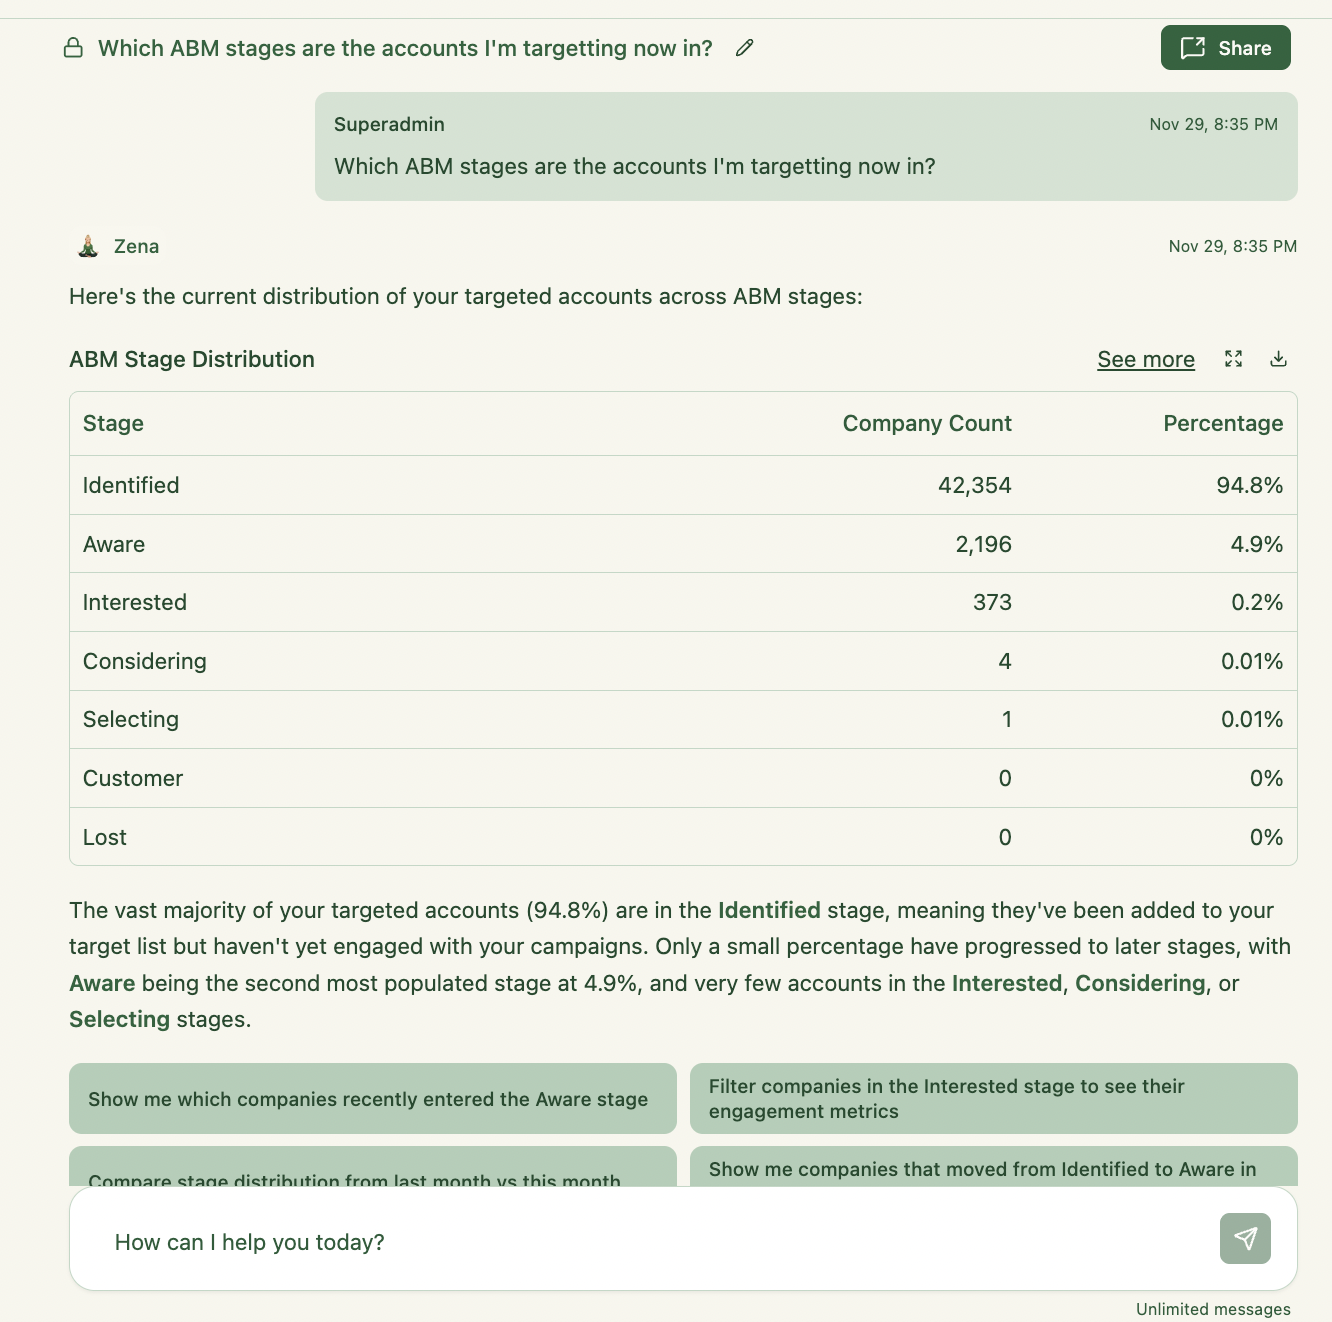
Zena applies ABM funnel stages (like Aware, Interested, Selecting) to each company automatically — so you can report on where accounts sit in the journey.
Prompts to try:
How many accounts are in each funnel stage this month?
Which companies moved to Interested stage in the past 30 days?
Show all accounts that advanced 2+ stages this quarter.
Which accounts are stuck at Aware despite high spend?
Who’s most likely to hit Selecting next?
This helps marketing and sales stay aligned on who’s warming up — and who’s going cold.
Want to know which campaigns actually worked? AI tools can compare ad performance across campaigns, showing clicks, CTR, engagement rates, and even pipeline.
Prompts to try:
Which LinkedIn campaigns performed best by CTR this month?

Rank ABM campaigns by highest impact on pipeline.
Which campaigns underperformed based on spend vs engagement?
Compare Campaign A vs Campaign B.
Which campaign drove the lowest cost per engaged company?
These insights help you focus budget and creative on what’s actually moving the needle.
Some formats work better than others – and AI can help you figure out which ones to scale. Zena compares performance across images, video, TLAs, carousel ads and more.
Prompts to try:
Which of my ads had the highest CTR this week?
Show top-performing image ads vs video ads.
Rank ad formats by engagement: video, image, TLA, carousel – this month:

Which ads had high spend but low performance?
What’s my best-performing ad this quarter?
This helps you optimize creative and allocate spend to what works best.
Understanding who’s engaging is just as important as what they’re engaging with. AI can break down engagement by job title, seniority, and persona.
Prompts to try:
Which job titles engaged most with our ads this month vs last month?
Break down clicks by seniority: IC, Manager, Director, VP, C-suite.
Which personas are missing from this campaign’s engagement?
Which job titles drove the most high-intent signals?
What role engaged the most in Campaign X?
These insights can help refine targeting, messaging, and future creative.
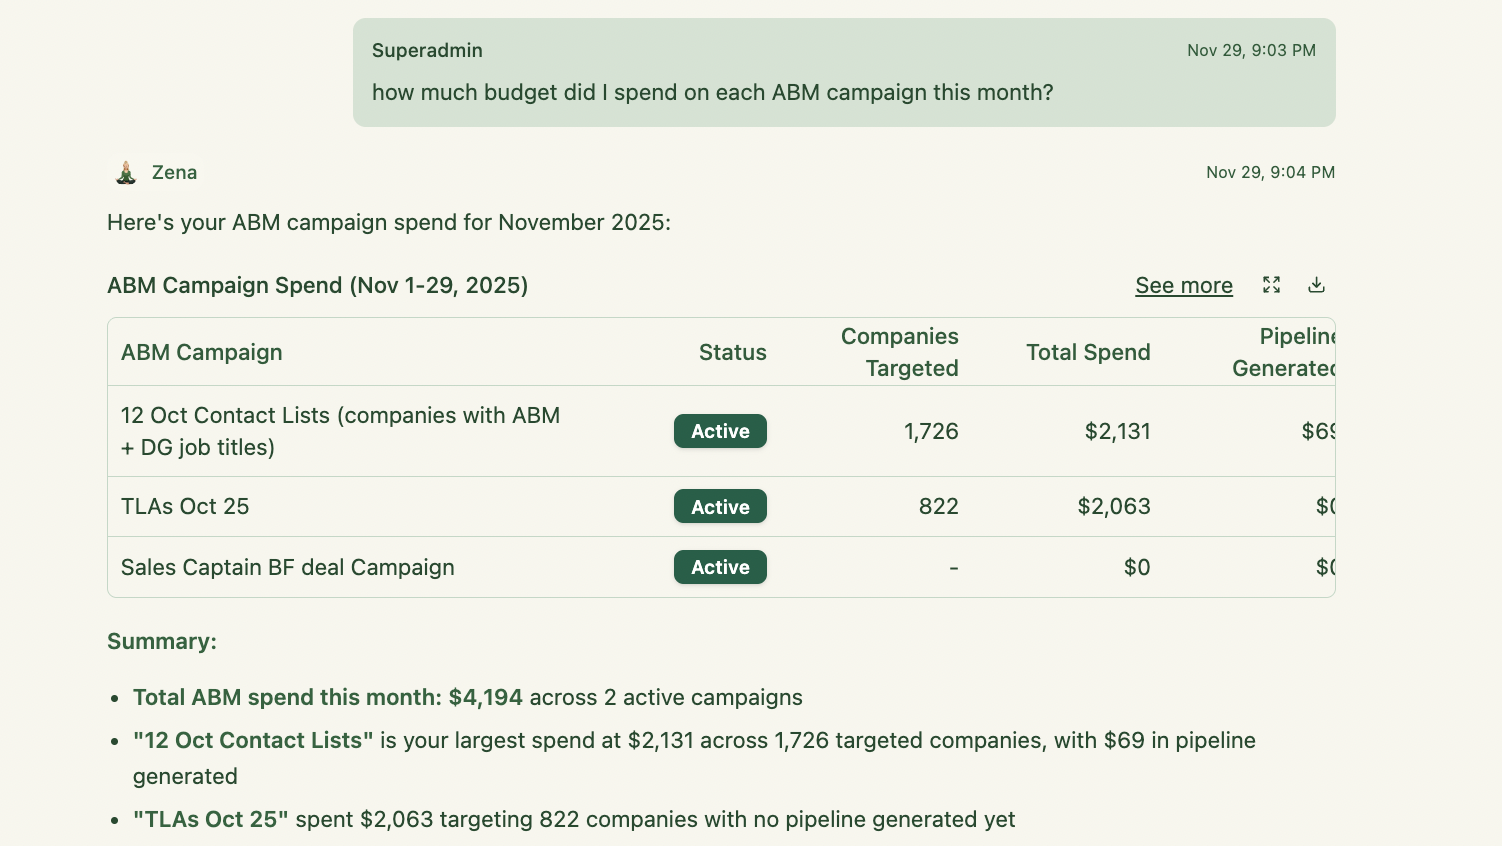
AI makes budget reporting far easier by showing spend per campaign, per company, and comparing it against pipeline and engagement.
Prompts to try:
Where did we spend the most budget this month?
Which companies cost the most to engage?
Show spend by campaign + ROI.
Which campaigns wasted budget (high spend, low engagement)?
What’s our cost per engaged company this quarter?
These metrics help you reallocate spend before it’s wasted.
Chat with your LinkedIn Ads + CRM data like it’s 2026:
Show my top engaged companies this month.
Which companies clicked our ads the most this week?
Which accounts progressed stages (Aware → Interested) in the last 30 days?
Which companies have high engagement but zero CRM activity?
Give me a list of high-intent companies we haven’t reached out to yet.
Show me engagement trends for {Company X}.
Which companies received the most impressions but no clicks?
Who are our fastest-growing engaged accounts?
Which companies engaged for the first time this week?
Which accounts dropped in engagement compared to last month?
Which campaigns performed best by CTR this month?
Which ABM campaigns influenced the most revenue this quarter?
How did campaign performance change month-over-month?
Show me campaign performance for enterprise vs mid-market.
Which campaigns underperformed based on spend vs engagement?
Which campaign drove the lowest cost per engaged company?
Compare {Campaign A} vs {Campaign B}.
Which campaigns are driving the most pipeline?
Which campaigns should I scale up based on ROI?
Which of my ads had the highest CTR this week?
Show top-performing image ads vs video ads.
Which TLAs performed best for high-intent companies?
Which ads are causing fatigue?
Which creatives drove the most pipeline influence?
Rank formats by engagement: video, image, TLA, carousel.
Which ads had high spend but low performance?
Show the top 10 ads by engaged accounts.
Which ads performed best in enterprise accounts?
What’s my best-performing ad this quarter?
Which job titles engaged most with our ads this month?
Break down clicks by seniority: IC, Manager, Director, VP, C-suite.
Which job titles engaged the most in {Campaign X}?
Which personas are missing from this campaign’s engagement?
Which job titles drove the most high-intent signals?
Where did we spend the most budget this month?
Which companies cost us the most to engage?
Show spend by campaign + ROI.
Which campaigns wasted budget (high spend, low engagement)?
What’s my cost per engaged company for this quarter?
Show all deals influenced by our LinkedIn ads.
Which campaigns influenced revenue this month?
What percentage of pipeline came from ad engagement?
Walk me through the ad engagement journey for {Deal X}.
Which accounts turned into opportunities after clicking ads?
Generate a weekly LinkedIn Ads performance report.
Give me a one-page ROI summary for leadership.
Create a Sales-ready list of accounts to contact this week.
Show opportunities we might lose based on declining engagement.
What should I fix first in my LinkedIn Ads strategy
AI doesn’t replace strategy — but it gives you the reporting firepower to make better decisions, faster. From campaign breakdowns to deal attribution, tools like Zena give you an ABM analytics assistant that works in real time, on your actual data.
Instead of stitching together 5 dashboards and guessing what’s working, just ask: “Which campaigns are driving the most revenue?” and get a clean, clear answer in seconds.
If you’re serious about ABM on LinkedIn, it’s time to stop living in spreadsheets – and start letting AI handle the reporting for you.
Start chatting with Zena today and unlock deep, company-level insights from your LinkedIn Ads data. Sign up for a free trial or book a demo to see how Zena can supercharge your ABM campaigns and ROI reporting!