©2026 ZenABM - All Rights Reserved.

If you’re running LinkedIn Ads and ABM campaigns (or ABM campaings with LinkedIn Ads!), you’re probably drowning in dashboards but still struggling to answer simple questions like:
“What’s actually working?”
“Which accounts should Sales talk to this week?”
“Is LinkedIn really influencing revenue – or just impressions?”
Getting this information out of your Linkedin Campaign Manager, and combining it with your CRM data would require hundreds of CSV exports and complicated Clay workflows, or custom OpenAI API solution, which you don’t have the time and resources to build.
And that’s exacly why we built Zena AI (ZenABM’s AI chatbot). Zena lets you chat with your LinkedIn Ads + CRM data and get instant answers about campaign performance, company-level engagement, pipeline impact, and ROI – in plain English, with no setup required.
Watch this quick interactive demo to see how it works:
With these prompts, you can ask Zena to:
Give your executive summaries
Analyse ABM campaign performance
Understand pipeline & revenue influence
Dig into company-level and persona-level performance
Optimise LinkedIn ads, ad formats, and spend
Uncover actionable optimisation opportunities
Generate reports and slides in minutes
I’ve grouped them into 10 sections (10 prompts each) so you can easily copy them into Zena, and then paste the outputs into your end-of-year ABM performance reports.
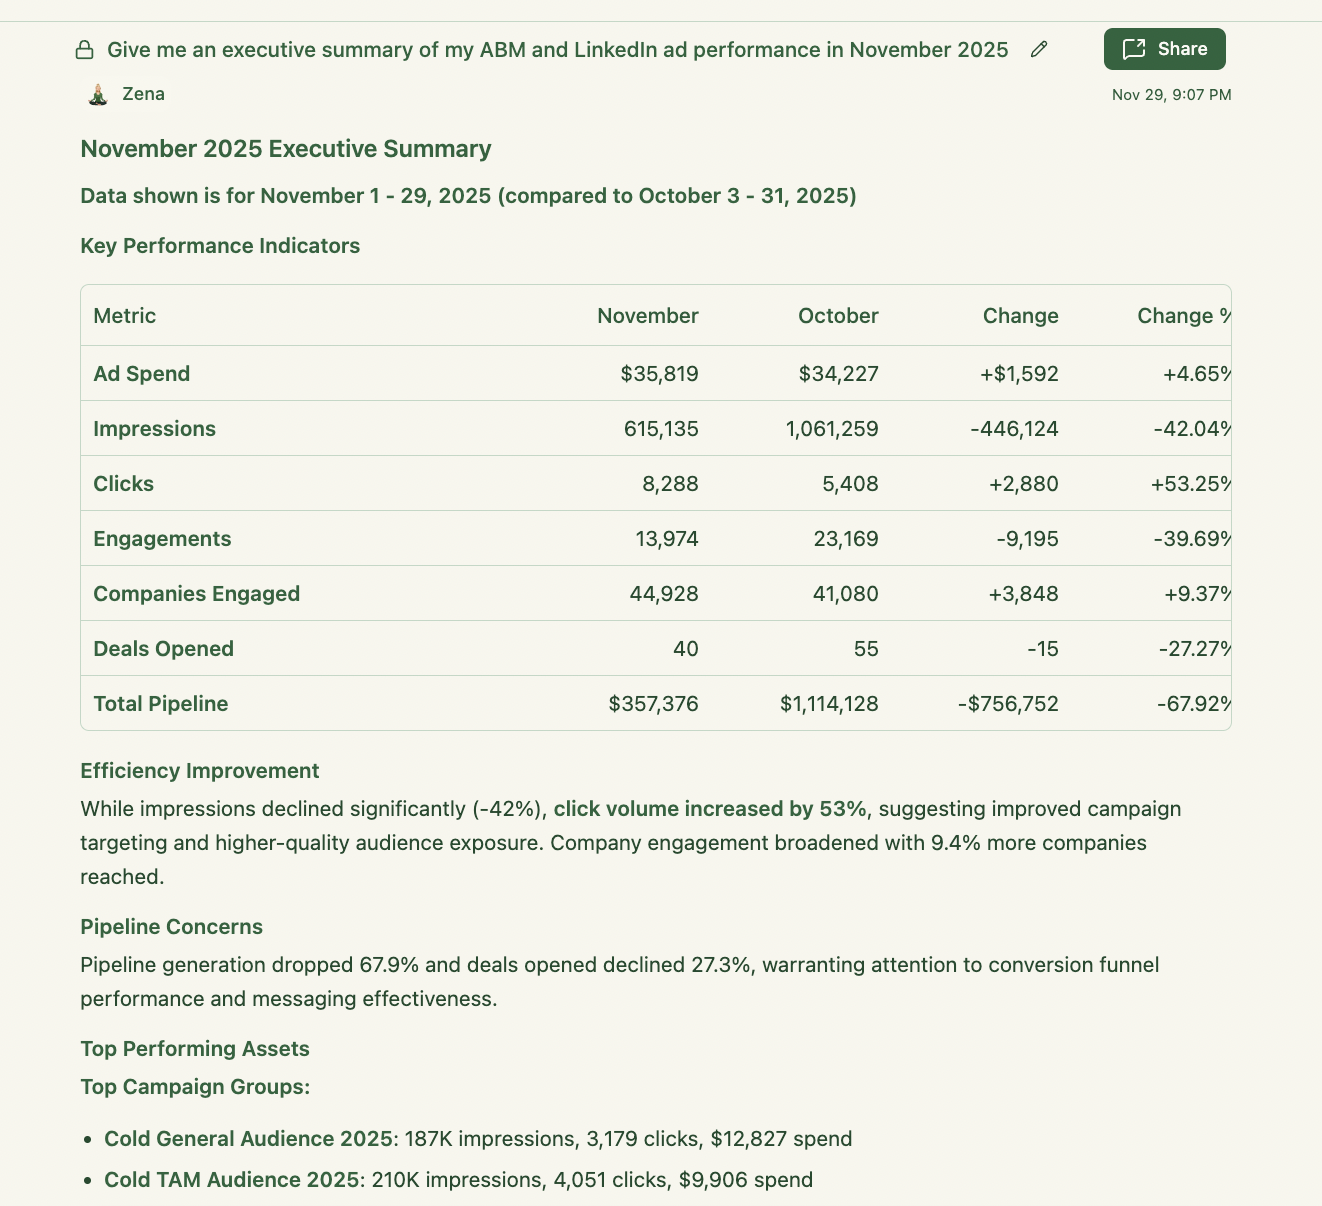
Use these when you want a quick “so what?” view for leadership or board decks.
Give me a high-level summary of our LinkedIn Ads performance in the last 30 days – include impressions, clicks, CTR, spend, and top 5 campaigns.
Summarise how our LinkedIn Ads contributed to pipeline and revenue this quarter – in 5 bullet points for executives.
What are the 3 biggest wins and 3 biggest risks in our LinkedIn and ABM performance this month?
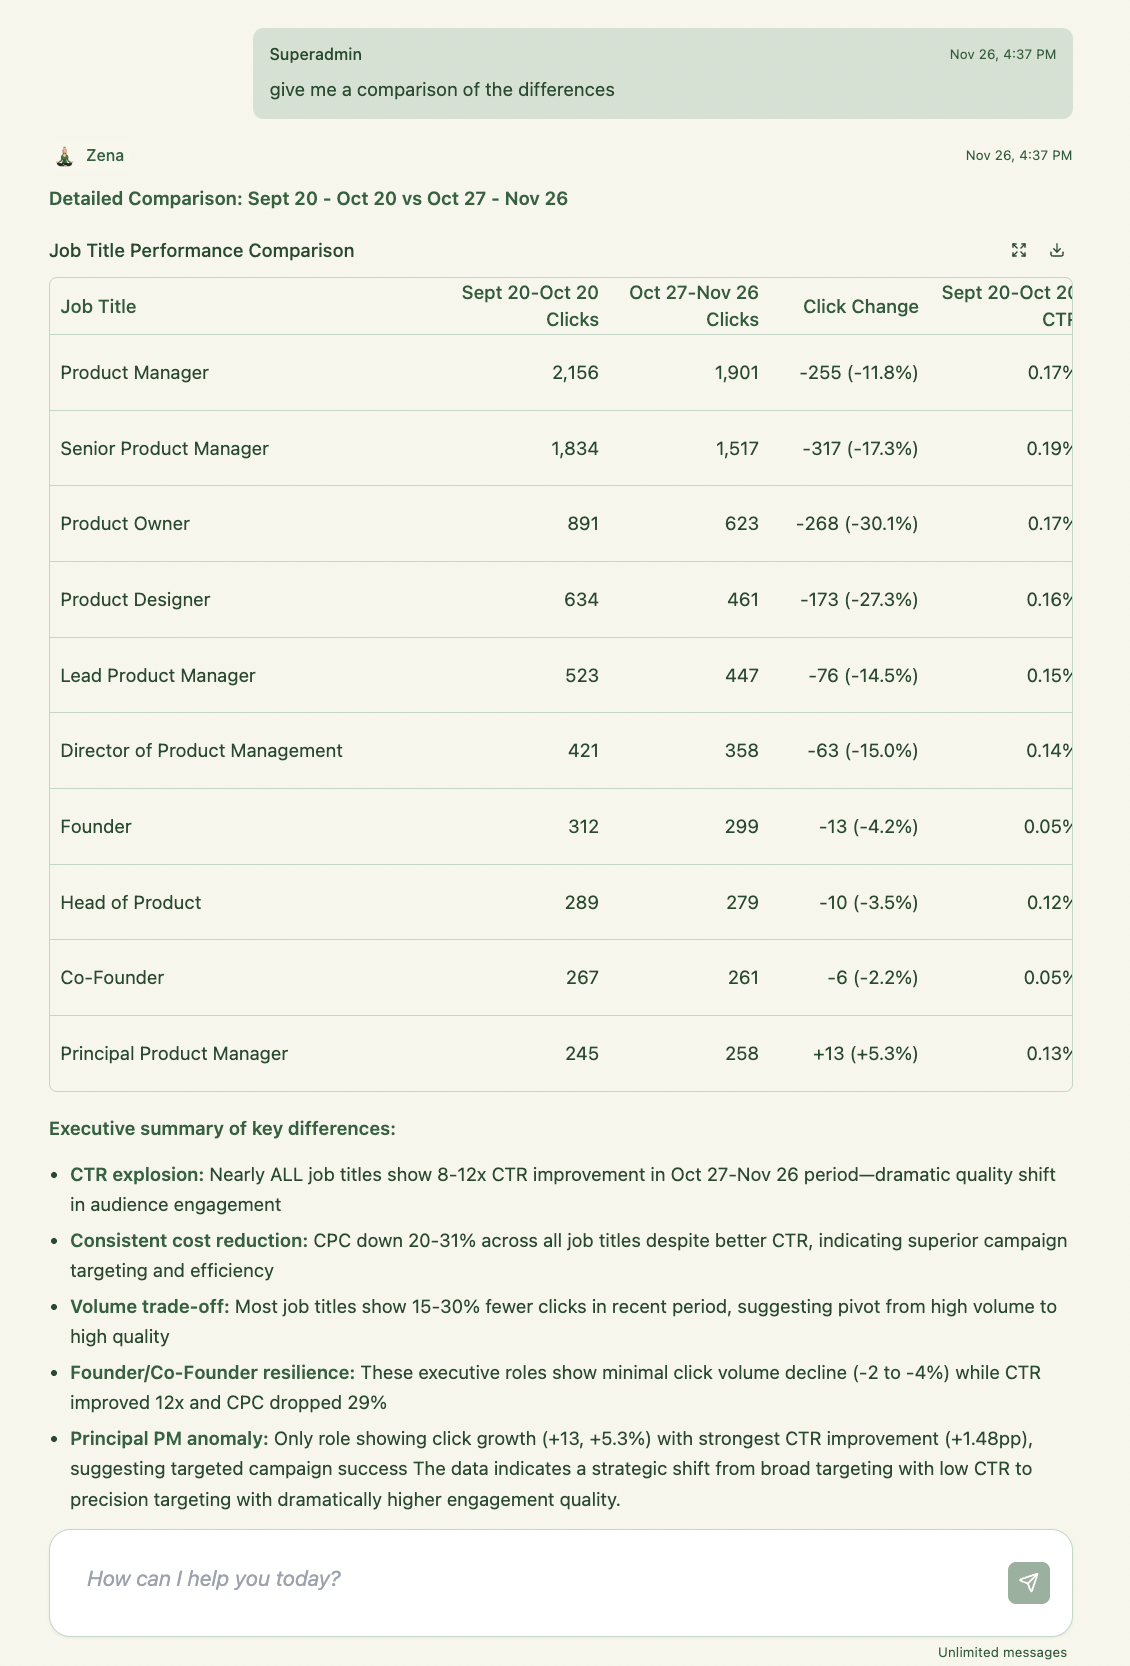
Create an executive summary comparing this month’s performance vs last month – highlight trends, not just numbers.
Explain, in plain English, whether our LinkedIn budget is paying off based on engagement, opportunities, and revenue.
Give me a one-slide-style overview of our top campaigns, top engaged companies, and influenced pipeline this quarter.
Summarise which personas (job titles/seniorities) are engaging most and how that impacts our sales cycle.
Give me a ‘state of the union’ for our ABM campaigns – what’s working, what’s not, and what to focus on next.
Summarise our top 10 most engaged accounts and where they are in the funnel, in a format I can send to Sales.
Write a short weekly performance update I can paste into Slack for the GTM team, based on the latest LinkedIn and ABM data.
These dig into your ABM campaigns to rank them by efficiency metrics:
Rank all ABM campaigns by engaged accounts in the last 30 days – include clicks, CTR, and influenced opportunities.
Which ABM campaigns generated the highest number of high-intent signals this quarter (multiple clicks, repeat visits, video watches, form fills)?
Show me ABM campaign performance broken down by segment – SMB, mid-market, and enterprise.
For our C-suite ABM campaign, which companies and titles engaged the most, and which turned into opportunities?
Compare our top 3 ABM campaigns side by side – metrics, engaged companies, pipeline influenced, and cost per engaged account.
Which ABM campaigns performed well on engagement but poorly on pipeline influence – and vice versa?
Show me ABM campaign performance month-over-month and highlight any campaigns with significant improvement or drop-off.
For {Campaign X}, show the full funnel view: impressions → clicks → engaged companies → opportunities → closed-won.
Which ABM campaigns are driving engagement from net new accounts vs existing customers?
Identify ABM campaigns with ‘quiet success’ – low spend but high-quality engagement and pipeline influence.
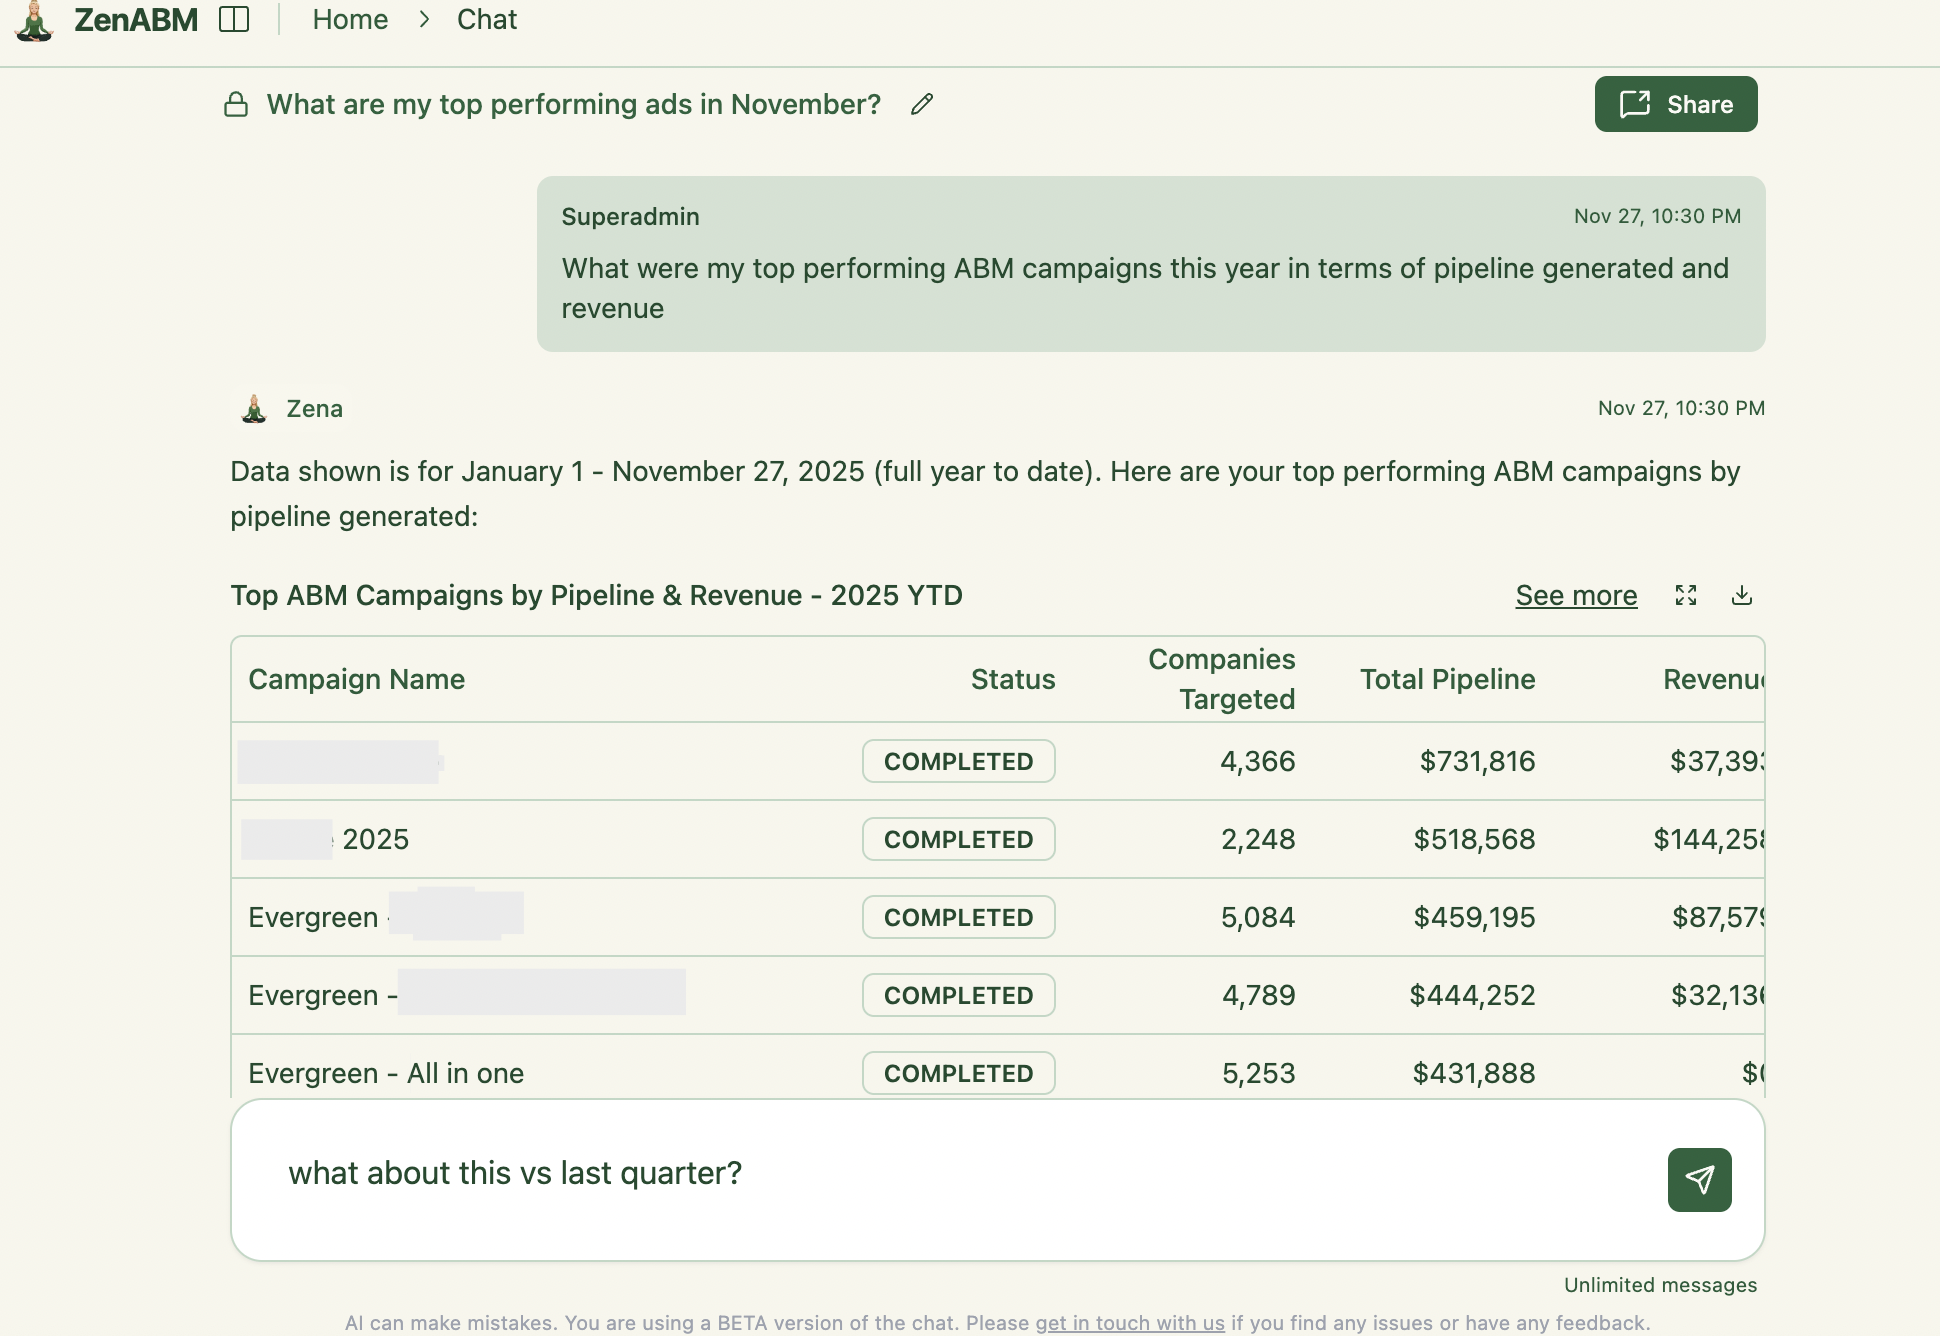
Use these to justify spend and prove ROI of your LinkedIn ad campaigns:
Show me all opportunities influenced by LinkedIn Ads in the last 90 days – with campaign and company mapping.
How much pipeline and revenue did LinkedIn Ads influence this quarter, and which campaigns contributed the most?
Which accounts went from ‘not engaged’ to ‘opportunity’ after interacting with our ads? Show the touch path.
What percentage of our closed-won revenue in the last 6 months was influenced by LinkedIn Ads or ABM campaigns?
Which campaigns show the highest ratio of influenced pipeline to spend?
Identify deals that were heavily engaged with ads but ended up lost – what patterns do you see?
For deals closing this quarter, show which ads and campaigns they interacted with before becoming opportunities.
Rank campaigns by cost per influenced opportunity and cost per influenced closed-won deal.
Are there any campaigns that are generating a lot of engagement but almost no influenced pipeline? List them and explain.
Show me a quarter-over-quarter trend of ad-influenced pipeline and revenue. Are we getting better or worse?

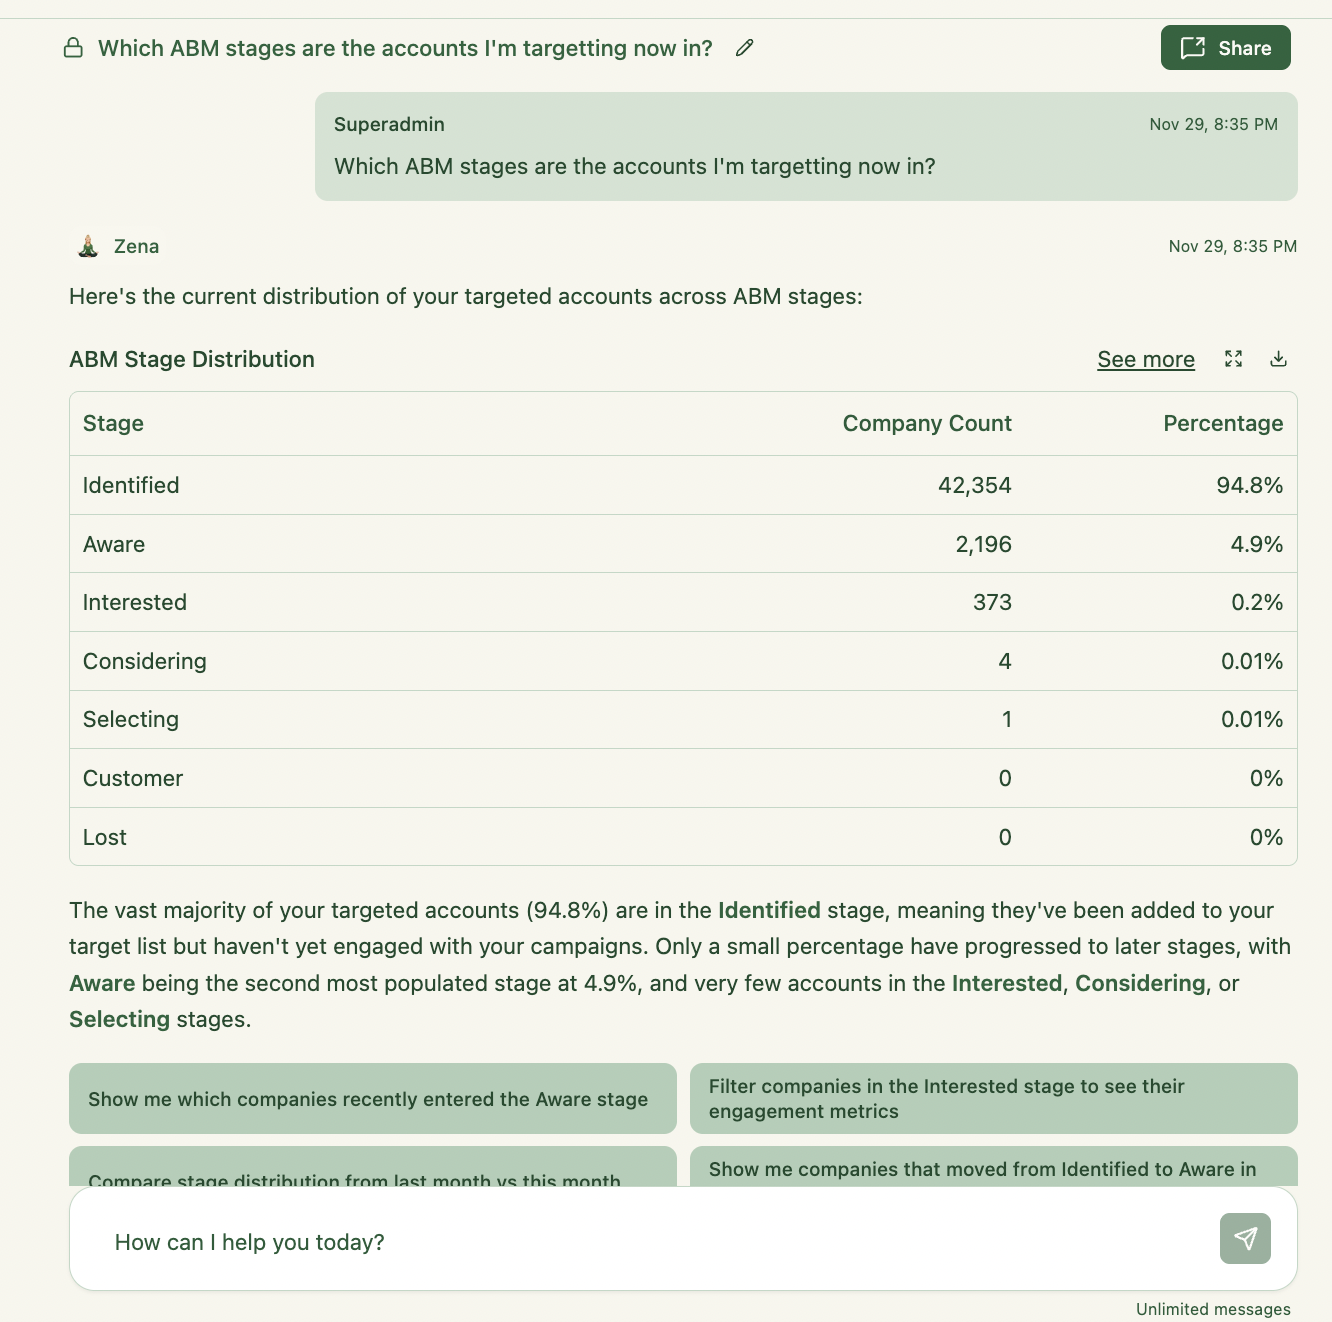
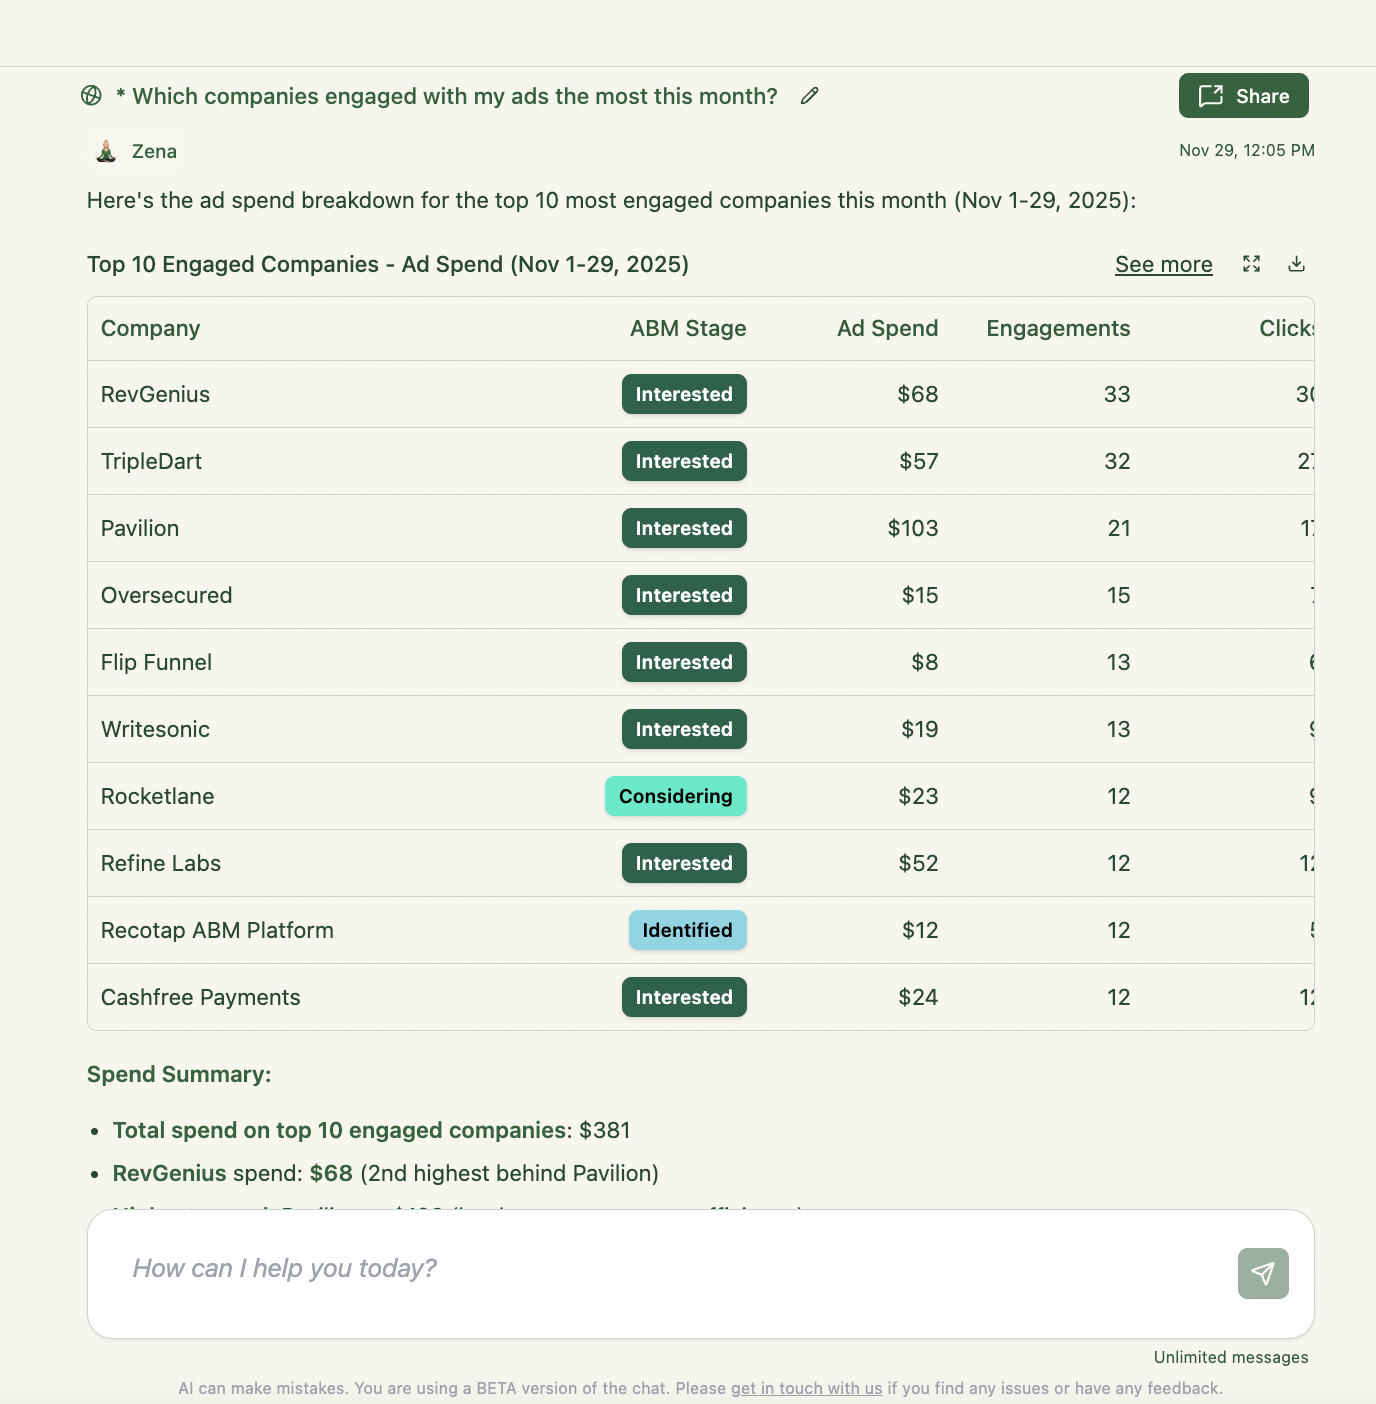
Zena’s superpower: de-anonymised, company-level insights. Ask these questions to uncover engagements in your target accounts – and how they’ve been moving through the funnel:
List my top 50 engaged companies this month – with impressions, clicks, CTR, and current funnel stage.
Which companies have the highest engagement but no open opportunities in the CRM?
Show me how {Company X} interacted with our ads over time – campaigns, formats, and click history.
Which companies have increased their engagement the most compared to last month?
Which high-value target accounts (by ACV) are engaging but haven’t been contacted by Sales yet?
Segment my top engaged companies by industry and show which industries respond best to our ABM campaigns.
Which companies have high engagement across multiple campaigns, indicating multi-threaded interest?
Show companies where we’ve spent the most budget but seen little or no movement in funnel stage.
Identify ‘sleeping giants’ – companies with strong historical engagement that have gone quiet in the last 60 days.
For my Tier 1 account list, show who is actually engaging with ads and who isn’t – and suggest next steps.
These prompts are perfect for persona-level insights and targeting decisions:
Which job titles are engaging most with our ads this quarter? Rank by clicks and CTR.
Break down engagement by seniority (IC, Manager, Director, VP, C-level) and show which seniorities interact most.
In {Campaign X}, which personas (job titles) overperform and underperform vs the campaign average?
Are we seeing engagement from our ideal ICP titles, or mostly from adjacent roles? Show percentages.
Which job titles most often appear in deals that were influenced by LinkedIn Ads?
Compare engagement between Product, Marketing, Sales, and CS personas – who’s most responsive to our messaging?
Highlight any job titles that are unexpectedly highly engaged and might be a good new ICP to target.
For enterprise accounts, which seniorities engage most – ICs or executives? How does that compare to mid-market?
Which job titles show repeated engagement (multiple clicks, multiple campaigns) but no Sales follow-up in CRM?
Give me ICP insights: which combination of job title + seniority + company size gives the best engagement and pipeline conversion.
Zooming out to the channel + Linkedin ad campaign layer.
Compare LinkedIn performance this quarter vs last quarter – spend, CPC, CTR, engaged companies, and influenced pipeline.
How do brand awareness campaigns perform compared to direct response / lead gen campaigns on LinkedIn?
Which campaigns have the best balance of low CPC, good CTR, and strong company-level engagement?
Which campaigns struggle with impressions but perform well with those who do see them (high CTR, high intent)?
Show me campaigns where engagement is declining over the last 60 days – likely fatigue.
Which campaigns are best at creating first-touch engagement with net new accounts?
Which campaigns are strongest at re-engaging existing opportunities or customers?
Compare campaign performance across regions (e.g., EMEA vs North America) – who responds best?
Which campaigns are driving the most engagement at the lowest cost per engaged company?
Group my campaigns by objective and rank them by pipeline influenced per dollar spent.
Now we go down to the individual ad level:
Which individual ads had the highest CTR in the last 30 days? Show copy and format.
Which ads drove the most engaged companies (not just clicks)?
Identify ads with high spend but weak performance – low CTR or low engaged companies.
Which ads were most involved in journeys that led to opportunities or closed-won deals?
Show me ads that perform best in enterprise accounts only.
Rank ads by cost per engaged company and cost per influenced opportunity.
Which ads are repeatedly clicked by the same companies – indicating strong interest?
Show me the top 10 ads by engagement for executive-level titles only.
Which ads work well on mobile vs desktop (if available) – any performance differences?
Identify creative patterns in our best-performing ads – messaging, format, or offer trends.
For CFO-friendly views and budget defence.
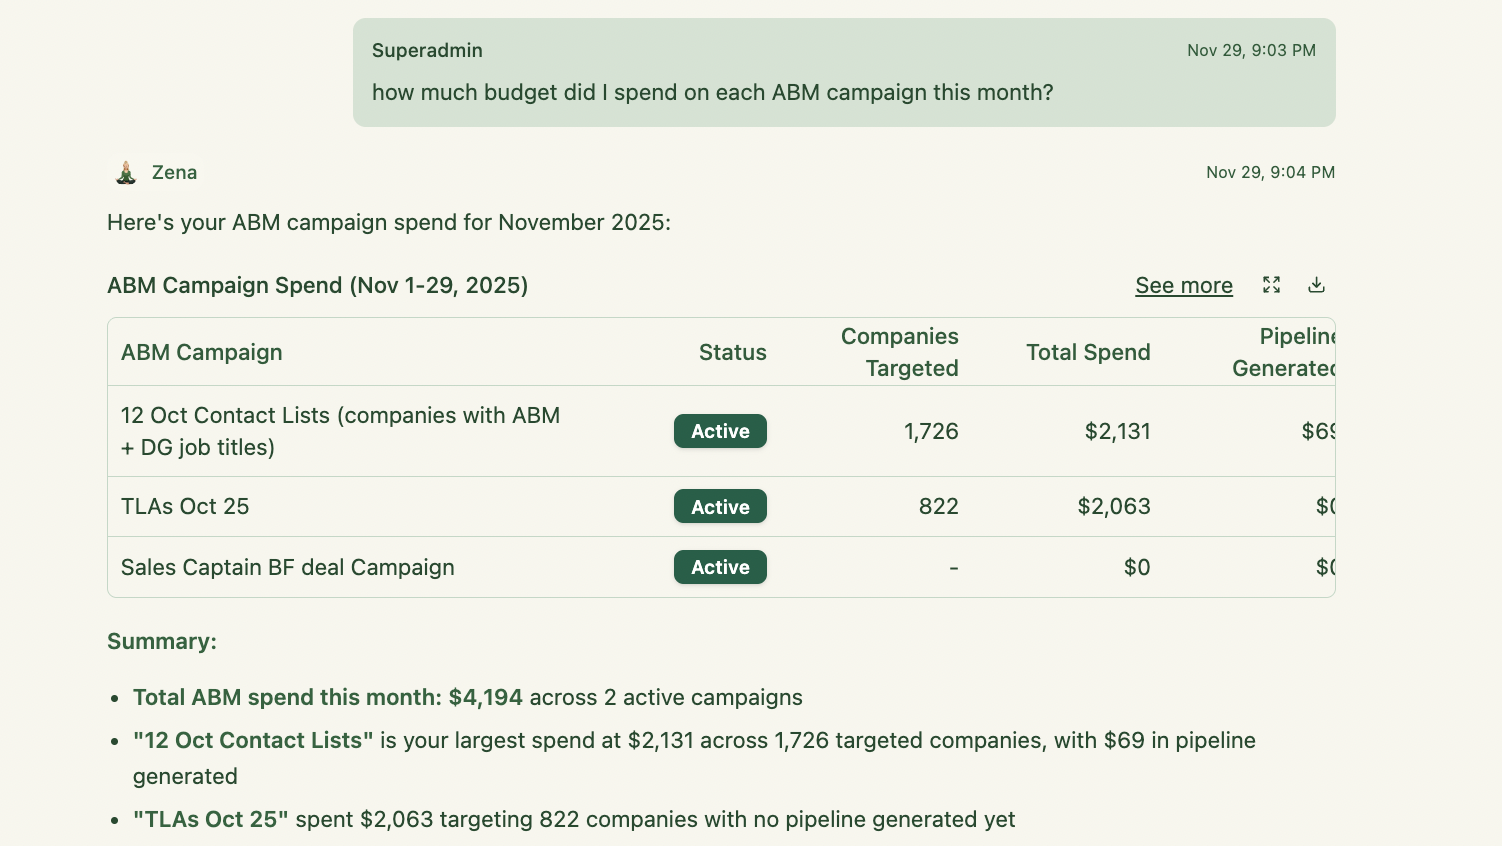
Break down our LinkedIn spend by campaign and show cost per click, cost per engaged company, and cost per influenced opportunity.
Which campaigns have the highest ROI when you factor in pipeline influenced and closed-won revenue?
Where are we overspending – high spend, low engagement, and little pipeline influence?
If we had to cut 30% of our LinkedIn budget, which 3 campaigns or segments should we pause first based on performance?
If we increased spend by 20%, which campaigns should we scale to maximise engaged accounts and pipeline?
Which companies have the highest lifetime ad spend from us, and what did we get in return (opportunities, deals, revenue)?
Show spend distribution between brand campaigns vs ABM campaigns – and which side drives more pipeline.
Calculate my blended cost per engaged company and cost per influenced opportunity across all LinkedIn campaigns last quarter.
Identify ‘hidden efficient’ campaigns – low spend but strong engagement and decent pipeline influence.
Are there any campaigns where cost per engaged company is increasing over time? Flag them and suggest possible reasons.
This is where Zena becomes your AI performance strategist – giving you insights into how to optimize your ABM campaign budet:
Based on our current data, what are the top 5 things we should do to improve LinkedIn performance next month?
Which campaigns should we scale, tweak, or pause based on engagement, efficiency, and pipeline impact? Give clear recommendations.
Which accounts should Sales prioritise for outreach this week based on recent high-intent engagement?
Which job titles should we refine, exclude, or double down on in targeting based on engagement and pipeline conversion?
Suggest new ABM campaign ideas based on the personas and industries that are engaging most.
Identify under-engaged Tier 1 accounts and suggest how we could better reach them (formats, messaging, or offers).
Which ads should we A/B test – and what variations (headline, visual, CTA) would you recommend based on past performance?
Show me where in the funnel we’re losing engaged companies – are they not converting to opportunities? Why?
What signals should we send to Sales weekly from LinkedIn & ABM campaigns to maximise follow-up impact?
Give me a 90-day optimisation plan for LinkedIn Ads based on our current performance data.
For decks, MBRs/QBRs, and async communication.
Generate a monthly LinkedIn Ads + ABM performance report for leadership, including key charts and bullet-point insights.
Create a QBR-style narrative explaining how LinkedIn and ABM contributed to revenue this quarter.
Write an email summary for Sales on the top 50 engaged accounts and how they interacted with our ads.
Generate a slide outline for a ‘State of Our LinkedIn & ABM’ presentation.
Create a comparison report: LinkedIn Ads performance vs last quarter – highlight wins, losses, and learnings.
Give me a report ranking campaigns, ads, and job titles by their impact on pipeline and revenue.
Generate a weekly “hit list” of accounts for SDRs – with context on their engagement and suggested talking points.
Write a short narrative I can use to justify our LinkedIn budget to Finance based on performance and influenced revenue.
Create a dashboard-style summary I can paste into Notion: campaigns, engaged companies, pipeline, and key trends.
Summarise everything you’re seeing into a 10-point LinkedIn & ABM strategy recommendation for the next quarter.
Why should you try Zena by ZenABM?
Zena (by ZenABM.com) is essentially your LinkedIn Ads AI analyst available 24/7. Instead of looking at static dashboards, Zena lets you ask open-ended questions. It’s an intuitive chat built on top of OpenAI API with dozens of thought-through prompts and endpoints, that knows exactly how to analyze and de-anonymize your LinkedIn ad data.
Once you’ve connected your LinkedIn ads to ZenABM Zena will be able to answer any questions about your LinkedIn ads showing you which companies are interacting with your ads, how your campaigns and ads are performing, and how much you’ve spent on them in total + how much you’ve spent on each individual company in any time period.
Once you’ve also connected your CRM (Hubspot, Salesforce) to ZenABM – Zena will also be able to link your company-level ad engagements to specific companies and deals in your CRM, and will thus be able to answer questions about your LinkedIn-ad influenced pipeline and revenue. Zena will give you a glimpse into what’s happening in your sales funnel.
For example: you can ask, “Which of our campaigns generated the most pipeline this quarter?” or “Who are the top companies clicking our image ads?” – and Zena will comb through the LinkedIn Ads API and CRM data to give you human-friendly answers. This means you spend less time exporting spreadsheets and more time acting on real intelligence.
We are live on Product Hunt with Zena today – so please give us a “thumbs up” there if you think this is a good idea ;))
Manual LinkedIn Ads analysis is slow – Zena lets you chat with your LinkedIn + CRM data to instantly see company-level engagement, pipeline influence, and performance insights.
You can ask Zena anything about your ads, ABM campaigns, spend, or deals – she returns human-friendly analysis, ROI metrics, and top engaged accounts in minutes.
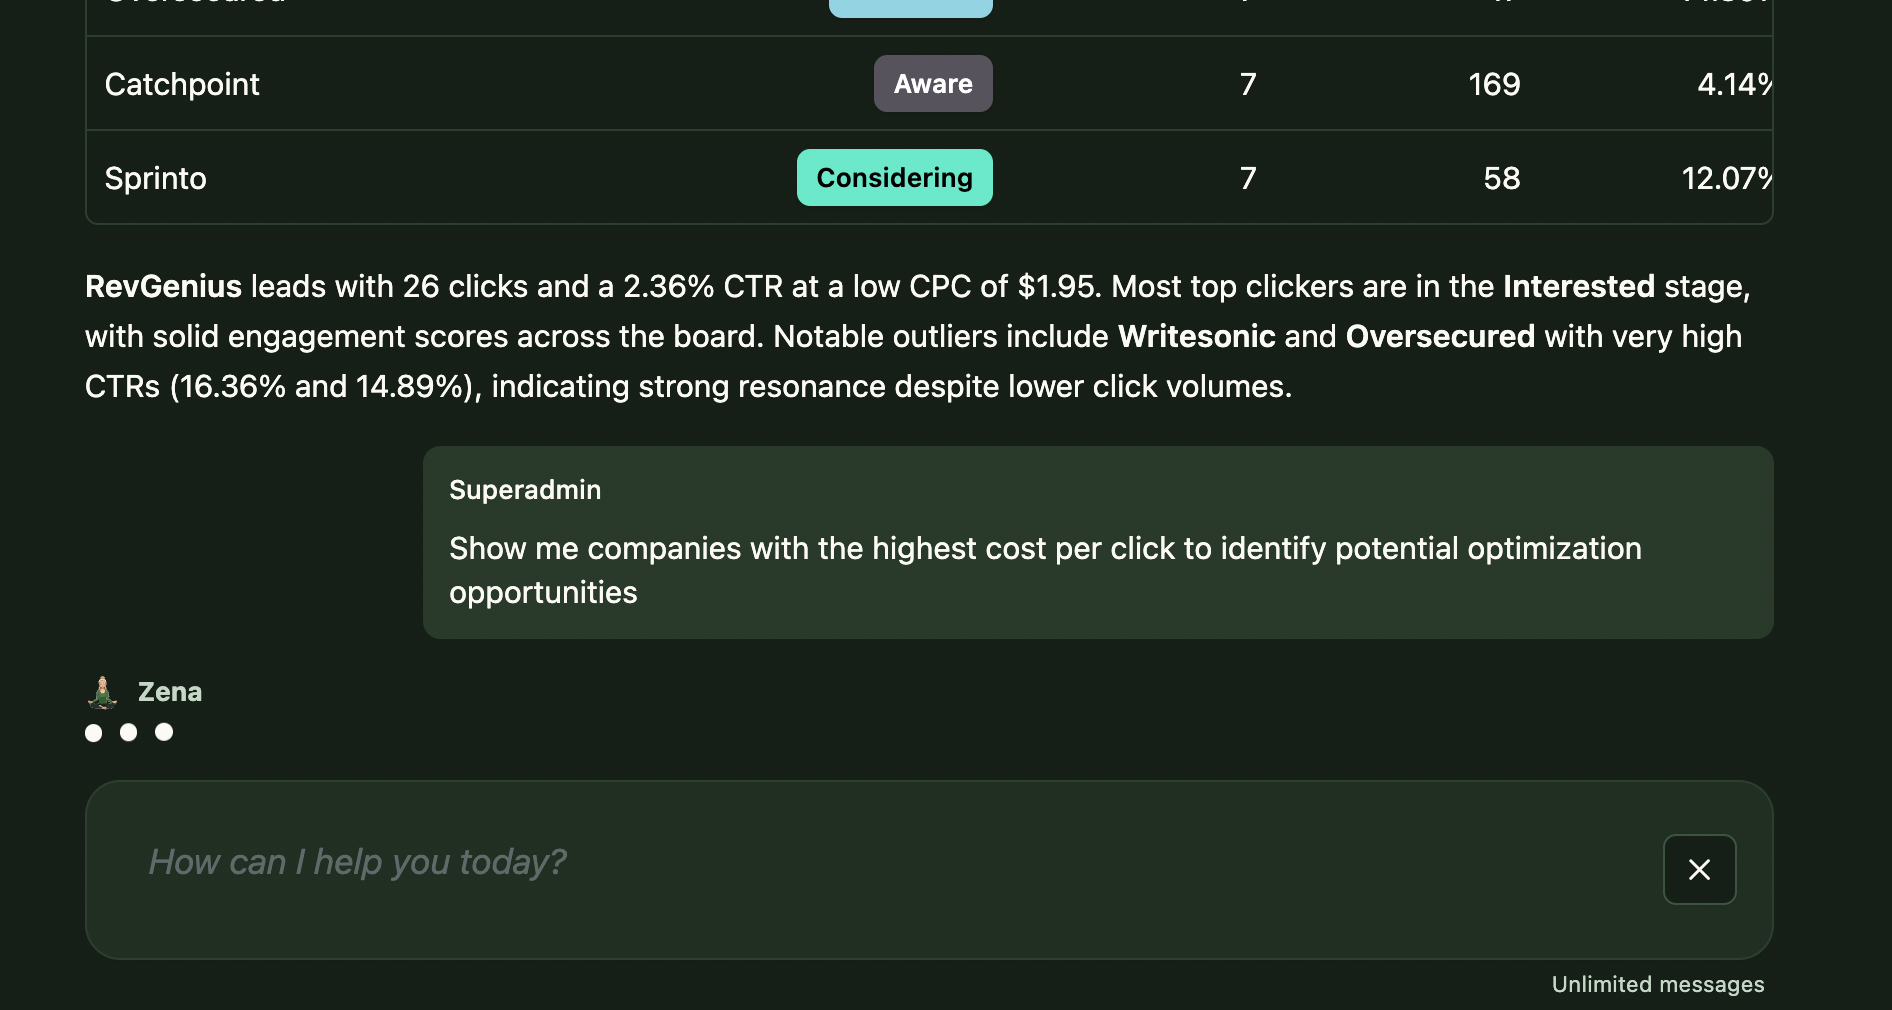
Zena de-anonymizes which companies clicked, viewed, or engaged with your ads and shows how they progressed through your ABM funnel.
She identifies high-intent accounts and highlights which companies are ready for outreach or missing from CRM activity.
Zena ranks your top-performing LinkedIn and ABM campaigns by engagement, pipeline, revenue, CTR, or ROI, and compares campaigns side-by-side.
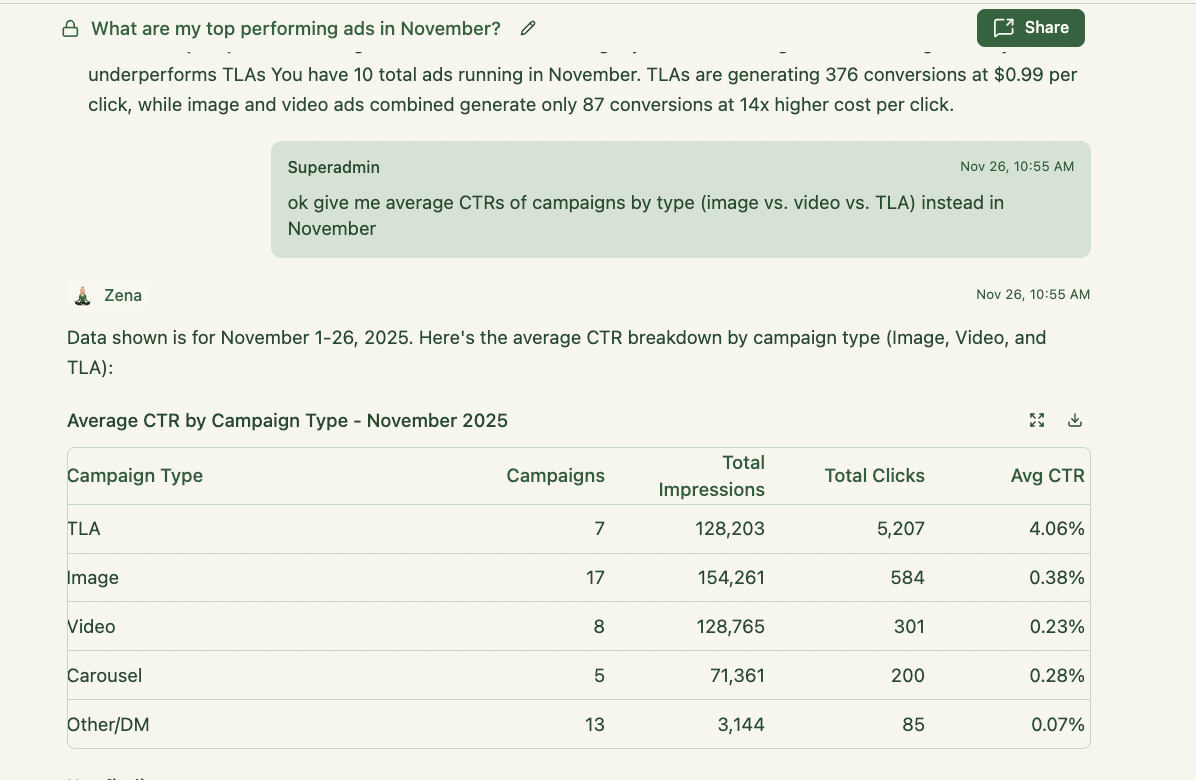
She analyzes ad formats (image, video, carousel, TLA) to show which creatives and formats drive the best engagement and pipeline.
Zena breaks down engagement by job title/seniority so you can target the right personas and exclude wasted spend.
You get transparent ad spend insights – including spend per campaign and per company – to optimize budget allocation.
Zena generates full LinkedIn Ads or ABM performance reports instantly (weekly, monthly, exec summaries, comparisons).
Pricing starts at $59/mo with 10 free trial chats to test everything.