If you don’t want to DIY a complex LinkedIn ad analytics dashboard like the one below and still end up with skewed reports because your CRM is blind to view-through attribution and cookies always betray you (thus, failing at accurate click-through attribution too), you are at the right place.
ZenABM gives a plug-and-play, complete view-through LinkedIn ad analytics dashboard for B2B marketing with clear revenue attribution for each specific campaign and campaign group with complete accuracy because LinkedIn’s own API is the source and not cookies.
Let me explain how I suffered and found the fix.
LinkedIn reporting is messy. Buying committees mean one person sees, another clicks, and a third converts. With LinkedIn’s premium CPMs, blind spots are costly. Native reports and CRMs fixate on clicks and last-touch, hiding true influence. People see your ads, don’t click, and then convert elsewhere. Your analytics miss the connection.
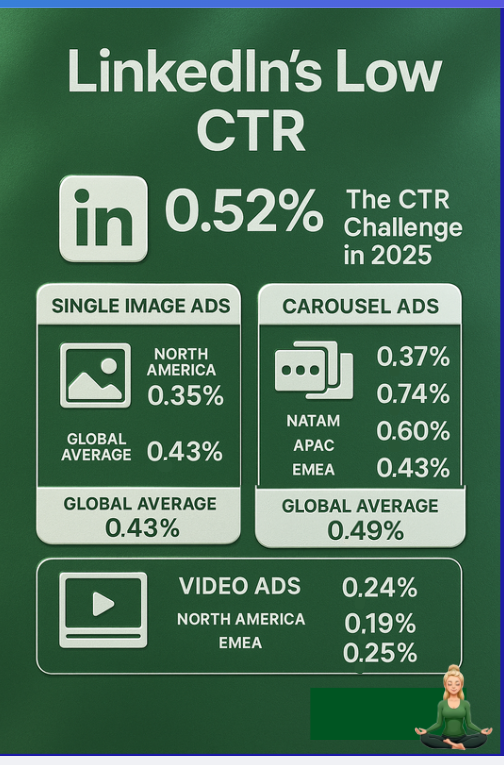
I learned this the hard way: a “zero-form-fill” campaign influenced multiple deals. Defaults called it a failure. You target 50 dream accounts; they notice, maybe like or share internally; no clicks. A month later, demos roll in. Not a coincidence. Just invisible. And CTR doesn’t capture B2B value. A 0.5% CTR means 99.5% won’t click.
Does that mean your ad failed?
Or did it plant a seed?
Without the right analytics, you won’t know. Paying premium, flying blind, and being stuck with vanity metrics is maddening.
In search of answers, I tried CRMs, LinkedIn’s native tools, and visitor ID hacks.
Each left gaps:
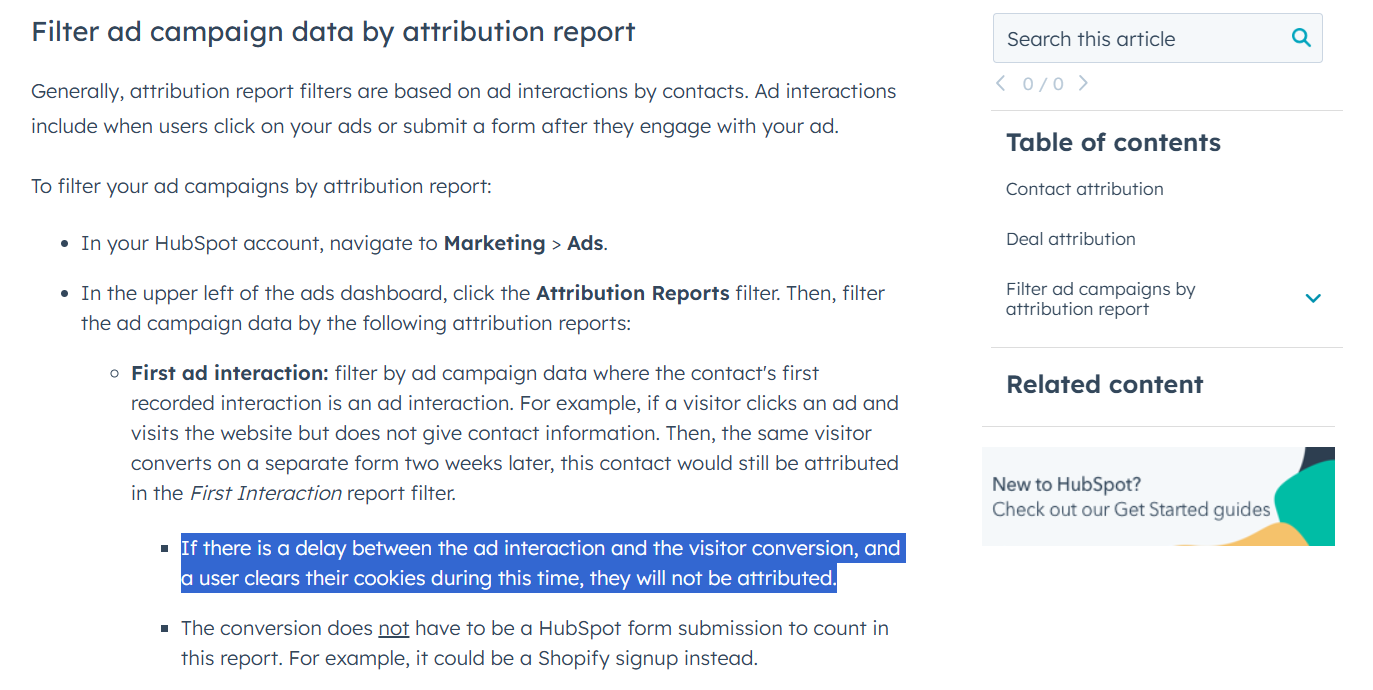
That’s rare on LinkedIn. If someone clicks, then converts later—or never clicks—CRMs miss it. Net: deaf to view-through; still click-centric while LinkedIn engagement often happens without clicks.
By now, my wish list was clear:
Tall order? Yes. But I found a solution that checked every box and ended up helping build it.
Tired of the status quo, we built ZenABM to fix LinkedIn reporting.
I’ll spare the suspense: it delivers the entire wish list and more.
Here’s how:
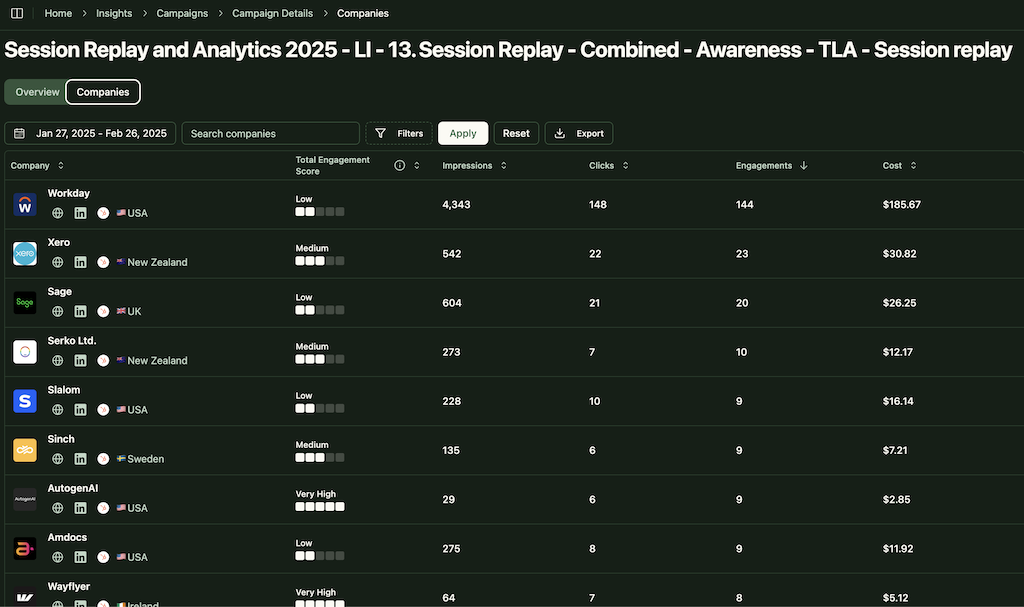
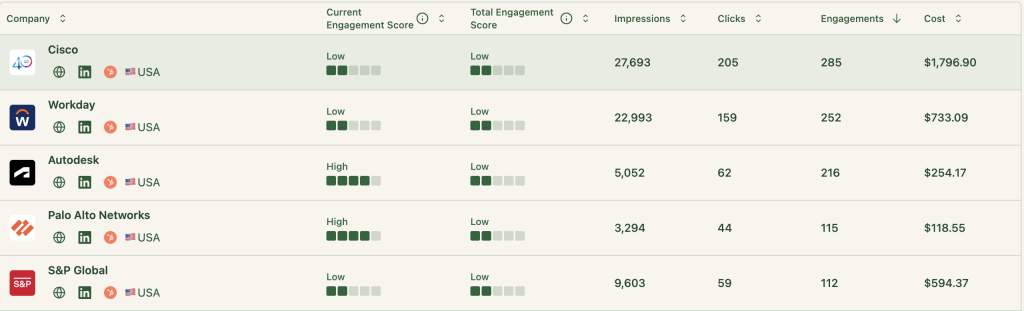
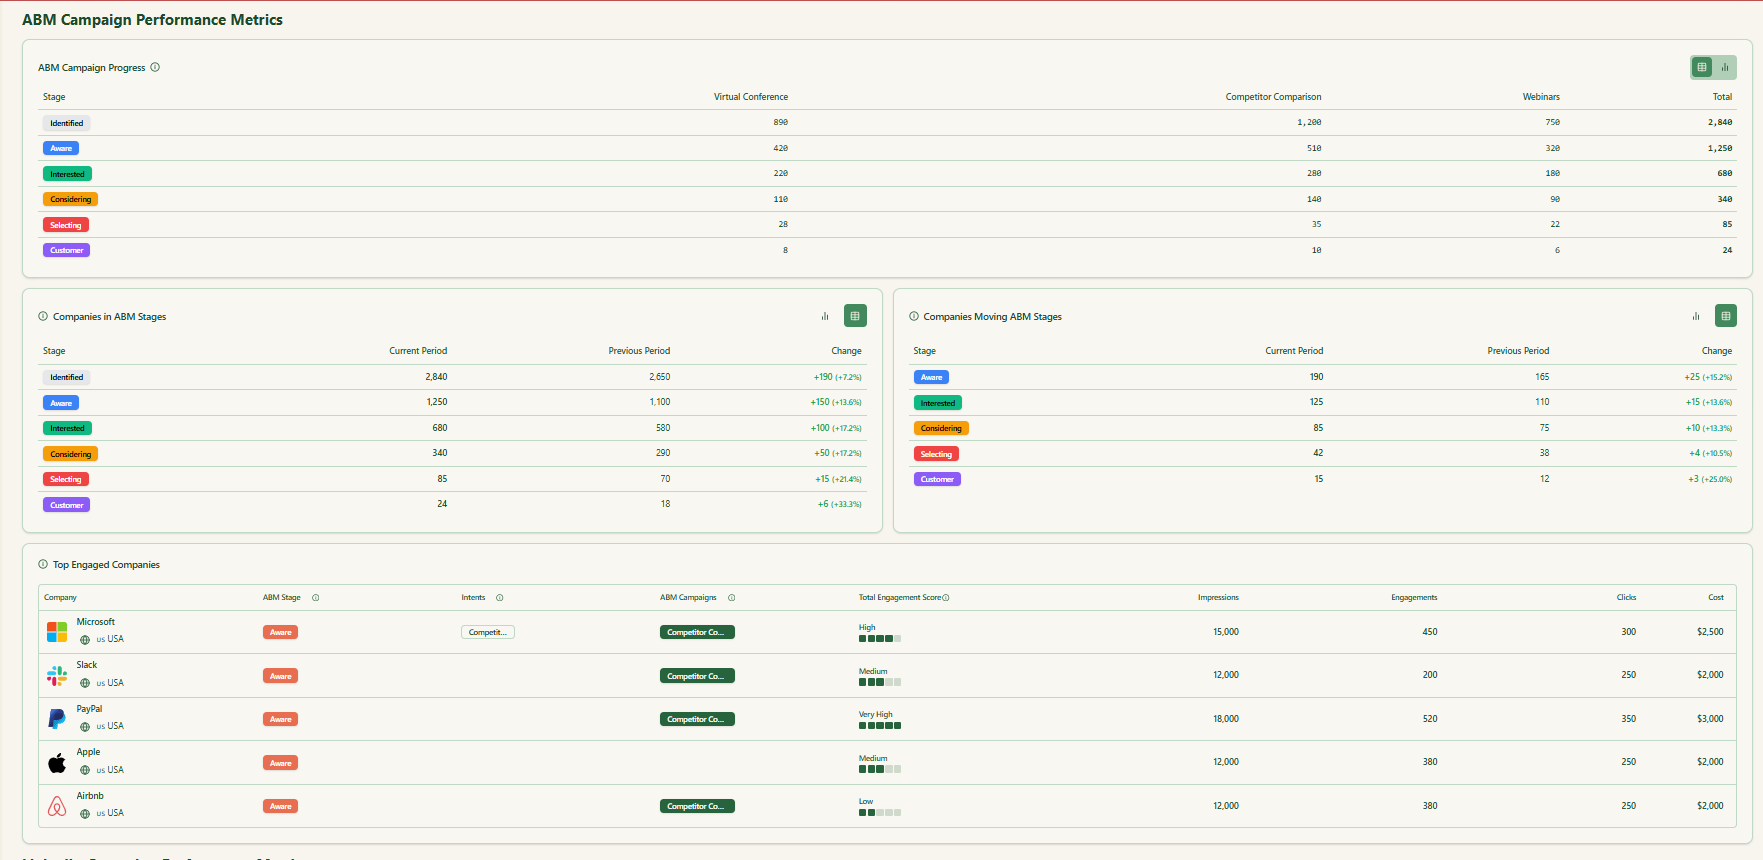
ZenABM pinpoints top-engaged companies per LinkedIn campaign (impressions, clicks, engagements, spend, CRM pipeline, even BDR owner), so I see which accounts (e.g., Microsoft, Slack) moved and how far, in one view.
ZenABM records every company that sees or interacts with ads, clicks or not. If Company XYZ saw five times, never clicked, then later requested a demo, ZenABM connects it. I see 50 impressions, 2 engagements, and a stage change. Upper-funnel campaigns finally get credit; I track real account-level reach, not just clicks.
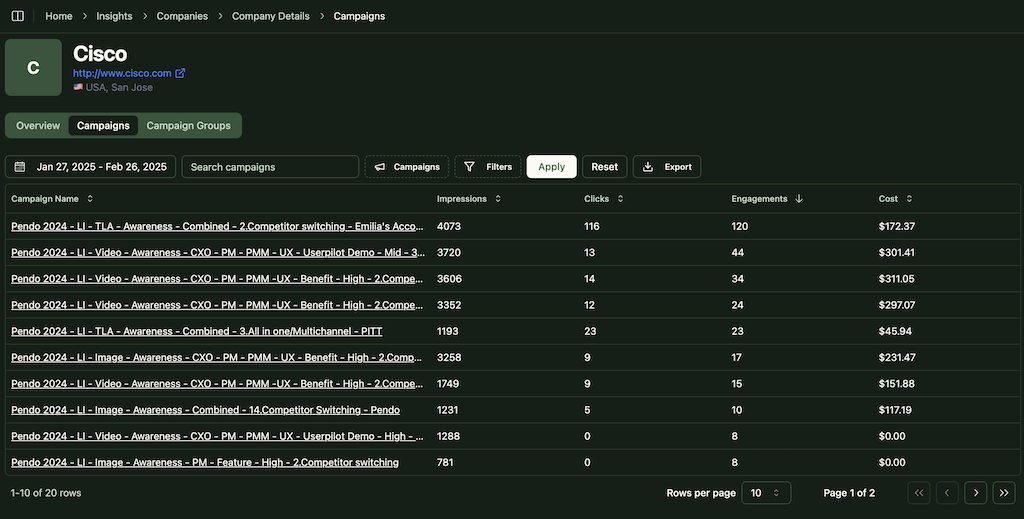
ZenABM shows each account’s journey: saw Campaign A, engaged with B, clicked C pre-deal, automatically. Engagement breaks down by campaign/company. Attribution spreads fairly across campaigns, exposing “assist” programs that warm accounts before the final offer. Goodbye, last-click bias.
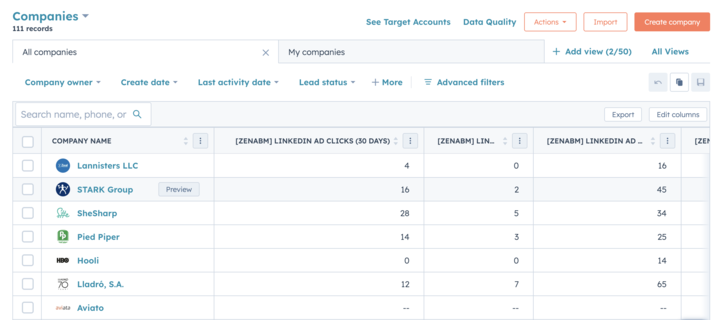
ZenABM writes LinkedIn metrics to company properties in HubSpot (e.g., “Impressions – Campaign A, last 7 days”). No exports; daily updates. Now, CRM dashboards and workflows run on LinkedIn engagement. BDRs prioritize accounts with>20 engagements, and alerts route hot accounts automatically. Form fill or not, LinkedIn fuels the pipeline.
ZenABM scores accounts in real time by recency, frequency, and interaction type. Tags by theme (feature, use case, pain) surface intent, so sales knows what to talk about before the call. Thresholds auto-assign owners or trigger outreach. It’s an early-warning system for buying intent.
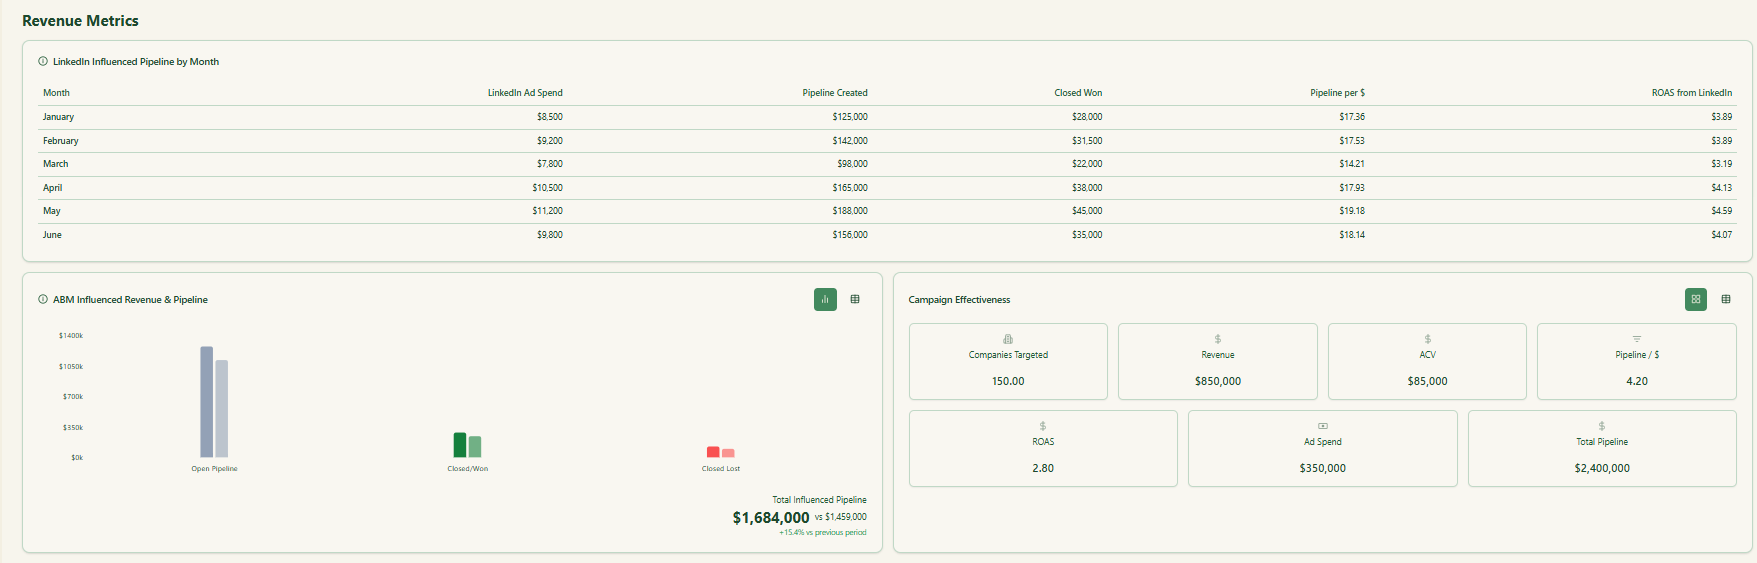
ZenABM maps account-level ad engagement to CRM opportunities. Dashboards show pipeline influenced and revenue won by campaign, plus Pipeline-per-$ and ROAS. What used to be guesswork is now continuous reporting leadership trusts.
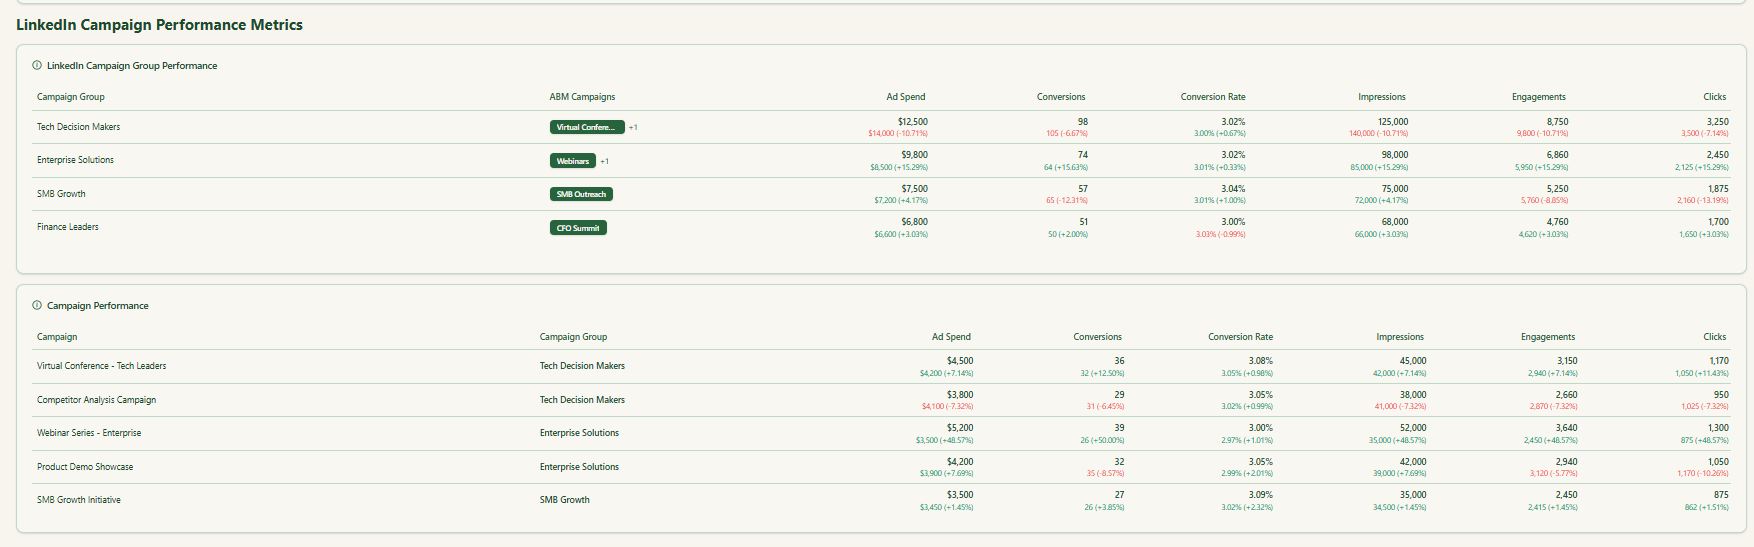
Connect LinkedIn + HubSpot and go. Prebuilt charts—impressions vs. engagement, top accounts, funnel progression, pipeline influence, ROAS—update on schedule. I spend time optimizing (shift budget from low-engagement creative; double down on high-engagement account ratio), not wrangling CSVs.
ZenABM uses LinkedIn’s official API: no scraping, no risk. Data is compliant, accurate, and durable. My black box became a crystal-clear, account-centric view, the single source of truth for LinkedIn ABM.
LinkedIn used to feel like a leap of faith—high spend, scattered engagement, thin proof. The fix: stop chasing clicks; measure at the account level, include view-through, and tie everything to revenue. Do that, and LinkedIn’s multi-touch influence shows up, and budgeting gets smarter.
Great analytics map impressions, engagements, and clicks to companies, pipeline, and revenue. If your stack can’t, you’re flying blind. ZenABM makes it practical—open the dashboard, see which ads warmed which accounts, and fund what moves the pipeline.
B2B is a long game. LinkedIn plants seeds; the right dashboard claims the credit. For me, that’s ZenABM—less proving ROI, more improving it.