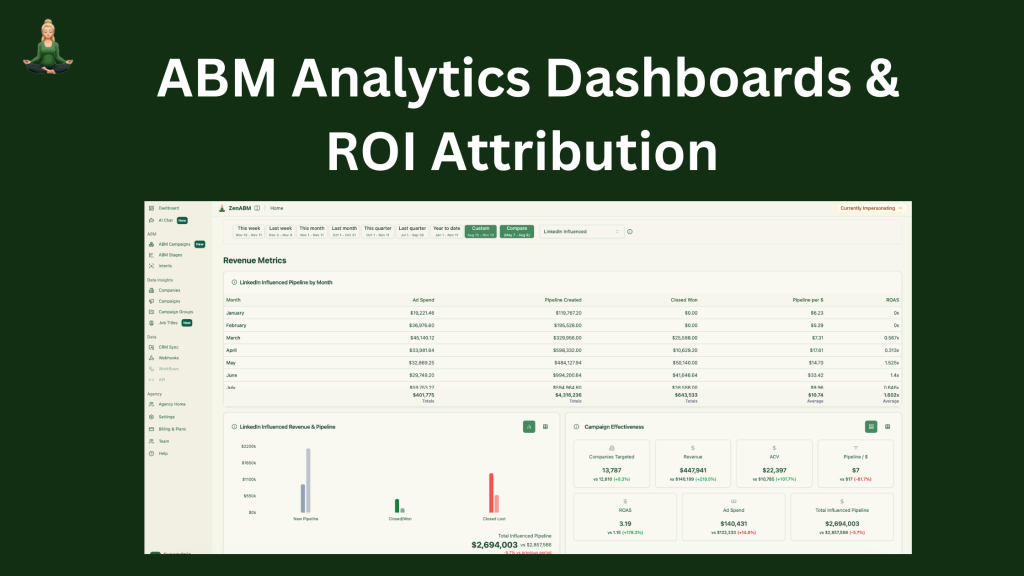
When I first launched ABM campaigns on LinkedIn as the VP of Marketing at Userpilot, I struggled to see which accounts were engaging with our ads and how that translated into pipeline. ZenABM’s ABM Campaign Analytics Dashboards solve that problem by turning your LinkedIn Ads and CRM data into instant reports. In this post, I’ll show you how to use ZenABM’s Analytics Dashboards for ABM ROI Reporting, with some real examples from my experience. (You can also check out our ABM Campaign Analytics Dashboards page to see the features in action.)
Summary – All You Need to Know About ABM Analytics Dashboards and ROI Reporting
In this blog post, I’ll give you a quick overview of how ZenABM’s analytics dashboards and reporting work for LinkedIn ABM campaigns:
- Track account-level ad engagement. See which target companies clicked or viewed your ads and how that engagement trends over time.
- Automated account scoring and funnel stages. ZenABM instantly scores each account and segments them into ABM funnel stages (aware, interested, selecting, customer) based on engagement.
- Real-time CRM sync. All ZenABM ABM metrics (scores, stages, engagement counts, campaign names, etc.) are pushed to your CRM immediately as company properties for your sales team.
- Pipeline and ROI reporting. ZenABM pulls in CRM deal data to calculate influenced pipeline, closed revenue, and return on ad spend (ROAS) for each campaign, in real time.
- Use cases we’ll cover. I’ll explain how this helps marketing and sales teams optimize campaigns, prioritize accounts, and prove ABM ROI to stakeholders.
ABM Dashboard Functionality
From the moment I connect our LinkedIn ad account and CRM, ZenABM auto-populates your company engagement data for the past 90 days.
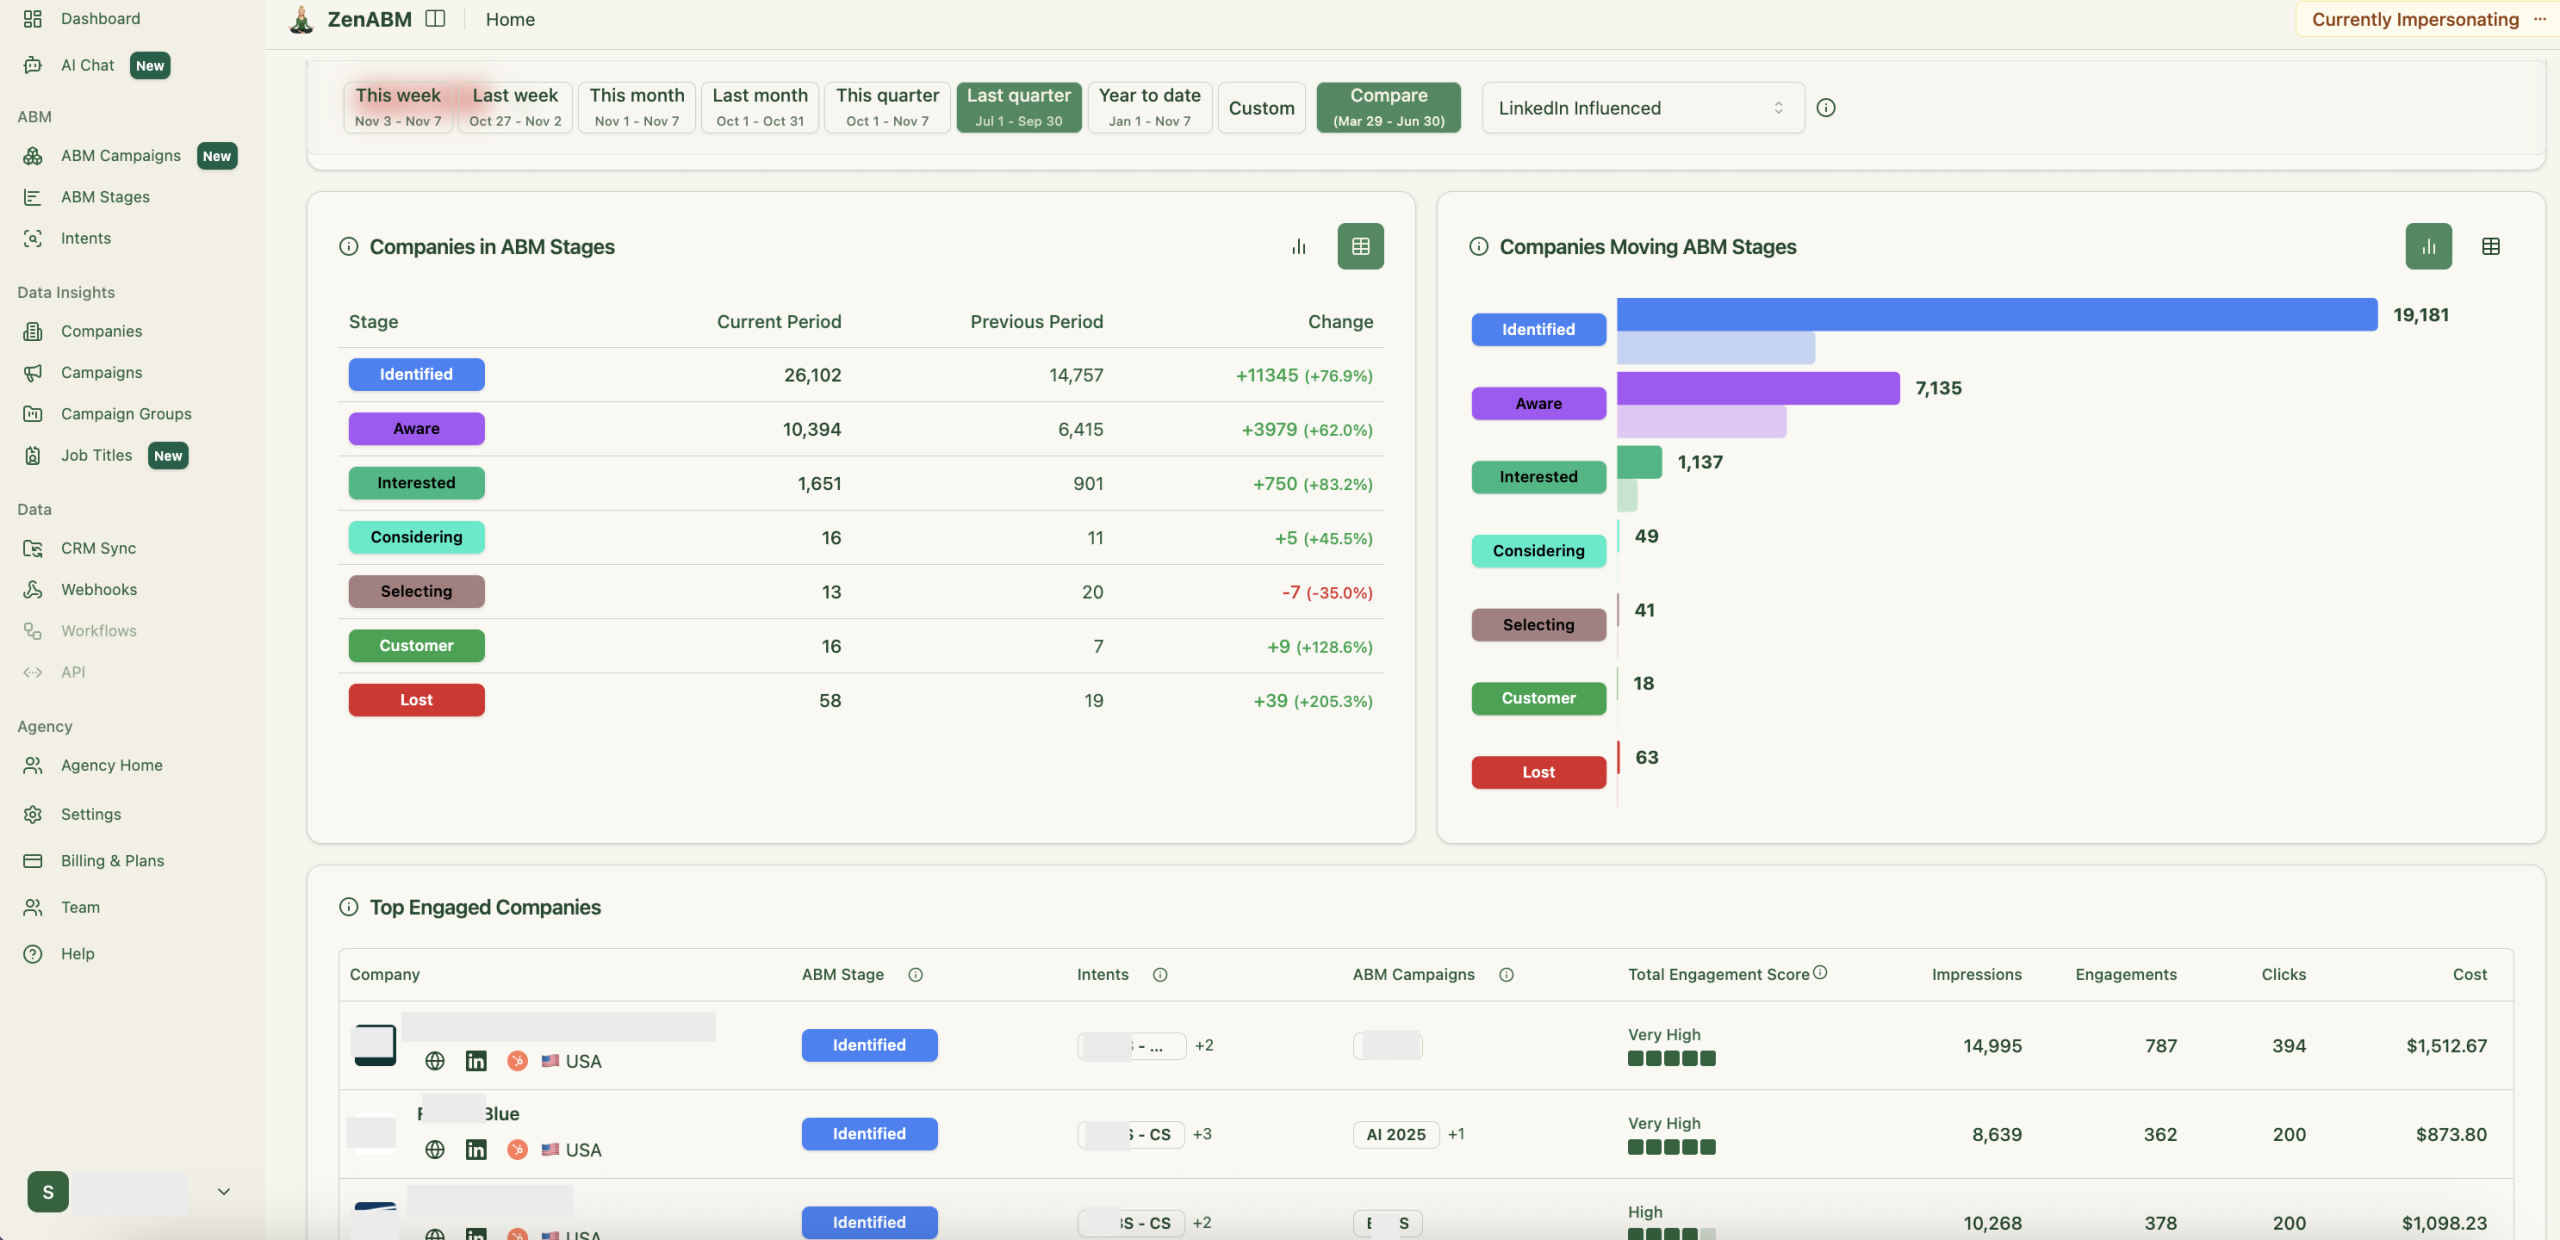
Once you’ve defined your fist ABM cmapaings – it will also automatically create a suite of da for each ABM campaign. These done-for-you dashboards give me an instant view of performance by account. For example, I can see which companies got the most impressions or clicks and which ones generated pipeline. The dashboards summarize key metrics like total impressions, clicks, click-through rate, and even an account engagement score for each target. I no longer wrestle with spreadsheets to cobble this together—ZenABM shows it in minutes.

Each campaign’s dashboard highlights the top engaged accounts. For instance, at Userpilot I noticed that Acme Corp had the highest engagement on a product demo ad. I could immediately drill into how many ad impressions they saw and the total pipeline influenced. The dashboard also shows trends over time – for example, how engagement has grown or waned over the past 30 days versus earlier periods. Since everything links directly to our CRM, the dashboard also notes what stage an account is in. In one glance, I know which accounts are “warming up” and which have booked demos or opened deals thanks to the ads.
ZenABM’s dashboards eliminate the wait for end-of-month reports. You get real-time, filterable views of each ABM campaign. Want to compare campaigns? Switch to the campaign-level view to see side-by-side breakdowns of impressions, clicks, and most importantly pipeline influence. All this data is structured for easy scanning: lists of accounts, bar charts of funnel stages, and summary KPIs. As someone who’s built these reports manually before, I love that it’s all automated and kept up-to-date 24/7.
ZenABM – ABM Campaign Reporting Dashboards & ROI Analytics
ZenABM was built for strategic ABM performance tracking – not just raw LinkedIn ad analytics.
In ZenABM, analytics are centered around ABM campaign objects — meaning you can group multiple LinkedIn campaigns into one ABM initiative and measure funnel performance, account progression, and pipeline attribution per campaign:
The data is processed and stored in-app, giving you custom time-period comparisons (e.g., this quarter vs. last) – unlike Campaign Manager. They also give you deduplicated revenue attribution (so the same deal isn’t counted twice across multiple campaigns).
ZenABM’s AI chatbot also lets you query your data conversationally and uncover insights without manual filtering.
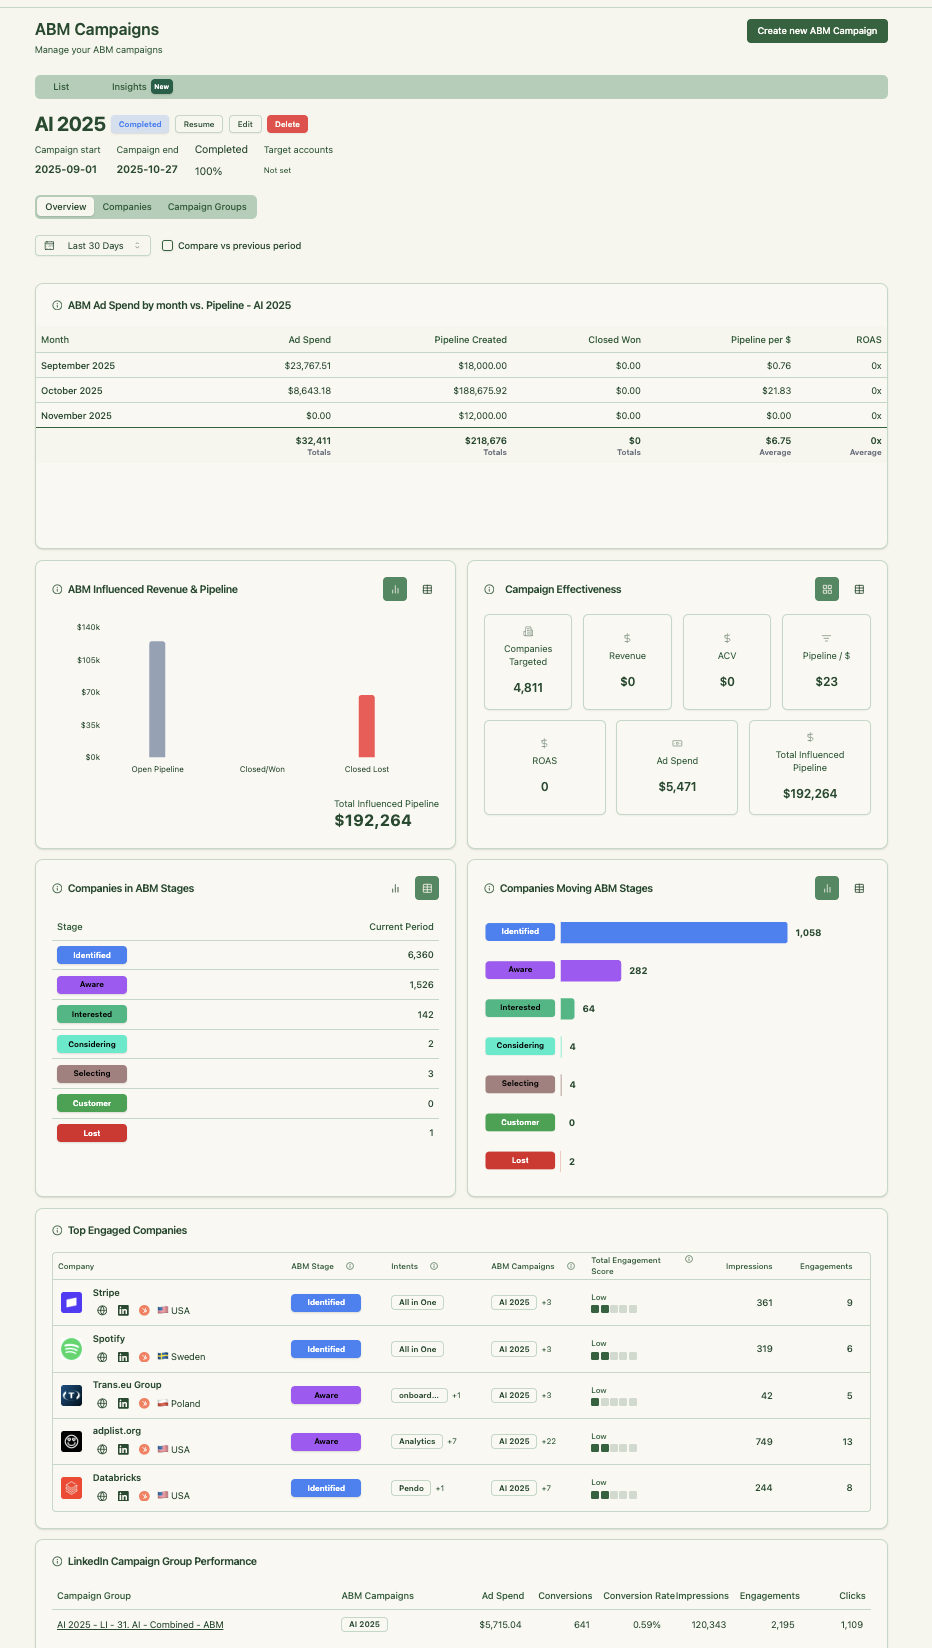
ZenABM also shows you the progression of your accounts between account stages – giving you leading metrics into how your campaigns are performing in terms of moving your target accounts “down the funnel”:
ABM Metrics you can track with ZenABM’s reporting dashboards
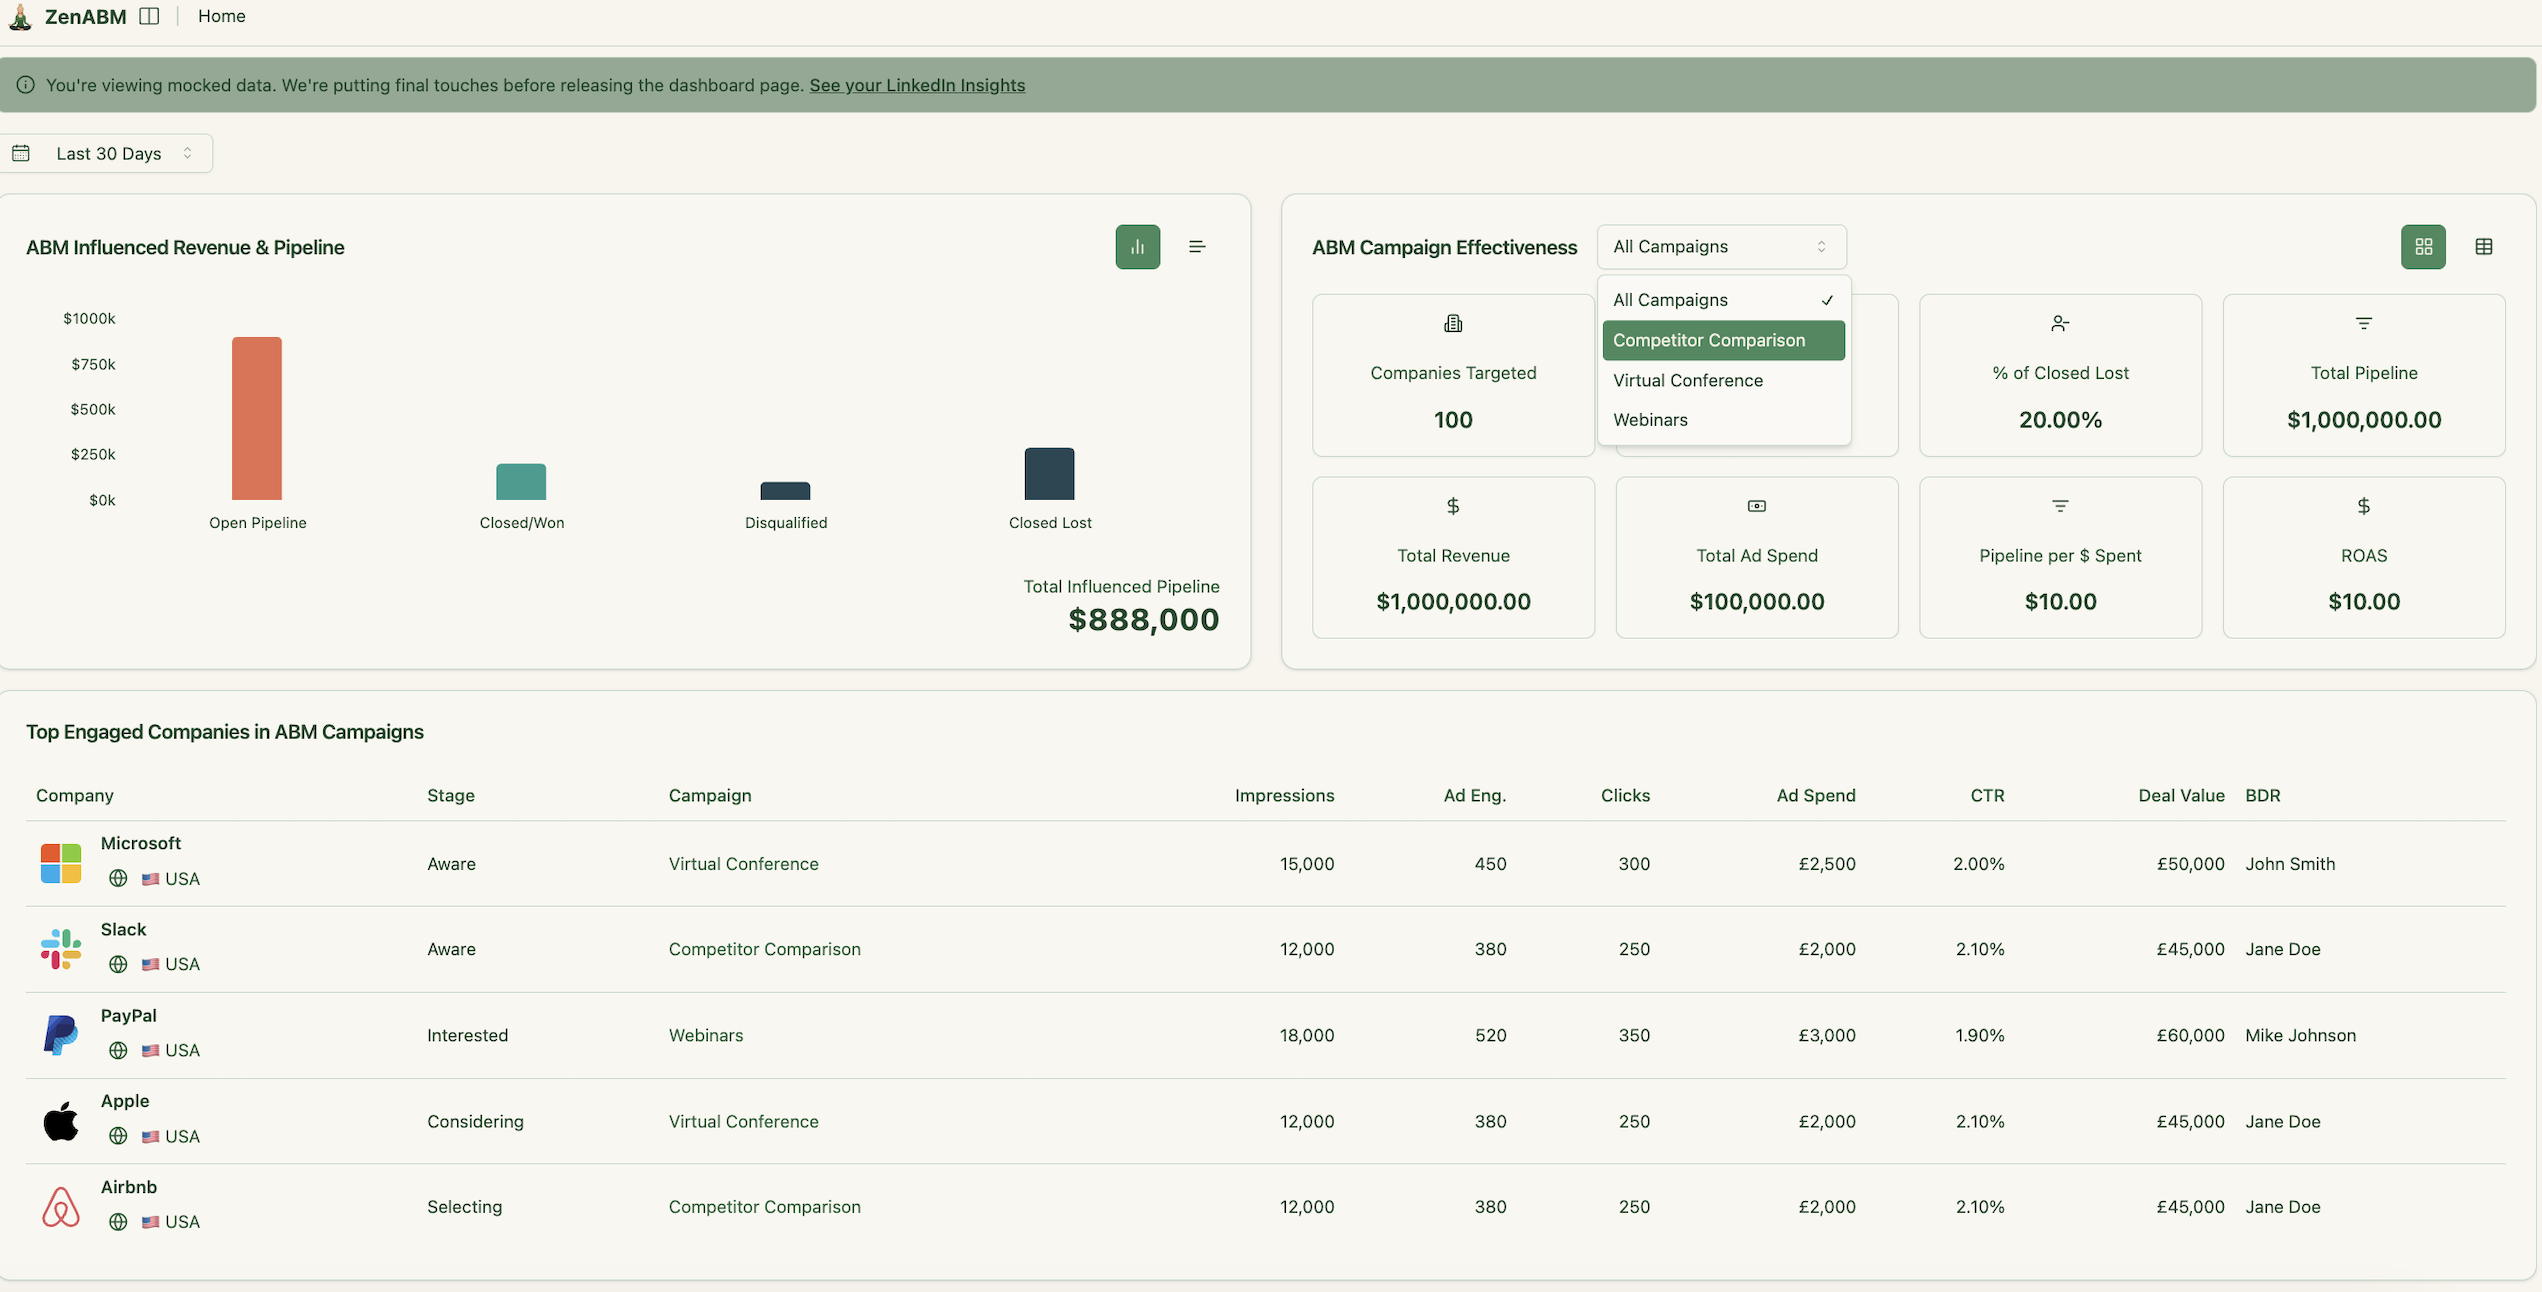
ZenABM’s dashboards go far beyond impressions and clicks: they show pipeline per $ spent, account movement across ABM stages (identified → aware → selecting → won), and ROI by campaign or market segment.
ZenABM allows you to report on the following metrics:
-
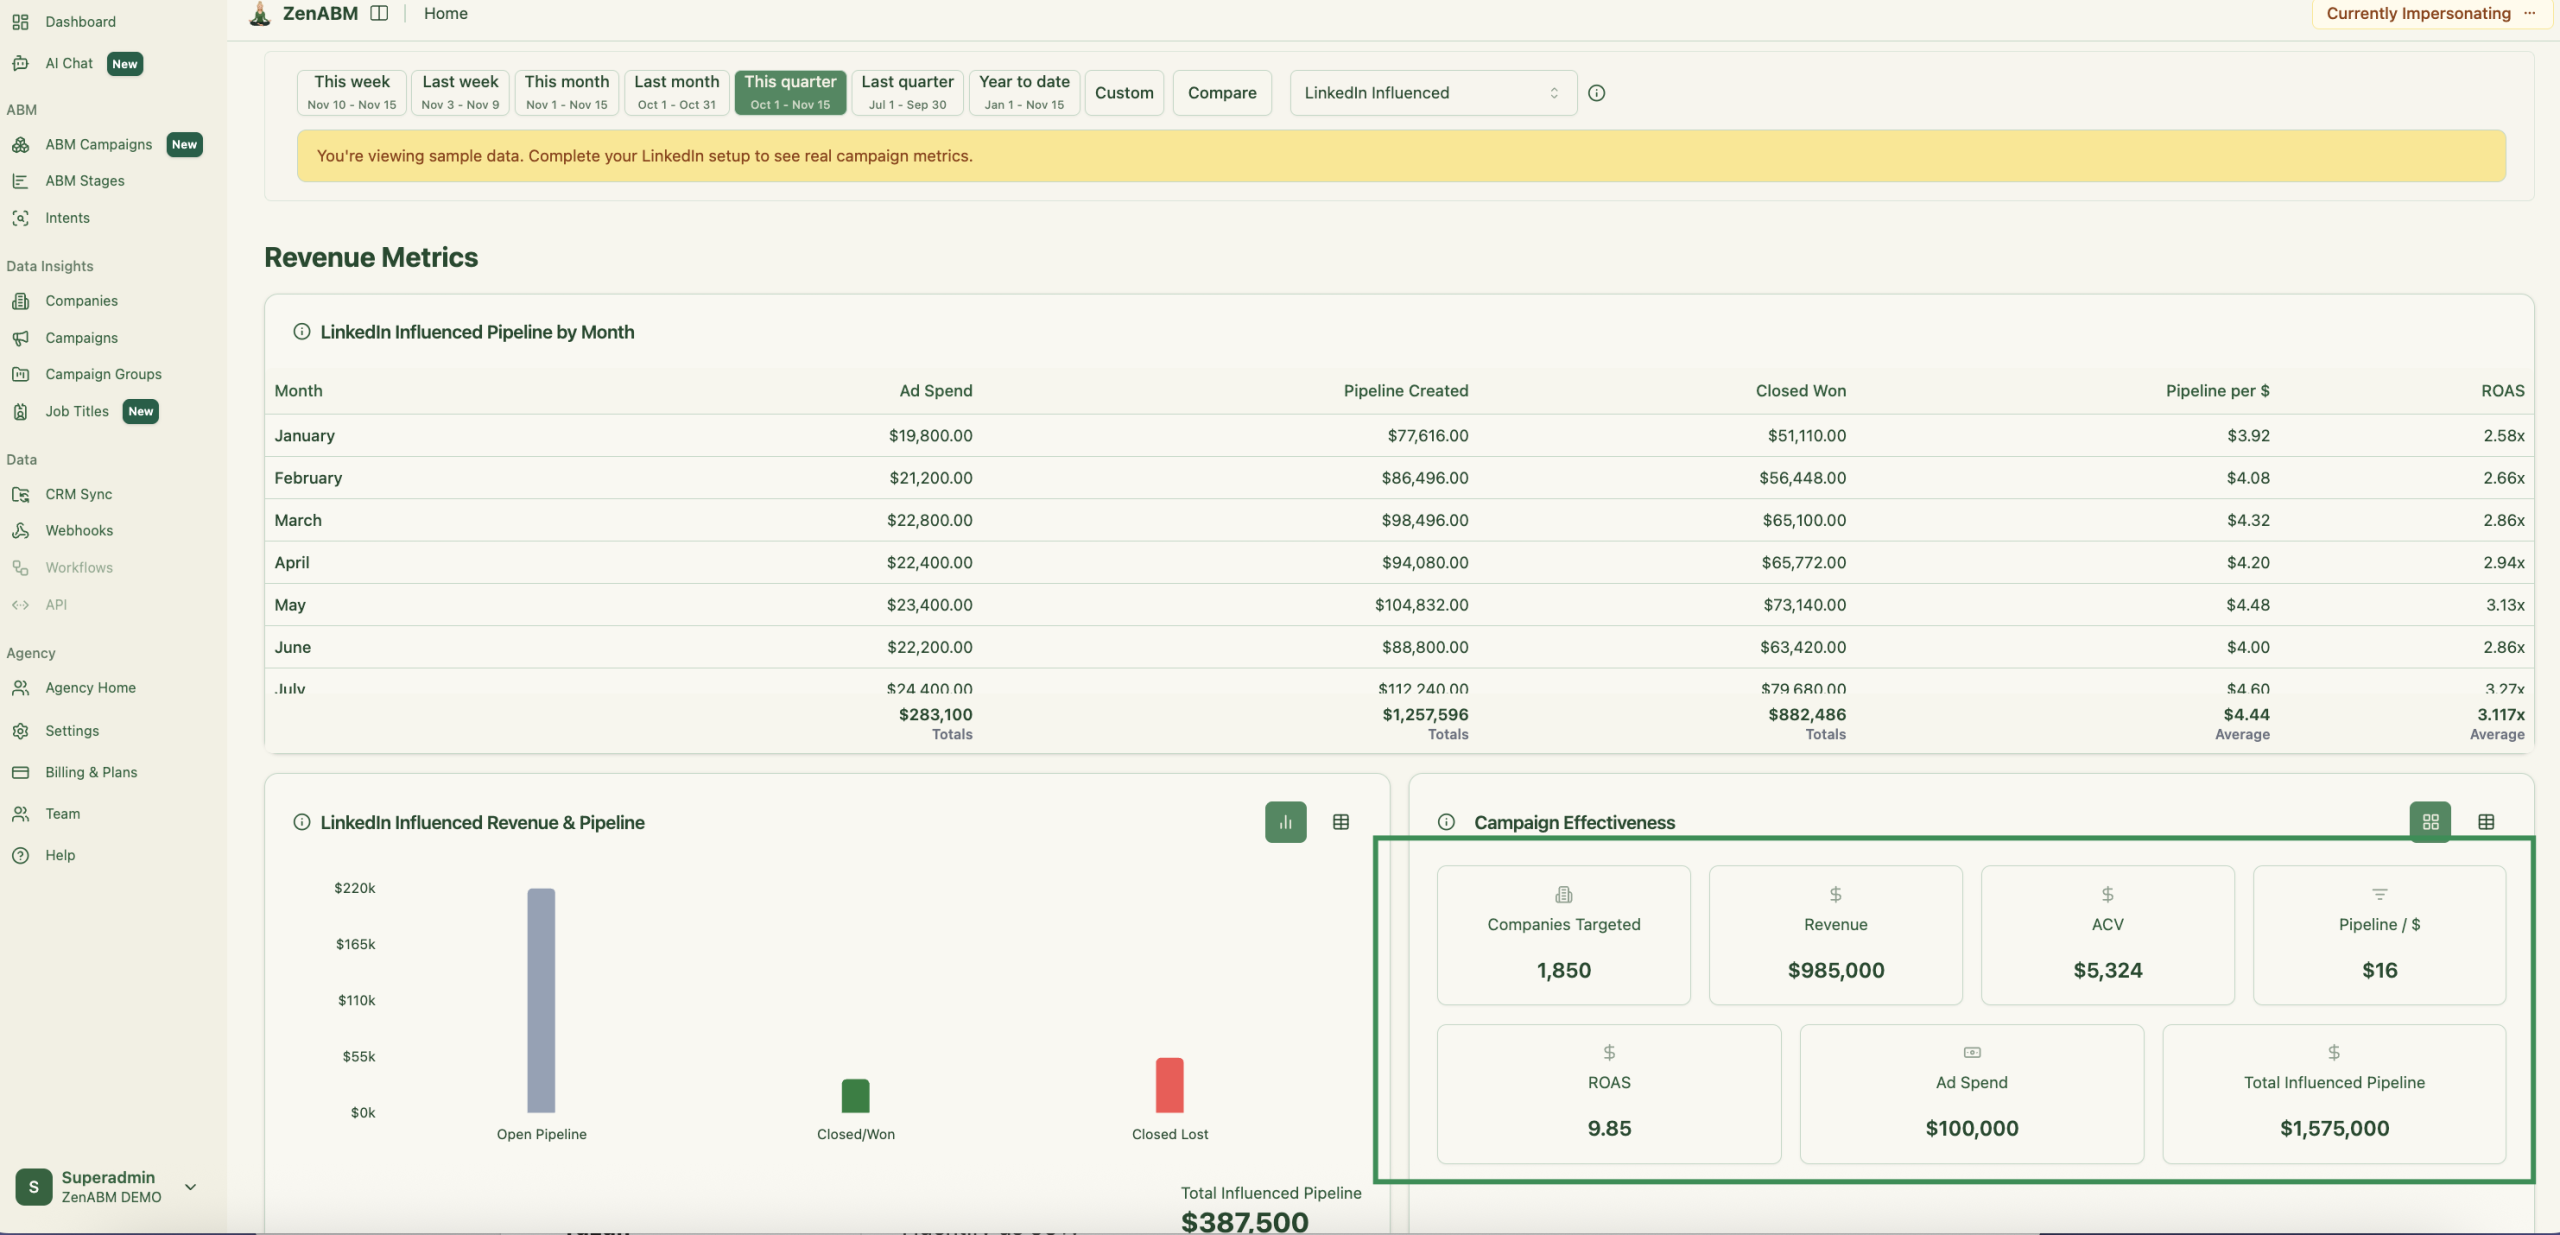
LinkedIn Influenced Pipeline by Month – monthly breakdown of pipeline created, closed-won revenue, ad spend, and ROAS.
-
Pipeline Created – total pipeline generated from accounts influenced by your LinkedIn campaigns.
-
Closed-Won Revenue – revenue from deals influenced by LinkedIn ads.
-
Pipeline per $ Spent – efficiency metric that shows how much pipeline you generate per advertising dollar.
-
ROAS (Return on Ad Spend) – revenue or pipeline return compared to your ad spend.
-
Total Influenced Pipeline – sum of open, closed-won, and closed-lost pipeline influenced by your LinkedIn campaigns.
-
Campaign Effectiveness Metrics – including:
-
Companies Targeted
-
Revenue Influenced
-
Average ACV
-
Pipeline per $
-
ROAS
-
Ad Spend
-
Total Influenced Pipeline
-
-
Company-Level Engagement Metrics – impressions, engagements, and clicks per company (7/30/90 days + all-time).
-
ABM Stage Progression – number of accounts moving through stages (identified → aware → interested → considering → selecting).
-
Engagement Scores – current and total engagement scores showing level of interest per account.
-
Intent Signals – which product themes or campaign groups each company is engaging with.
-
Campaign-Level KPIs – impressions, clicks, CTR, spend, CPC, CPL, and company-level engagement for each campaign.
-
Account Journeys – full timeline of touchpoints for every account across campaigns.
-
Persona / Job Title Insights – impressions, engagements, and clicks by persona or job title group.
-
Account Ranking and Prioritization – top engaged accounts, high-intent accounts, and accounts ready for outreach.
In short: ZenABM = full-funnel ABM analytics + AI insights + clean revenue attribution.
ZenABM – AI features
ZenABM allows you to analyse your LinkedIn ad performance data and ABM campaign performance data with AI.
ZenABM integrates an MCP server and an AI chatbot that allows you to query your LinkedIn ad and ABM data in natural language — asking questions like “Which accounts moved from Interested to Selecting this quarter?” or “What’s my pipeline per $ spent across campaigns?” Its AI layer pulls from both raw LinkedIn engagement data from LinkedIn Campaign Manager’s API and ZenABM’s processed insights (intent, account scoring, funnel stages), giving you on-demand, context-aware answers & recommendations. ZenABM gives you useful starter prompts and then follow up prompts for each query:
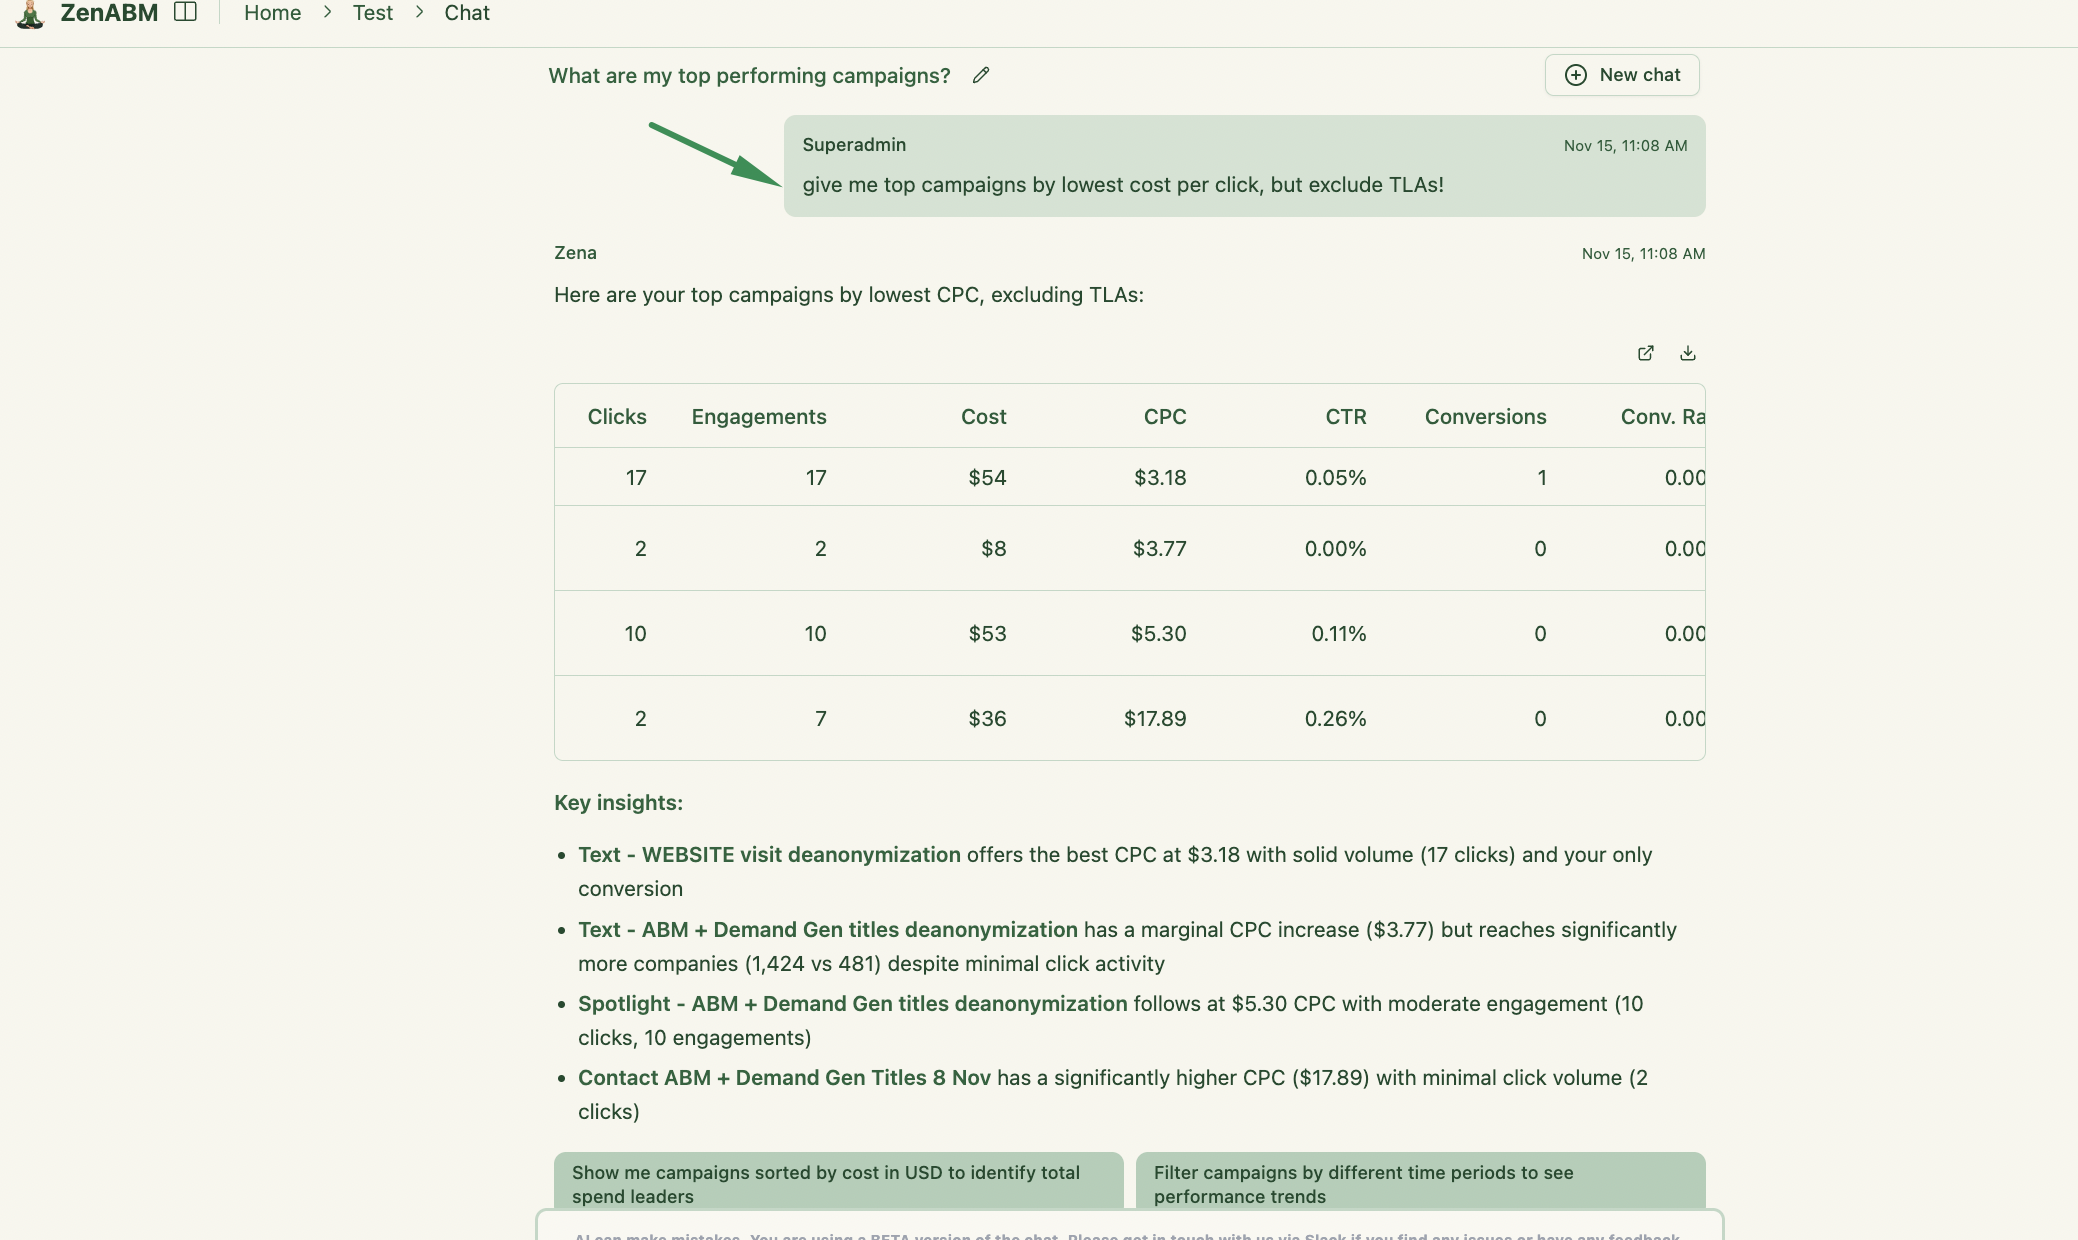
This makes it far more interactive and actionable for marketers to understand how their Linkedin ad ABM programs are performing. If you’re still copying and pasting your LinkedIn ad performance data – try ZenABM with AI chatbot and chat to your LinkedIn ads for free!
ZenABM Analytics Use Cases
In practice, these dashboards unlock a few high-value use cases:
- Proving ABM ROI: I quickly build executive reports showing exactly how our LinkedIn ad spend translated to pipeline. For example, I can state “This quarter our ABM program influenced $500K in pipeline, $120K of which has closed, yielding a 4x ROAS.” Those numbers come straight from ZenABM’s dashboard without extra Excel work. It’s immensely helpful for justifying budgets.
- Prioritizing Sales Outreach: ZenABM’s account scores are a goldmine. Accounts with high scores (lots of recent clicks/engagements) are “hot leads” for our BDRs. We even set up workflows so that when an account’s score passes a threshold, a sales task is created. Instead of guessing who’s interested, our SDRs see a list of high-intent companies pulled right from ZenABM and can reach out immediately.
- Campaign Optimization: Because ZenABM ties engagement to accounts, I can test and compare creatives. For example, if Campaign A generated 5 opportunities and Campaign B only 1, I know where to double down. We might reallocate spend or tweak copy based on which ads got the most high-quality engagement. It’s like having built-in A/B testing feedback for LinkedIn ads.
- Content Personalization: We tag our ads by topic (e.g. “Data Security”, “Integrations”) and ZenABM shows which companies clicked on which topics. Armed with that info in CRM, our sales reps tailor their messages. If a prospect clicked on the “Integration webinar” ad, I know to mention integration in the call. This level of intent insight is why our open rates and replies went up once we started using ZenABM.
These are just a few examples. Across marketing and sales, teams use ZenABM to align strategies. One of my favorite moments was handing our CEO a ZenABM report: “The $X we spent on LinkedIn ads generated Y new opportunities from target accounts. Here are the logos.” That clarity — connecting ads to actual logos and deals — changes the conversation. For more detail on running LinkedIn ABM, see our guide Running ABM on LinkedIn – The Ultimate Guide.
Real-Time CRM Sync
One of ZenABM’s game-changing features is the two-way CRM sync. I’ve set it up with HubSpot and it pushes every important ABM metric directly into our CRM records. As soon as a target account sees or clicks an ad, ZenABM updates that account’s HubSpot Company properties with engagement counts, and even the specific campaign names they interacted with.
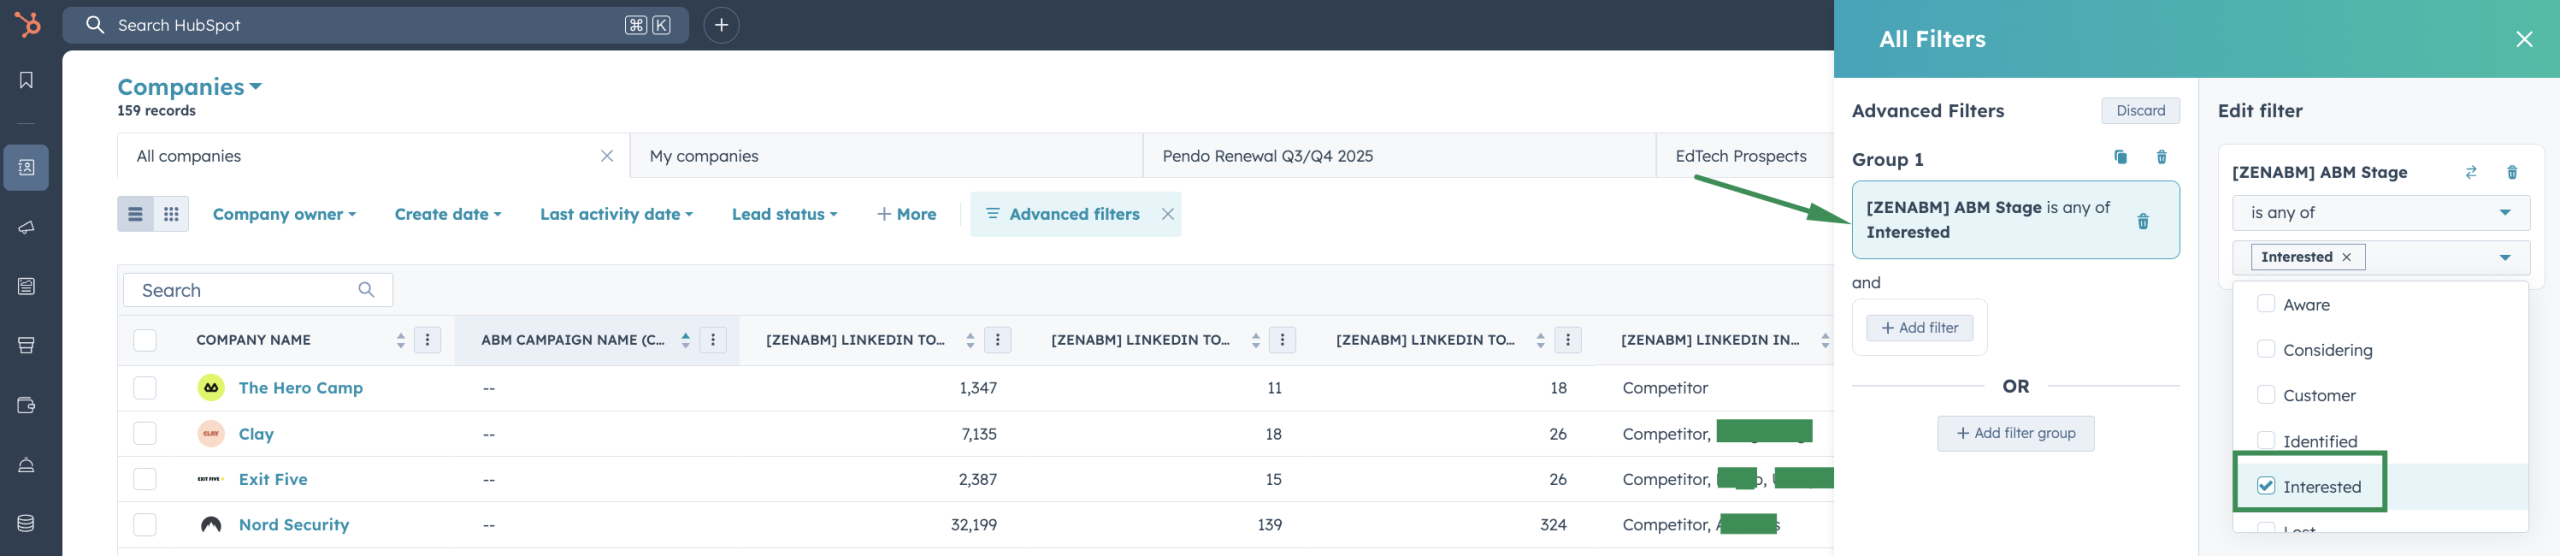
For example, each company in our CRM now has properties like LinkedIn 30-day engagements, Engagement Score, and Last Campaign Clicked. Our sales reps love this – the minute they open a company record they see, “Hey, this account clicked 3 ads last week on product features.” It triggers timely outreach. We even push ABM Funnel Stage (Aware, Interested, etc.) into CRM so the sales team knows exactly where an account is in the journey.
On the flip side, ZenABM pulls in our pipeline data. Whenever a deal closes in HubSpot, ZenABM attributes it to any campaigns that company engaged with. This means our dashboards can show influenced pipeline and closed revenue per campaign. In short: marketing’s ad engagement and sales’ deal data live in sync. If a cold account suddenly books a meeting after an ad, ZenABM captures that in real time. No more manual exports or missed opportunities.
ROI Reporting
Thanks to the CRM integration, ZenABM’s ROI reporting is fully automated. The dashboard breaks down total influenced pipeline, closed revenue, and even calculates ROAS (return on ad spend) for each campaign. In our experience, this has been revolutionary. I can say “This campaign spent $10K and we earned $100K of pipeline, so that’s 10x ROAS” with confidence. Here’s an example of what we see:

The chart above (taken from ZenABM) shows pipeline and revenue influenced by each ad campaign. Notice how pipeline (greay bars) is separated from the actual closed revenue (green portion). We can filter by date range or campaign group, and instantly see metrics like:
- Total Influenced Pipeline: Sum of all open deals tied to our LinkedIn ads.
- Closed-Won Revenue: Deals from ABM accounts that closed (tracked in CRM).
- Return on Ad Spend (ROAS): Pipeline or revenue per dollar spent on ads.
- Deals Created: How many opportunities each campaign generated.
Armed with this, I no longer guess which ads “worked.” If one campaign shows $50K pipeline and another shows $0, we reallocate budget immediately.
ZenABM’s influence attribution (basically “last known contact” model) ties a deal back to the ads that the company saw or clicked. For any marketer or leader, that level of transparency is gold.
If you want to see how it looks live, book a demo with us. We’ll show you your own dashboard populated with example data so you can play with the filters and charts yourself. (And of course you can also start a free trial on your account to explore right away.)
Comparisons
You might wonder how this stacks up against other approaches. Before ZenABM, we tried manually exporting LinkedIn ad data and matching it to CRM deals in spreadsheets. It was painful and error-prone. Other platforms either focus on web traffic or require heavy setup. ZenABM is built specifically for LinkedIn ABM, so the dashboards and sync work out-of-the-box for this channel.
For example, native LinkedIn campaign manager only tells you generic stats (impressions, clicks) and won’t reveal which target companies engaged. Traditional CRM reports don’t include ad behavior. With ZenABM, there’s no waiting on a data engineer or BI team – we get account-level ABM insights immediately. And compared to big ABM suites or CDPs, ZenABM is lean and affordable, making it a great fit for startups and SMBs. Ultimately, ZenABM ties together pieces that marketers otherwise have to juggle (ads, CRM, reporting) and delivers a unified view.
If you’re ready to ditch the spreadsheets and truly measure your LinkedIn ABM, ZenABM can help. Book a demo or start a free trial and see for yourself how easy reporting can be.
Tracking accounts, not just clicks, has made all the difference in my ABM programs. With ZenABM’s analytics dashboards, I can confidently say we know exactly what our ads are doing for pipeline and ROI. I hope this guide gives you the insight to do the same for your team.
Ready to get started? Book a demo or sign up today and see how ZenABM turns your LinkedIn ads into measurable ABM success.
